. 2024 Sep;8(9):1735-1750.
doi: 10.1038/s41559-024-02485-7. Epub 2024 Aug 28.

Sugar assimilation underlying dietary evolution of Neotropical bats

Affiliations

Sugar assimilation underlying dietary evolution of Neotropical bats

Jasmin Camacho et al. Nat Ecol Evol. 2024 Sep.

Abstract

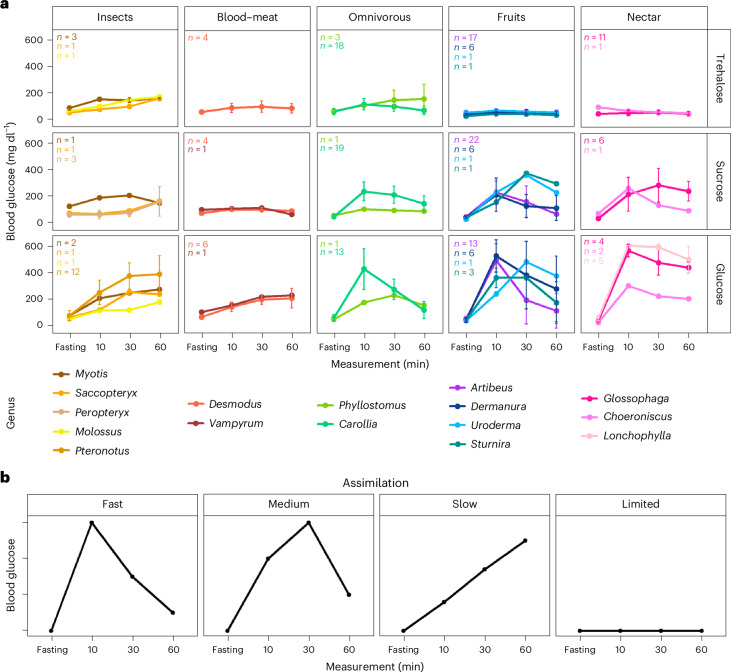
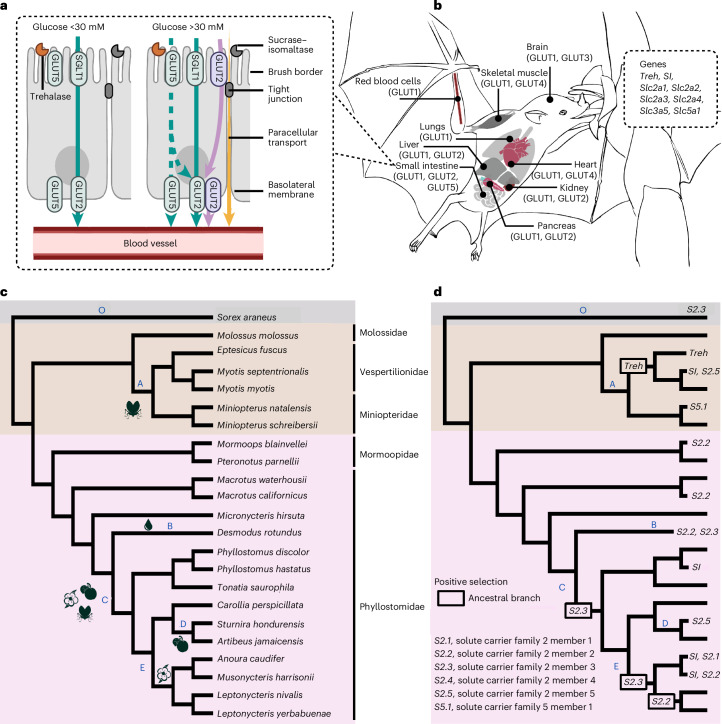
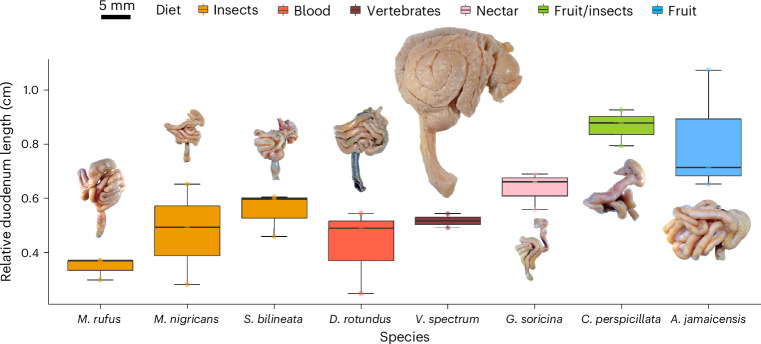
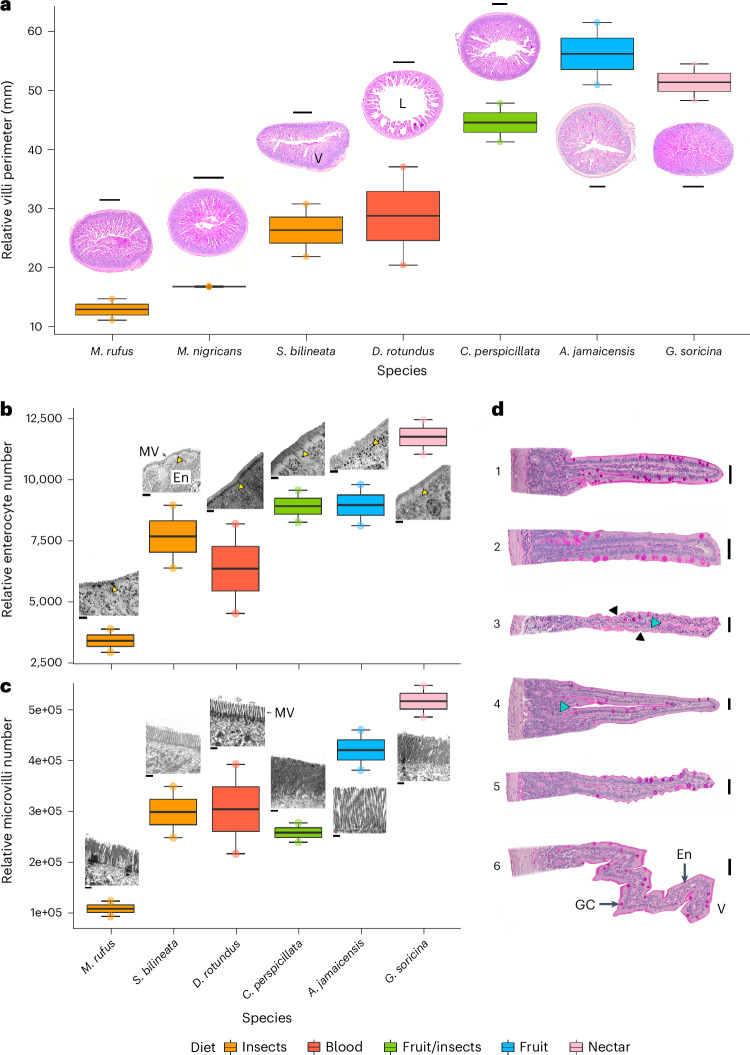
Dietary specializations in animals lead to adaptations in morphology, anatomy and physiology. Neotropical bats, with their high taxonomic and trophic diversity, offer a unique perspective on diet-driven evolutionary adaptations. Here we assess the metabolic response to different dietary sugars among wild-caught bats. We found that insectivorous bats had a pronounced metabolic response to trehalose, whereas bats with nectar and fruit-based diets showed significantly higher blood glucose levels in response to glucose and sucrose, reaching levels over 750 mg dl-1. The genomic analysis of 22 focal species and two outgroup species identified positive selection for the digestive enzyme trehalase in insect eaters, while sucrase-isomaltase showed selection in lineages with omnivorous and nectar diets. By examining anatomical and cellular features of the small intestine, we discovered that dietary sugar proportion strongly impacted numerous digestive traits, providing valuable insight into the physiological implications of molecular adaptations. Using hybridization chain reaction (HCR) RNA fluorescence in situ hybridization, we observed unusually high expression in the glucose transporter gene Slc2a2 in nectar bats, while fruit bats increased levels of Slc5a1 and Slc2a5. Overall, this study highlights the intricate interplay between molecular, morphological and physiological aspects of diet evolution, offering new insights into the mechanisms of dietary diversification and sugar assimilation in mammals.


Conflict of interest statement

The authors declare no competing interests.

Figures

Fig. 1
Fig. 1. Glucose tolerance tests for three different dietary sugars.
a, Average assimilation curves for trehalose, sucrose and glucose among Neotropical bats with different food preferences: insects, blood or meat, mixed (omnivorous), fruits and nectar. The sample size varied among genera from 1 to 52 individuals (Extended Data Table 1). The data are presented as mean values ± standard deviation for a sample size greater than three individuals. b, General curves to describe the temporal pattern of sugar assimilation. Source data
Fig. 2
Fig. 2. Molecular basis of sugar assimilation.
a, Dietary sugar assimilation begins in the small intestine, along the brush border of enterocytes, where dietary enzymes TREH, trehalase, and SI, sucrase–isomaltase, are located. Glucose transporters (SLC2A2/GLUT2 and SLC2A5/GLUT5), sodium-glucose co-transporter (SGLT1) and paracellular transport determine the rate of glucose absorption into the bloodstream under low (<30 mM) and high (>30 mM) glucose concentrations. While GLUT5 is primarily a fructose transporter, it has the capacity to transport glucose,. b, Glucose transporters move glucose from the bloodstream into specific tissues. The genes include: Treh, SI, Slc2a1, Slc2a2, Slc2a3, Slc2a4, Slc2a5 and Slc5a1. c, Species topology and foraging data follow Rojas et al. 2018. Insect-feeding branch leading to vesper and Miniopterus bats (A), blood-feeding (B), ancestral branch towards omnivores (C), obligate fruit eating (D) and nectarivore ancestral branch (E). d, Exploratory positive selection tests were performed using aBSREL with Holm–Bonferroni correction. Duodenal-enriched genes (P < 0.01) are shown across ancestral and extant Neotropical bats, using shrew as an outgroup (O).
Fig. 3
Fig. 3. Relative length of duodenum associated with gastrointestinal tract morphology from eight bat species with different diets.
Duodenum length relative to torso length in each species (shoulders to rump). S. bilineata, insectivorous; M. nigricans, insectivorous; M. rufus, insectivorous; D. rotundus, haematophagous; V. spectrum, carnivorous; C. perspicillata, omnivorous; A. jamaicensis, frugivorous; G. soricina, nectar-eating bat. Three biological replicates per species are reported, except for V. spectrum with two individuals. In the boxplots, the centre line represents the median, the limits or hinge are the first and third quartiles (the 25th and 75th percentiles), the whiskers extend to the largest and smallest value no further than 1.5× interquartile range) and the points represent the individual data. In general, species with fruit and nectar diets tend to have longer duodenum than the blood, meat and insect-eating species. Source data
Fig. 4
Fig. 4. Histology of duodenum of bats with different diets.
a, Relative villi perimeter across the duodenum related to cross sections for each species. b, Relative number of enterocytes along the duodenum related to TEM of the enterocytes and microvilli; c. Relative number of microvilli along the duodenum related to TEM of microvilli. d, Different types of villi in bats; no. 1 and no. 2, finger-like villi; no. 3, finger-like villi with entrances (black triangle) and gap (blue triangle); no. 4, arch-like villi with gap (blue triangle); no. 5, new villi ‘ruffled’; and no. 6, zig-zag villi (nos. 1, 4 and 5 were extracted from C. perspicillata; no. 2 from S. bilineata; no. 3 from G. soricina; and no. 6 from A. jamaicensis). The species include: M. rufus, S. bilineata, D. rotundus, C. perspicillata, A. jamaicensis and G. soricina. Periodic acid–Schiff staining was performed for a and d. Scale bars, 250 µm (a), 2 µm (b), 0.4 µm (c), 20 µm (nos. 1–3 and 5, d) and 25 µm (nos. 4 and 6, d). The yellow triangles in b are pointing at tight junctions between enterocytes (En). MV, microvilli; V, villi; L, lumen; GC, goblet cells. Measurements were taken in different sections of the duodenum and are reported from one individual per species with two technical replicates for the histology section. For TEM, we had one individual and five technical replicates for enterocyte width and microvilli number, and the extrapolation to the whole duodenum was done for the two technical replicates from the histology sections. In the boxplots, the centre line represents the median, the limits or hinge are the first and third quartiles (the 25th and 75th percentiles), the whiskers extend to the largest and smallest value no further than 1.5× interquartile range and the points represent the individual data. Source data
Fig. 5
Fig. 5. HCR RNA-FISH in the duodenum of bats from different diets.
a, RNA expression is shown for bats fed a single dose (5.4 mg kg−1body weight) of glucose. We performed HCR RNA-FISH with probe sets targeting messenger RNA (mRNA) for genes Slc5a1, Slc2a2 and Slc2a5 on fixed paraffin-embedded bat intestinal tissue and quantified the RNA fluorescent signal per enterocyte. An example composite image of the duodenum with all probes labelled with anatomical features is shown. The apical epithelial layer is shown with a fine-dotted line, and the microvilli brush border is shown with a dashed line; goblet cells are denoted by ‘G’. Scale, 10 µm. bi, 40× overview images of the intestinal villi for two omnivorous, two insectivorous, one frugivorous and two nectarivorous species. Scale, 50 µm. Negative control with no probes (b), fruit (A. jamaicensis (n = 2)) (c), insect (M. minuta* (n = 1) (d) and P. parnellii (n = 4) (e)), omnivore (C. perspicillata (n = 4) (f) and P. discolor (n = 1) (g)), nectar (G. soricina (n = 4) (h) and A. geoffroyi (n = 4) (i) at t = 10 or *t = 60. b′–i′, Enlarged view of enterocytes along the villi. Scale bar, 10 µm. HCR probe sets are shown in cyan (Slc5a1), magenta (Slc2a2) and red (Slc2a5). DAPI (yellow) labels the cell nuclei. Bright, uniform and large circular spots (white) are background noise from amplifiers.
Fig. 6
Fig. 6. Parsimony-based evolutionary inferences of blood glucose levels in relation to gene expression.
Average species blood glucose levels across 60 min (AUC) and change in gene expression 10 min after eating a 20% glucose solution. Most dietary guilds are represented by two species: insect, P. parnelli and M. minuta; fruit, A. jamaicensis; nectar, A. geoffroyi and G. soricina. P. discolor and C. perspicillata are omnivores incorporating large proportions of nectar or fruits, respectively, in their diet. Right: results of the single-cell image analysis taken from a minimum of 20 cells at fasted (t = 0) and fed (t = 10), presented as ridgeline density plots, coloured by the HCR probe and set as follows: Slc5a1 (cyan), Slc2a5 (yellow) and Slc2a2 (magenta). The log2 values of fluorescent intensity are displayed for t = 0 in a lighter shade and t = 10 in a darker shade. Games–Howell pairwise comparisons with Holm–Bonferroni P adjustments were used to evaluate differences in gene expression across species (Extended Data Fig. 5). Shared gene expression responses (no notable differences) are taken as evidence for inheritance from a common ancestor. Significant gene expression differences among species (nent, P < 0.001) and blood glucose levels at 10-min post-feeding (Extended Data Table 4) are noted as apomorphies on the tree as follows: a: a decrease in Slc5a1 in M. minuta (nent = 23) and blood glucose levels 200 mg dl−1 (n = 3), b: an increase in Slc2a5 expression in A. jamaicensis (nent = 43) and blood glucose levels 600 mg dl−1 (n = 6), c: a decrease in Slc2a5 expression and an increase in Slc2a2 gene expression in A. geoffroyi (nent = 76) and G. soricina (nent = 95), with an increase in blood glucose (>600 mg dl−1) and d: the highest expression of Slc2a2 and the highest average reported blood glucose levels in G. soricina (n = 7, >750 mg dl−1). Source data
Extended Data Fig. 1
Extended Data Fig. 1. Phylogenetic signal.
a) Comparison of assimilation curves for glucose, sucrose, and trehalose solutions among Neotropical bats with different food preferences: high sugar in glucose and sucrose graphs refer to frugivorous and nectarivorous bats, while low sugar refers to insectivorous, carnivorous and hematophagous bats; high sugar in the trehalose graph refers to insectivorous bats and low sugar refers to the rest of the dietary categories; omnivores have their own category because they have diets where the three sugars are present in relatively high proportions. The Bayesian multilevel phylogenetic model estimated blood glucose levels for each time point and for each group, data are presented as mean values +/− SEM; we included the taxa for which we had data for each individual sugar (Supplemental Table 1). For glucose assimilation we included 22 species, for sucrose assimilation 18 species and for trehalose assimilation 19 species. b) Table. Phylogenetic signal (Pagel’s λ) evaluated for the assimilation proxy (corrected area under the curve) of glucose, sucrose and trehalose in Neotropical bats. Source data
Extended Data Fig. 2
Extended Data Fig. 2. Alphafold protein predictions and foldseek comparisons.
Ribbon representation of AlphaFold modeled proteins, viewed in the plane of the membrane, from positive selected genes. The human reference protein structure has functional protein features highlighted using PyMOL for protein orientation as follows for 1) SI: P-type 1 and 2 are colored in magenta, the binding sites for sugar are colored in green, and the known mutations that affect function are colored in red (a-b); and 2) GLUTs: transmembrane (TM) 1 and 4 in the N-terminal domain are colored in cyan and light cyan, respectively; TM 7 and 10 in the C-terminal bundle are colored in cyan and light cyan, respectively; intracellular domain helices (ICH) unique to the sugar transporters are shown in yellow (c-e); single amino acid change (R238C) in the human GLUT5 model relates to colon cancer (Warburg effect, Tate et al. 2019). For each GLUT transporter shown, the C-terminal transmembrane (TM) bundle is located on the left and the N-terminal TM bundle is located on the right. The C- and N- terminal TM bundles transport glucose with a rocker-switch-type movement1. TM7 and TM10 support a gated-pore mechanism for glucose binding and release. The intracellular helices (ICH) domain provides stabilization for conformational changes. Foldseek structural comparisons between pairs of species for a-b) SI; c) GLUT2; d) GLUT3; and e) GLUT5. Each protein comparison is based on genes undergoing positive selection and is phylogenetically informed (f). Observed structural changes are summarized as a TM-score (TM-score = 1 is a perfect structural match). Arrows highlight structural changes in SI that relate to enzymatic function and in GLUTs where glucose binds extracellularly (ext) and where structural changes might affect substrate transport (int). (a) Folkseek comparisons for sucrase-isomaltase (SI) of vesper bats in the genus Myotis and Eptesicus. We observe global differences among Mytois species in the sucrase subunit’s P-type 2 domain, as well as the isomaltase subunit P-type 1 domain. SI activity relies on attachment to the gastrointestinal mucosa’s plasma membrane, facilitated by the isomaltase subunit’s P-type 1 domain. Further, changes along the alpha and beta strands of both subunits have been known to cause dissociation of SI from the membrane and a single amino acid change in the second helical domain of the isomaltase subunit is sufficient to cause dissociation of SI from the membrane and the inability to process sucrose. It is possible that the changes in Myotis, compared to other insect-feeding bats like Eptesicus, provides the ability to process sugar, preventing them from having intestinal malabsorption and intestinal distress from undigested sugar. Greater differences in Myotis SI structure may reflect their ability to assimilate sucrose. (b) Folkseek comparisons for SI structure for Myotis, P. parnellii, P. hastatus, and A. caudifer. For the sugar-eating phyllostomid bats, we observe localized changes to the isomaltase subunit’s P-type 1 domain, which is in line with the fact that ingesting high-sugar sources is expected to increase sugar metabolism proteins, particularly SI expression. (c) We detected positive selection in Slc2a2 in the ancestral branch leading to nectarivores as well as in M. harrisonii. Compared to the outgroup species P. parnellii, we observe differences predicted to be along the extracellular N-terminal between TM bundles 4 and 5, which is usually highly conserved among sugar transporters. We also predicted differences along the C-terminal end of the ICH5 domain, which undergoes post-translational modification for stability along the cell surface of pancreatic beta cells. d) GLUT3 predicted structure and Foldseek comparisons between nectar bat A. caudifer (gray) and P. parnellii (red); vampire bat D. rotundus (gray) and P. parnellii (red), and D. rotundus (gray) and A. caudifer (red). The amino acid substitutions are located along extracellular C-terminal transmembrane (TM) 10, where glucose binds, as well as within the plasma membrane, where it interacts with TM7 to coordinate glucose transport. We also identified changes at the intracellular side of the C-terminal domain, possibly affecting the degree of opening during glucose transport. This implies that the GLUT3 transporter may undergo modifications to glucose delivery to the brain’s neurons that may contribute to protection against their heightened susceptibility to fasting. e) Folkseek comparisons for GLUT5 predictions between Myotis species, the genus Myotis (gray) and Eptesicus (red), and the fruit bat S. hondurensis (gray) and insect bat M. blainvillei (red). We observe differences along the intracellular helices (ICH) domain 2-3, which anchor the conformational changes needed to transport glucose/fructose.
Extended Data Fig. 3
Extended Data Fig. 3. Measurements from museum samples.
a) Measures extracted from the intestine cross sections. 1. Villi-lumen area (VLA); 2. Sample area (SA); 3. Villi perimeter in the sampled area (VPSA); 4. Lumen area (LA); 5. Cross section perimeter (CSP). The measurements for the VPSA were taken twice with similar results. b) Intestinal segments selected for analysis. The duodenum is the first section of the intestine from the end of the stomach-pylorus to the duodenojejunal flexure. The jejunum is the next proximal ~2/3 of the small intestine until the presence of peyer’s patches, which marks the ileum, through histology.
Extended Data Fig. 4
Extended Data Fig. 4. qPCR summary.
(a) Primer sequences. (b) RT-qPCR heatmap of normalized expression (ΔCt) relative to housekeeping gene Gapdh for nutrient transporter genes Slc2a2, Slc5a1 and digestive enzyme gene SI. Five species representing four dietary guilds are shown [insect, Ptenonotus parnellii (Pp, nt=10 = 3, nt=0 = 3); omnivore, Carollia perspicillata (Cp, nt=10 = 2, nt=0 = 3); fruit, Artibeus jamaicensis (Aj, nt=10 = 2, nt=0 = 1); nectar, Anoura geoffroyi (Ag, nt=10 = 4, nt=0 = 3) and Glossophaga soricina (Gs, nt=10 = 3, nt=0 = 1)]. Samples are ordered by hierarchical clustering using Euclidean distance and the colors assigned to the clusters correspond to the dietary guild. (c) Logfold expression change (ΔΔCt) of Slc2a2, Slc5a1 and SI at t = 10 relative to t = 0. (d) No significant differences in logfold expression change were determined between t = 10 and t = 0 individuals for species by one-way ANOVA (Slc2a2; p = 0.178, Slc5a1; p = 0.663, SI; p = .0568).
Extended Data Fig. 5
Extended Data Fig. 5. HCR data.
HCR RNA-FISH data for Slc5a1 (A), Slc2a5 (B), and Slc2a2 (C). Image data for fluorescence intensity was log2 transformed for comparisons between time points within a species and across species. Two to three sections per individual with good morphology were chosen for study. For each section, 5-10 cells were isolated for analysis. Fluorescence signals were quantified using threshold-based segmentation and spot detection (n = 17-55 cells per treatment per species) in FIJI. We performed Games-Howell pairwise comparisons using the ggstatsplot function in R, with holm-bonferroni p-adjustments for multiple comparisons. Within each boxplot, a red dot denotes mean values, horizontal black lines denote median values, the boxes represent the range from the 25th to the 75th percentile of each group’s value distribution, while the vertical lines indicate the most extreme values within 1.5 times the interquartile range from the 25th and 75th percentiles of each group. Mean values are listed in Extended Data Table 5. Comparisons within species (t = 0 vs. t = 10) with significant expression level differences are bracketed at the bottom of each boxplot graph as follows: AGt0-t10 Slc2a2 (padj=4.11e-04), AJt0-t10 Slc2a5 (padj=1.66e-03), AJt0-t10 Slc2a2 (padj=2.82e-04), CPt0-t10 Slc5a1 (padj=0.0001), CPt0-t10 Slc2a5 (padj=5.27e-08), CPt0-t10 Slc2a2 (padj=0.001), GSt0-t10 Slc5a1 (padj=4.60e-10), GSt0-t10 Slc2a5 (padj=2.80e-09), PPt0-t10 Slc5a1 (padj=7.50e-10), PPt0-t10 Slc2a5 (padj=4.13e-09), PPt0-t10 Slc2a2 (padj=0.001).Comparisons between species at each respective time point are shown at the top of each graph, where only significant data (padj < 0.001) are shown as follows: Slc5a1 (A) AGt0-GSt0 (padj=7.24e-03), AGt0-PPt0 (padj=5.91e-05), AJt0-GSt0 (padj=1.03e-03), AJt0-PPt0 (padj=0.001), AJt0-CPt0 (padj=5.67e-07), AGt10-AJt10 (padj=1.01e-04), AGt10-CPt10 (padj=4.70e-08), AGt10-GSt10 (padj=2.59e-08). AGt10-CPt10 (padj=4.74e-05); Slc2a5 (B) AGt0-AJt0 (padj=6.83e-03), AJt0-PPt0 (padj=5.60e-07), AGt10-AJt10 (padj=1.10e-04), AGt10-CPt10 (padj=1.19e-05), AGt10-PPt10 (padj=1.19e-05), CPt10-GSt10 (padj=1.91e-05), GSt10-PPt10 (padj=1.13e-06); Slc2a2 (C) AGt0-GSt0 (padj=3.38e-03), AGt0-PPt0 (p = 4.75e-11), AGt0-AJt0 (padj=3.19e-11), AGt0-CPt0 (padj=6.70e-06), AGt10-GSt10 (padj=3.58e-06), AGt10-PPt10 (padj=8.38e-03), GSt10-PDt10 (padj=0.001), AJt10-PPt10 (padj=8.07e-05), GSt10-PPt10 (padj=3.49e-10). The following species represent each dietary guild: insects, Ptenonotus parnellii (PP, n = 4) and Micronycteris minuta (Mm n = 1); omnivore, Carollia perspicillata (CP, n = 4); fruit, Artibeus jamaicensis (AJ, n = 2); nectar, Glossophaga soricina (GS, n = 4) and Anoura geoffroyi (AG, n = 4). Phyllostomus discolor (PD, n = 1), is an omnivorous bat that has a large portion of nectar in their diet. Only technical replicates are available for species with n = 1. Source data

References

    1. Pauli, J. N., Peery, M. Z., Fountain, E. D. & Karasov, W. H. Arboreal folivores limit their energetic output, all the way to slothfulness. Am. Nat.188, 196–204 (2016). - PubMed
    1. Tokita, M., Yano, W., James, H. F. & Abzhanov, A. Cranial shape evolution in adaptive radiations of birds: comparative morphometrics of Darwin’s finches and Hawaiian honeycreepers. Philos. Trans. R. Soc. B372, 20150481 (2017). - PMC - PubMed
    1. Camacho, J. et al. Peramorphosis, an evolutionary developmental mechanism in Neotropical bat skull diversity. Dev. Dyn.248, 1129–1143 (2019). - PubMed
    1. Morris, Z. S., Vliet, K. A., Abzhanov, A. & Pierce, S. E. Heterochronic shifts and conserved embryonic shape underlie crocodylian craniofacial disparity and convergence. Proc. R. Soc. B286, 20182389 (2019). - PMC - PubMed
    1. Lyons, K., Dugon, M. M. & Healy, K. Diet breadth mediates the prey specificity of venom potency in snakes. Toxins12, 74 (2020). - PMC - PubMed

LinkOut - more resources