. 2024 Nov;8(11):2097-2112.
doi: 10.1038/s41559-024-02523-4. Epub 2024 Aug 28.

Plasmid-encoded insertion sequences promote rapid adaptation in clinical enterobacteria

Affiliations

Plasmid-encoded insertion sequences promote rapid adaptation in clinical enterobacteria

Jorge Sastre-Dominguez et al. Nat Ecol Evol. 2024 Nov.

Abstract

Plasmids are extrachromosomal genetic elements commonly found in bacteria. They are known to fuel bacterial evolution through horizontal gene transfer, and recent analyses indicate that they can also promote intragenomic adaptations. However, the role of plasmids as catalysts of bacterial evolution beyond horizontal gene transfer is poorly explored. In this study, we investigated the impact of a widespread conjugative plasmid, pOXA-48, on the evolution of several multidrug-resistant clinical enterobacteria. Combining experimental and within-patient evolution analyses, we unveiled that plasmid pOXA-48 promotes bacterial evolution through the transposition of plasmid-encoded insertion sequence 1 (IS1) elements. Specifically, IS1-mediated gene inactivation expedites the adaptation rate of clinical strains in vitro and fosters within-patient adaptation in the gut microbiota. We deciphered the mechanism underlying the plasmid-mediated surge in IS1 transposition, revealing a negative feedback loop regulated by the genomic copy number of IS1. Given the overrepresentation of IS elements in bacterial plasmids, our findings suggest that plasmid-mediated IS1 transposition represents a crucial mechanism for swift bacterial adaptation.


Conflict of interest statement

Competing interests

The authors declare no competing interests.

Figures
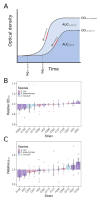
Extended Data Figure 1
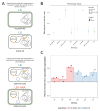
Extended Data Figure 1. A) Schematic representation of the different parameters that can be extracted from growth curves as proxies for fitness.
Growth curves of plasmid-carrying and plasmid-free isogenic strains. The comparison of the maximum growth rate (μmax), maximum OD (ODmax), duration of the lag phase (lag), and the area under the curve (AUC) of plasmid-carrying and plasmid-free clones gives an idea of the fitness effect of the plasmid. The AUC integrates information about μmax, ODmax and lag in a single metric, and thus, is the one we used for our analysis (see Figure 1 in the main text). B) Fitness effects of pOXA-48 in the strains under study using ODmax as metric (relative ODmax of plasmid-carrying vs plasmid-free clones). We did not detect any significant cost in any of the strains (two sided paired t-tests after Bonferroni correction; p > 0.05; n = 13 strains, 6 biological replicates per strain). Black error bars represent the standard deviation (SD) of the relative ODmax for each strain. C) Fitness effects of pOXA-48 in the strains under study using μmax as metric (relative μmax of plasmid-carrying vs plasmid-free clones). We did not detect any significant cost in any of the strains (two sided paired t-tests after Bonferroni correction; p > 0.05; n = 13 strains, 6 biological replicates per strain). Black error bars represent the standard deviation (SD) of the relative μmax for each strain.
Extended Data Figure 2
Extended Data Figure 2. Growth curves during EE.
Optical Density at 600 nm wavelength (OD600) of the strains included in this study measured during 24 hours in alternative days during the EE assay. The day of the EE assay in which we measured bacterial growth is indicated on the right, as well as the experimental conditions (presence/absence of pOXA-48 and presence/absence of AMC). Each strain name is indicated on the top. Each color of the curves represents a different replicate for each strain and condition.
Extended Data Figure 3
Extended Data Figure 3. Frequency of New Junction events (NJ) and Single Nucleotide Polymorphisms (SNPs) or small insertions or deletions (INDELs) during the EE in the different conditions.
NJ events are mutations predicted from split-read sequences which match distant locations in the reference sequence, such as large (>150 bp) deletions/insertions. The frequency of each of the mutational events is shown for each strain and experimental condition at the end of the EE. In general, NJs showed high frequencies for all the strains and conditions (n = 13 strains, 3 biological replicates per strain and condition), suggesting that these potentially produced more notable effects on bacterial fitness during the experiment. From all the mutations captured, very few were fixed (100% freq.; n = 26/256 (10.2%) of the total SNPs; n = 27/376 (7.1%) of the total NJs) in the populations at the end of the experiment.
Extended Data Figure 4
Extended Data Figure 4. Overview of the mutational profile in each evolved replicate population.
Summary of the genetic changes in the evolved replicate populations in the different conditions (grouped in y axis) and species (grouped in x axis). We show the number of events in each replicate population (n=3) grouped by its strain. The label of each strain (E. coli n=4; K. pneumoniae n=7 and C. freundii n=2) is indicated in the lower part of the barplot. The colors of the bars depict the different types of mutations occurring during the EE classified in NJs (IS1-mediated, Non-IS-mediated or mediated by other ISs) and SNPs (intergenic, synonymous or non-synonymous). A general increase in the number of IS1-mediated NJ events can be observed for each replicate population propagated during the EE in presence of pOXA-48 both for K. pneumoniae and C. freundii.
Extended Data Figure 5
Extended Data Figure 5. IS families transposition during EE.
Number of transposition events associated with each of the IS families during the evolution for each species and experimental condition. Barplots represent the number of transposition events per IS family summarized for all the strains of each species studied. We identified those NJ events mediated by ISs in each population, and classified them depending on the family. We noticed that IS1 elements showed specially high transposition levels in most of the species and conditions. However, both in C. freundii and K. pneumoniae we observed that the presence of pOXA-48 significantly triggered the mobilization of IS1 during evolution (stats in Suppl. Fig. 3).
Extended Data Figure 6
Extended Data Figure 6. Analysis of the specificity of the types of mutations for each experimental condition during evolution as described in .
The average similarity (in percentage) among all replicate population pairs both within groups (circular arrows) and between groups (straight arrows) for each experimental condition and each species is shown. Briefly, we analyzed the specificity of the different types of mutations (classified in NJs: Non-IS mediated, Other IS or IS1 mediated; and in SNPs: intergenic, synonymous or non-synonymous) for each condition separately for each species. Significant differences between groups are indicated (***: p< 0.05). Based on these values, we performed two-sided permutation tests to study the significance of the specificity of mutations associated with both pOXA-48 presence (No pOXA-48 vs pOXA-48) and AMC presence (pOXA-48 vs pOXA-48+AMC) considering all replicate populations of each species. Our results show that in none of the species the presence of AMC affected the types of mutations reported during the EE (E. coli, p = 0.124; K. pneumoniae, p = 0.231; C. freundii, p = 0.914), whereas the presence of the plasmid pOXA-48 produced significant differences in mutation types both in K. pneumoniae (p = 0.003) and C. freundii (p = 0.008), but not in E. coli (p = 0.952). The average similarity in the types of mutations was significantly lower in K. pneumoniae and C.freundii when comparing pOXA-48 carrying populations vs pOXA-48 free populations. Overall, these results support the idea that the mutation profiles were dependent on pOXA-48 presence, but not on AMC presence, in K. pneumoniae and C. freundii.
Extended Data Figure 7
Extended Data Figure 7. Capsule loss in the different conditions tested during the fluctuation assay of IS1 transposition and its results including all the controls.
A) Scheme showing capsule loss in the different conditions both with and without pIS1. Our EE observations indicated that non-capsulated K. pneumoniae mutants appeared mainly due to IS1 insertions in the capsule operon in presence of pOXA-48. Hence, the induction of pIS1 in presence of arabinose should repress the transposition of pOXA-48 IS1 elements into the capsule operon due to increased levels of repressor (InsA). B) Phenotypic mutation rate of non-capsulated mutants in logarithmic scale. Left side of the plot shows all the results for the samples tested in LB, including the different phenotypes with 1, 2 or none of the plasmids (pOXA-48; pIS1), while the right plot shows the results of the fluctuation assay in presence of arabinose (LB+ARA). We could detect a clear repression of non-capsulated phenotype in pOXA-48+pIS1 samples in presence of arabinose, reaching levels very similar to those of pOXA-48-free samples (n = 80 independent cultures for No pOXA-48 and pOXA-48 genotypes; n = 20 independent cultures for pOXA-48+pIS1 and pIS1 genotypes). Error bars indicate the likelihood ratio-based 95% confidence interval centered around the maximum likelihood estimate of each genotype. C) Relative fitness levels of non-capsulated vs. capsulated bacteria without and with pOXA-48 resulting from competition assays (n = 3 biological replicates for clones 81 and 92; n = 2 biological replicates for clones 82, 105, 107 and 110). We selected clones with mutations in different genes along the capsule operon: pe (81 [stop codon], 105 [IS1 inactivation]), pb (82 [IS1 inactivation]), and wcaJ (92 [IS1 inactivation], 107 [IS1 inactivation] and 110 [stop codon]). Increase in relative fitness ranged from 14% to 53% in non-capsulated mutants, both in the presence and absence of pOXA-48.
Extended Data Figure 8
Extended Data Figure 8. GAM model results.
A) Predicted partial effects of genomic IS1 copies in the transposition rate of in vivo lineages analyzed through a Generalized Additive Model (GAM). The smooth function (number of basis functions: k = 6) shows a significant decrease in transposition rate (p = 0.032; F = 3.28; R-squared = 0.203; Deviance explained = 29.7%) as genomic IS1 copies increase in the strains, supporting our previous observations. Grey shade indicates the 95% confidence interval area centered around the fitted values predicted by the model. B) Predicted partial effects for the different species (parametric coefficients) included in the GAM. No significant differences were reported between species (two-sided; Intercept t = - 0.704, p = 0.4864; E. coli t = 1.73, p = 0.0929; K. pneumoniae t = 0.1654, p = 0.4366). Solid lines indicate the mean partial effect and dashed lines indicate the 95% confidence interval for each species.
Extended Data Figure 9
Extended Data Figure 9. pOXA-48 variants detected in the selected strains:
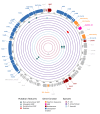
Scheme of pOXA-48 variants in the selected strains for this work as compared against the most common variant of pOXA-48 (K8). Each concentric circle represents one plasmid. From the inner to the outer, the strains are: C021, C286, C309, C324, CF12, CF13, H53, K091, K147, K153, K163, K209, K25. Most mutations found were accumulated in ltrA, a mobile element of the plasmid, in both C. freundii strains, as well as a non-synonymous SNP in a hypothetical protein of unknown function. For E. coli, only one strain showed a synonymous mutation (C286), whereas for K. pneumoniae strains, three showed differences compared with the K8 variant. Interestingly, K153 showed a deletion in the IS1 element around the 10 kbp, which could potentially affect transposition activity. This strain did not show plasmid-mediated IS1 transposition. K209 showed an intergenic SNP in the region between repC and repA, potentially increasing pOXA-48 PCN. K25 showed two SNPs in conjugation related genes.
Extended Data Figure 10
Extended Data Figure 10. Schematic representation of EE+WGS workflow.
This scheme summarizes the main technologies used to sequence each of the samples analyzed during the experimental evolution (Illumina = short-read; Oxford Nanopore Technologies (ONT) = long-read). We combined both short and long read sequencing for getting hybrid closed assemblies of both the ancestors of each strain and of the evolved clones isolated from the populations at day 15. We mainly used short read WGS to filter out possible mutations at day 1 (as a control for the EE), as well as for analyzing the mutations present in the evolved populations and isolated clones at day 15. We used the hybrid assemblies of the ancestors as the reference for the variant calling both populations and clones. From the 117 evolved populations, we discarded 4: a contaminated replicate of C. freundii without pOXA-48, a contaminated replicate of E. coli due to low mapping % when performing the variant calling, and the two hypermutator strains indicated in the main text. We used breseq to perform the variant calling with short-read data. To confirm the results reported by breseq we complemented the variant calling of the clonal samples using long-read data and the Sniffles software (specifically developed to detect Structural Variants). Finally, we also supported the variant calling results with the closed genomes of the evolved clones. We indicate the sequencing technology or the software used for the hybrid assembly/variant calling next to each arrow. We show input samples and analysis results inside rectangles.
Figure 1
Figure 1. Experimental evolution of clinical enterobacteria.
A) Strains used in the EE assay. Phylogenetic tree of the strains included in this study. We selected strains from three different species, including the most representative STs from a collection of extended spectrum ß-lactamase (ESBL) or carbapenemase-producing enterobacteria isolated from hospitalized patients (R-GNOSIS collection). B) Distribution of fitness effects of pOXA-48 in the different strains included in this study in the absence of antibiotics. We represent the relative Area Under the growth Curve (AUC; which encompasses and correlates with other relevant fitness metrics, Extended Data Fig. 2) of pOXA-48-carrying clones compared to the isogenic pOXA-48-free clones to estimate the plasmid fitness effects. Asterisks indicate those strains in which the plasmid imposed a significant cost (two-sided paired t-tests after Bonferroni correction; p < 0.05; n = 13 strains, 6 biological replicates per strain; p = 3.6e-04 for K209). Black error bars represent the standard deviation (SD) of the relative AUC for each strain. C) Experimental design of the EE assay performed in this work for 13 bacterial strains. We propagated bacterial populations with and without pOXA-48 in LB for 15 days (~100 generations, 1:100 daily dilution). We also propagated pOXA-48 carrying bacteria in LB with subinhibitory concentrations of amoxicillin with clavulanic acid (AMC; lower row). D) Bacterial growth (AUC) at the beginning (Day 1) and end (Day 15) of the EE (OD600 a.u.·min). Large empty points indicate the median AUC for each strain included in the experiment (n = 6 populations per strain). Small points correspond to each propagated replicate population. Boxes in the boxplot indicate the interquartile range (IQR) from the first (Q1; 25th percentile, lower limit of the box) to the third (Q3; 75th percentile, upper limit of the box) quartiles. The wide line inside the box indicates the median. Lower whisker represents the minimum observation (Q1-1.5*IQR) and upper whisker represents the maximum observation (Q3+1.5*IQR). Dots falling above or below the whiskers are considered outliers. We observed a significant increase in the AUC for all the species in the three conditions from day 1 to 15. The presence of pOXA-48 or AMC caused no effect in the increase of AUC. Asterisks indicate significant difference between days in AUC for each species (p < 2e-16 for the three species)
Figure 2
Figure 2. Overview of the mutational profiles in the evolved populations.
A) Summary of the genetic changes in the evolved populations in the different conditions of the experiment. Barplots represent the total number of occurrences of each type of event in all propagated populations depending on the experimental condition and species. We summarized the different events as the addition of each type of mutation for all the strains of each species in each condition (note that we used 7 K. pneumoniae, 4 E. coli and 2 C. freundii strains). Events were divided depending on their nature (i.e. if they were Single Nucleotide Polymorphisms (SNPs)/small INDELs or New Junctions (NJ)), and their type (Intergenic, Non-Synonymous or Synonymous SNPs/INDELs; IS1-mediated, Non-IS-mediated, or mediated by other ISs NJs). We classified INDELs as Non-synonymous if they were found in coding regions or Intergenic for those in intergenic regions. We noticed a considerable increase in IS1-mediated NJ events in presence of the plasmid, both in K. pneumoniae and C. freundii, but not in E. coli (see Extended Data Fig. 6; Suppl. Figures 1-13 AB). B) Number of NJ events mediated by IS1 elements at day 15 of the EE for each strain and replicate propagated in each experimental condition. Orange points represent the median value for each strain and condition and each gray point represents an individual replicate population. In order, for E. coli: C021, C286, C309, C324; for K. pneumoniae: H53, K091, K147, K153, K163, K209, K25; and for C. freundii: CF12, CF13.
Figure 3
Figure 3. Adaptive targets in the species under study.
A, B) Plots showing the mutations in the genomes of a K. pneumoniae (A), and a C. freundii (B) strains selected as examples of each species (see Suppl. Figures 1-13 for all the strains). From inside to outside, circles indicate the different replicates of the evolved bacterial populations without pOXA-48 (red), carrying pOXA-48 (blue) and carrying pOXA-48 in presence of AMC (green). Units represent megabases (Mb) in chromosome replicons and kilobases (Kb) in plasmid replicons. Parallel evolution targets are labeled in each circa plot. The different types of SNPs/INDELs are represented by dots, whereas NJ events are depicted by shapes, filled in orange in the case of IS-mediated NJs. IS rearrangements which could be tracked (i.e., confirmed by genomic data, and/or by long-read sequencing) are shown as lines connecting the IS element and its target. Note that as the data of evolved full populations is shown, it is possible to encounter multiple mutations or insertions at intermediate frequencies within the same gene. C, D) Operons parallelly targeted during evolution in our experiment. In the case of E. coli and C. freundii (D), the nlpD-rpoS operon was targeted in multiple strains (Suppl. Fig. 1-6). In almost all of the K. pneumoniae strains, the capsule operon (C) was mutated at the end of the evolution (Suppl. Fig. 7-13). The top part of the plots shows mutations occurred during the EE in the replicates propagated in absence of the plasmid, whereas the bottom part includes the events that happened in pOXA-48 carrying replicates both with and without AMC. Freq. indicates the frequency of the mutations/insertions in the population in percentage. Names of the genes are shown. Function of those genes not named by PGAP are also indicated: gly: glycosyltransferase.
Figure 4
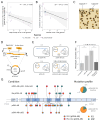
Figure 4. Regulation of IS1 transposition in pOXA-48-carrying strains.
A) Two-sided Pearson correlation between the number of IS1 copies in the genomes of the ancestral strains at the beginning of the experimental evolution and the difference in IS1 transposition events associated with carrying pOXA-48 during the experiment (median events in pOXA-48 carrying minus median events in pOXA-48-free, per strain; n = 3). The grey shadow represents the 95% confidence interval. B) Two-sided Spearman correlation between the change of expression of IS1 elements after pOXA-48 acquisition and the number of IS1 copies in the genome of multiple strains from the R-GNOSIS collection (note that some of these strains are the same as those in the EE: n=5). The grey shadow represents the 95% confidence interval. C) K. pneumoniae (K25 strain) colonies spotted on an LB agar plate either capsulated (darker colonies) or capsule-free mutants (lighter colonies). D) Schematic representation of plasmid pIS1. We cloned the IS1 element of pOXA-48 keeping out the inverted repeats (IRL and IRR) that contain its promoter. The arabinose-inducible promoter PBAD controls the expression of the insAB genes. pIS1 also encodes an apramycin resistance gene for selection. E) Experimental design including the different K25 versions generated for the fluctuation assay to test loss-of-capsule mutation rate. F) Loss-of-capsule phenotypic mutation rate in the different conditions tested. Error bars indicate the likelihood ratio-based 95% confidence interval centered around the maximum likelihood estimate of each genotype. Asterisks denote significant differences (p < 1e-08) between the conditions tested according to two-sided likelihood ratio tests (n = 80 independent cultures for No pOXA-48 and pOXA-48; n = 20 independent cultures for pOXA-48+pIS and pOXA-48+pIS in arabinose [induced]). G) Mutations detected at the end of the fluctuation assay in capsule-free clones from the different conditions. Mutations accumulated in absence of pOXA-48, or under conditions of insAB expression from pIS1 are represented in the upper side of the panel (i.e. where pOXA-48-encoded IS1 elements were inactive/absent). Mutations accumulated in the presence of pOXA-48, or pOXA-48 + pIS1 without induction are represented in the lower part of the panel (i.e. where pOXA-48-encoded IS1 elements were active). Line color of IS1 insertions indicate the origin of the sequence (pOXA-48 or no pOXA-48). The name of the genes is indicated inside of their coding region. The function is shown for those capsule genes not named by PGAP: pe: polysaccharide export protein; pb: polysaccharide biosynthesis tyrosine autokinase; oli: O-antigen ligase; gly: glycosyltransferase.
Figure 5
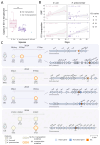
Figure 5. Within-patient evolution of pOXA-48-carrying enterobacteria
A) Number of genomic IS1 copies in the strains analyzed. Number of IS1 and IS1-like elements annotated in the genomes of each of the strains. We detected a significantly higher number of IS1 elements in the genomes of the E. coli strains analyzed. Crossed dots denote strains in which IS1 movements were detected. Asterisk denotes significant differences (Kruskal-Wallis test p < 0.05) between species (n = 10 E. coli strains and n = 19 K. pneumoniae strains) in IS copy number. Due to the low sample size of C. freundii isolates (n = 1 strain), we could not perform a comparison including this group. B) Within-patient mutation dynamics. Representation of the number of IS1 transposition events or SNPs/INDELs as a function of time (days) between isolations for the different E. coli and K. pneumoniae lineages under study. The R and p values shown correspond to two-sided Spearman correlation for each mutation type and species. The diameter of the points is proportional to the IS1 genomic copy number of the strains. The grey shadow represents the 95% confidence interval. C) Targets of pOXA-48-mediated IS1 transposition in the gut of hospitalized patients. Left side of the panel shows the timelines of the isolation of pOXA-48-carrying enterobacteria from patients IGJ, WXQ, JWC and YUE. Isolates features such as species, ST and IS1 transposition evidence in the lineages are detailed. Isolation dates are also indicated in the timeline. Right side of the panel shows the regions of the genome in which the IS1 element inserted in each of the lineages during in vivo evolution. The replicon in which we detected the insertion is indicated. In some of the lineages we could detect more than 1 transposition event (patients IGJ and JWC). Genes disrupted by IS1 elements are highlighted in darker blue. The names of the genes annotated by PGAP are shown on top.

Update of

References

    1. Wiedenbeck J, Cohan FM. Origins of bacterial diversity through horizontal genetic transfer and adaptation to new ecological niches. FEMS Microbiol Rev. 2011;35:957–976. - PubMed
    1. Ochman H, Lawrence JG, Groisman EA. Lateral gene transfer and the nature of bacterial innovation. Nature. 2000;405:299–304. - PubMed
    1. Harrison E, Brockhurst MA. Plasmid-mediated horizontal gene transfer is a coevolutionary process. Trends in Microbiology. 2012;20:262–267. - PubMed
    1. Botelho J, Schulenburg H. The Role of Integrative and Conjugative Elements in Antibiotic Resistance Evolution. Trends in Microbiology. 2021;29:8–18. - PubMed
    1. San Millan A. Evolution of Plasmid-Mediated Antibiotic Resistance in the Clinical Context. Trends in Microbiology. 2018;26:978–985. - PubMed

MeSH terms

Substances