. 2024 Oct;25(10):1830-1844.
doi: 10.1038/s41590-024-01918-6. Epub 2024 Aug 28.

Sodium chloride in the tumor microenvironment enhances T cell metabolic fitness and cytotoxicity

Affiliations

Sodium chloride in the tumor microenvironment enhances T cell metabolic fitness and cytotoxicity

Dominik Soll et al. Nat Immunol. 2024 Oct.

Abstract

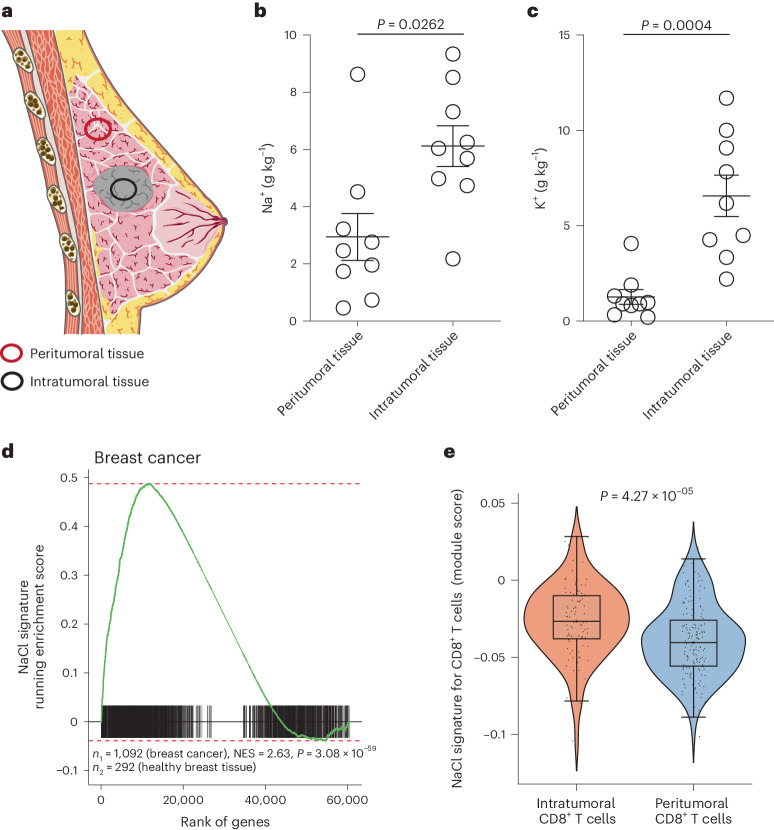
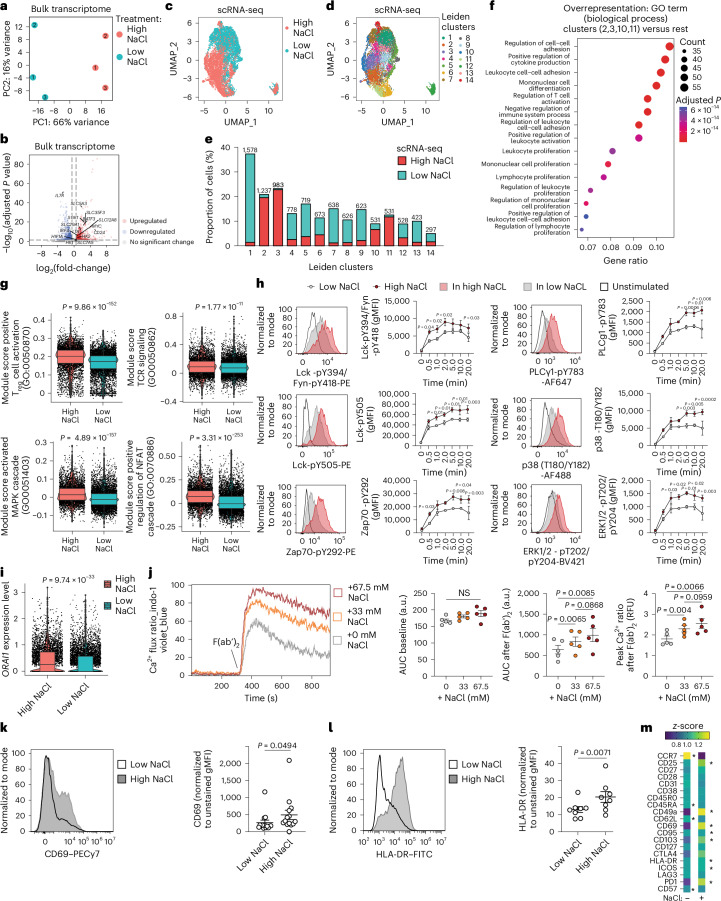
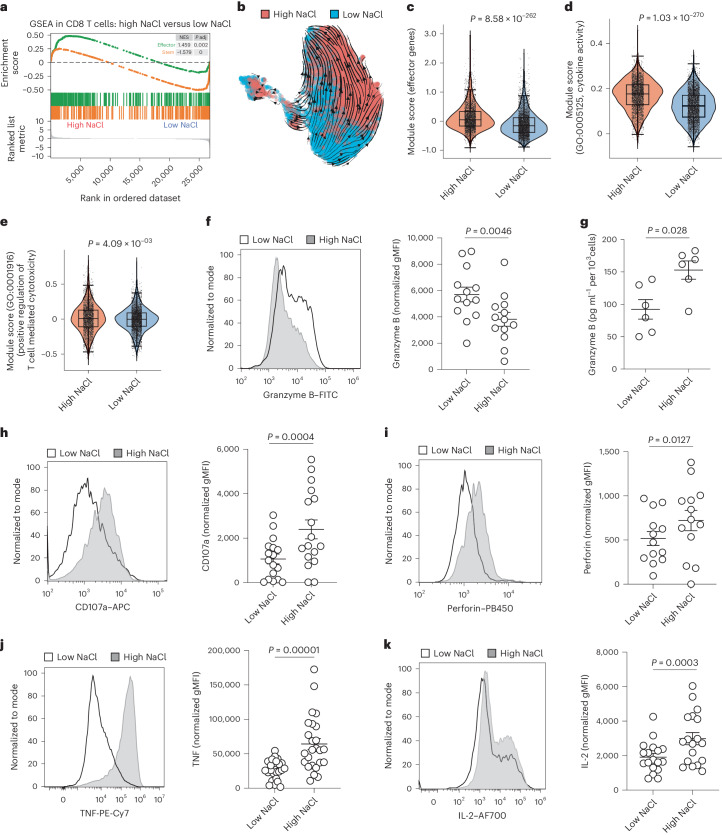
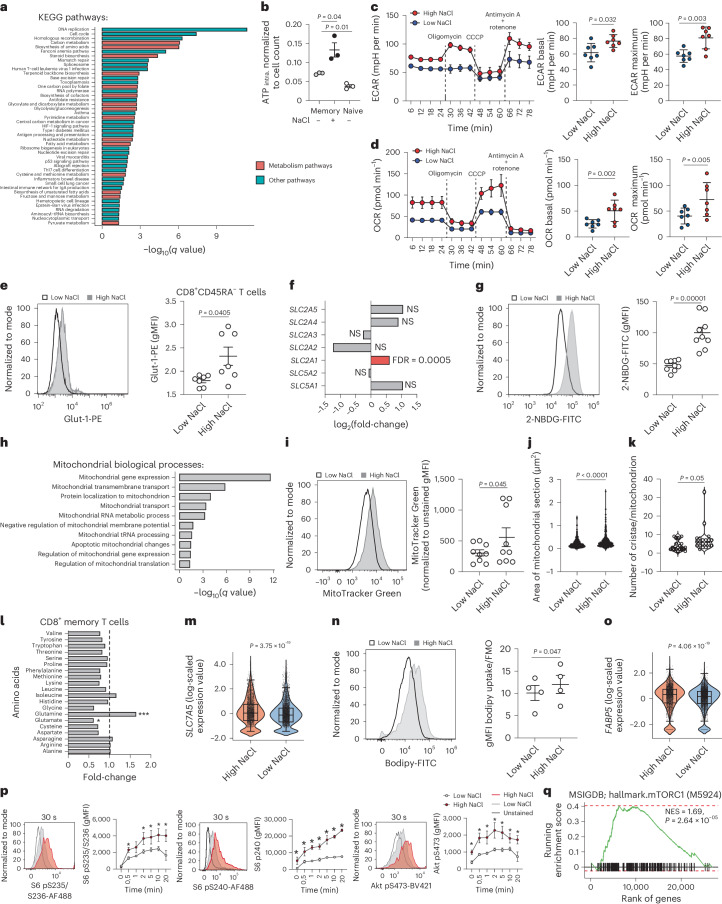
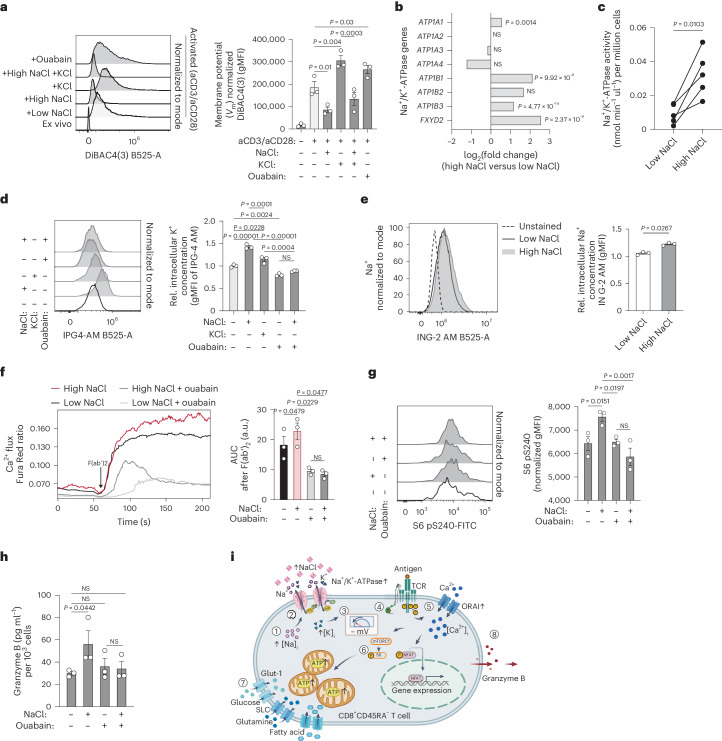
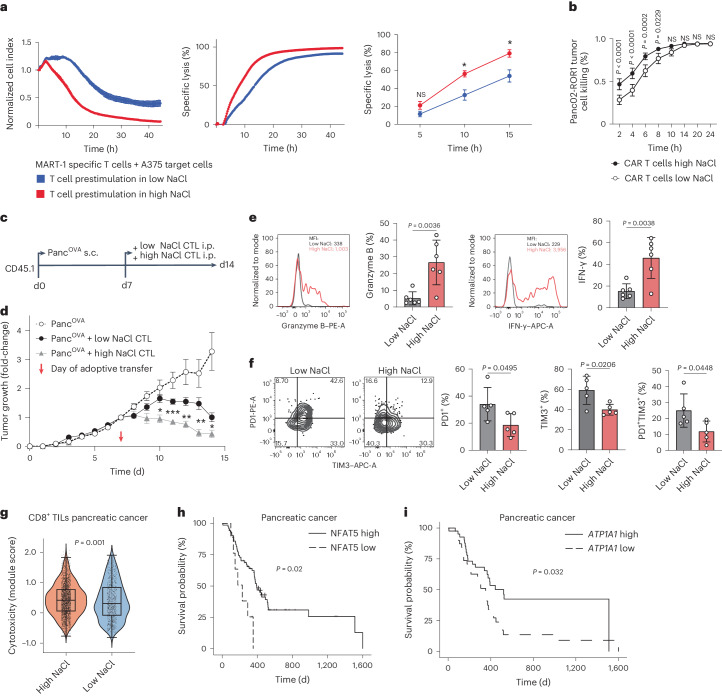
The efficacy of antitumor immunity is associated with the metabolic state of cytotoxic T cells, which is sensitive to the tumor microenvironment. Whether ionic signals affect adaptive antitumor immune responses is unclear. In the present study, we show that there is an enrichment of sodium in solid tumors from patients with breast cancer. Sodium chloride (NaCl) enhances the activation state and effector functions of human CD8+ T cells, which is associated with enhanced metabolic fitness. These NaCl-induced effects translate into increased tumor cell killing in vitro and in vivo. Mechanistically, NaCl-induced changes in CD8+ T cells are linked to sodium-induced upregulation of Na+/K+-ATPase activity, followed by membrane hyperpolarization, which magnifies the electromotive force for T cell receptor (TCR)-induced calcium influx and downstream TCR signaling. We therefore propose that NaCl is a positive regulator of acute antitumor immunity that might be modulated for ex vivo conditioning of therapeutic T cells, such as CAR T cells.


Conflict of interest statement

The authors declare no competing interests.

Figures

Fig. 1
Fig. 1. NaCl is highly enriched in solid tumors.
a, Schematic presentation of intratumoral and peritumoral tissue biopsies from patients with breast cancer. b,c, Quantification of Na+ (b) and K+ (c) concentrations with ICP–OES in intratumoral and peritumoral biopsies from patients with breast cancer (n = 9; mean ± s.e.m., two-tailed, paired Student’s t-test). d, Preranked GSEA of patients with breast cancer from TCGA. Running enrichment scores and sorted positions of the 1,956 significantly upregulated genes from the NaCl signature are shown. The NaCl signature was generated by transcriptomic comparison of CD8+ memory T cells cultured under high versus low NaCl conditions (top 60 significantly upregulated DEGs). P, significance of the enrichment (one-tailed test for positive enrichment); n1 and n2, number of patients providing either solid tumor samples or healthy breast tissue samples, respectively. e, ScRNA-seq of intra- and peritumoral CD8+ T cells from patients with breast cancer (n = 3) (GEO accession no. GSE114727). The module score for the transcriptomic NaCl signature obtained from DEGs on direct transcriptomic comparison of CD8+CD45RA T cells from high compared with low NaCl conditions, as described in d, was tested in intra- and peritumoral CD8+ T cells. CD8+ T cells were identified using marker gene expression.
Fig. 2
Fig. 2. NaCl enhances the activation state of human CD8+ memory T cells.
a, PCA projection after mRNA-seq of bulk human CD8+CD45RA T cells stimulated with CD3 and CD28 mAbs for 5 d under high and low NaCl conditions. The nos. 1–3 represent the individual blood donors. b, mRNA-seq analysis as in a. DEGs were identified using DESeq2 Wald’s test. c,d, ScRNA-seq of human CD8+CD45RA T cells stimulated with CD3 and CD28 mAbs for 3 d under high and low NaCl conditions.The UMAP shown is a representation visualizing the distribution of cells according to their respective treatment condition (c) and according to Leiden clustering (d). e, Proportion of CD8+CD45RA T cells from high and low NaCl conditions within the Leiden clusters after scRNA-seq as in c. Bray–Curtis dissimilarity testing was between high NaCl clusters (2, 3, 10, 11) and low NaCl clusters (1, 4–9, 12–14) (P = 1.5 × 10−17, Wilcoxon’s rank-sum test). f, GSEA showing the top 15 GO terms among all biological processes. g, Module scores for the indicated gene sets comparing CD8+CD45RA T cells from high and low NaCl conditions after scRNA-seq (Wilcoxon’s rank-sum test). h, Phospho-low cytometry of CD8+CD45RA T cells stimulated as in a after TCR crosslinking with anti-CD3 mAbs and anti-mouse IgG F(ab′)2 (n = 3; mean ± s.e.m., two-way ANOVA with Fisher’s least significant difference (LSD)). gMFI, geometric mean fluorescence intensity. i, ScRNA-seq analysis of CD8+CD45RA T cells stimulated as in a (Wilcoxon’s rank-sum test). j, Ca2+ flux measurement after expansion of human CD8+CD45RA T cells with CD3 and CD28 mAbs for 5 d in low and high NaCl conditions by flow cytometry. A representative plot shows the Ca2+ flux ratio in different NaCl conditions after anti-CD3 crosslinking F(ab′)2. Dot plots show the area under the curve (AUC) during baseline, after F(ab′)2 and the peak value of Ca2+ flux ratio after F(ab′)2. Data present the mean ± s.e.m. from individual donors (n = 5, one-way ANOVA with Tukey’s multiple-comparison test). a.u., arbitrary units; RFU, relative fluorescence units. k,l, Spectral flow cytometric analysis of CD8+CD45RA T cells stimulated as in a (n = 14 (k), n = 8 (l), mean ± s.e.m., two-tailed, paired Student’s t-test). m, Spectral flow cytometry. The differences in the percentages of cells positive for the shown markers were visualized by z-score (n = 4; *P < 0.05. two-tailed, paired Student’s t-test). The asterisk is located on the treatment side (high or low NaCl) that shows significant upregulation.
Fig. 3
Fig. 3. NaCl enhances CD8+ T cell effector function and cytotoxicity.
a, GSEA for effector- and stemness-associated genes was performed after a transcriptomic comparison of bulk human CD8+CD45RA T cells stimulated with CD3 and CD28 mAbs for 5 d under high and low NaCl conditions. b, RNA velocity analysis after scRNA-seq of human CD8+CD45RA T cells stimulated with CD3 and CD28 mAbs for 3 d under high and low NaCl conditions. The velocities are shown in UMAP embedding. Cells are color coded according to the treatment condition as indicated. ce, ScRNA-seq and analysis of the module scores of the indicated gene sets (c, effector genes; d, cytokine activity; e, positive regulation of T cell mediated cytotoxicity) for human CD8+CD45RA T cells stimulated with CD3 and CD28 mAbs for 3 d under high and low NaCl conditions (n = 1; Wilcoxon’s rank-sum test). f, Intracellular cytokine staining and flow cytometric analysis of human CD8+CD45RA memory T cells after stimulation for 5 d with CD3 and CD28 mAbs under high and low NaCl conditions. Left, representative experiment; right, cumulative data (n = 13; mean ± s.e.m., two-tailed, paired Student’s t-test). g, ELISA of cell culture supernatants from human CD8+ memory T cells stimulated for 5 d with CD3 and CD28 mAbs (n = 6; mean ± s.e.m., two-tailed, paired Student’s t-test). h, Flow cytometric analysis of human CD8+CD45RA T cells performed after stimulation for 5 d with CD3 and CD28 mAbs under high and low NaCl conditions. Left, representative experiment; right, cumulative data. Data present the mean ± s.e.m. (n = 17; two-tailed, paired Student’s t-test). ik, Intracellular cytokine staining and flow cytometric analysis (i, perforin; j, TNF; k, IL-2) of human CD8+CD45RA T cells after stimulation for 5 d with CD3 and CD28 mAbs under high and low NaCl conditions and restimulation with PMA/ionomycin for 5 h. Left, representative experiment; right, cumulative data. Data present the mean ± s.e.m. (n = 25 (j), n = 18 (k); two-tailed, paired Student’s t-test).
Fig. 4
Fig. 4. NaCl potentiates the metabolic fitness of CD8+ T cells.
a, Enrichment by overrepresentation analysis for all 45 upregulated KEGG pathways (with Benjamini–Hochberg-adjusted q value ≤ 0.05) using significantly upregulated DEGs (P ≤ 0.05, log2(fold-change) ≥ 0.5) from the bulk transcriptomic comparison of human CD8+CD45RA T cells stimulated for 5 d with CD3 and CD28 mAbs under high and low NaCl conditions. b, Luminometric assessment of ATP production in human CD8+CD45RA+ and CD8+CD45RA cells, which were stimulated as described in a, normalized to ATP per cell (n = 3; mean ± s.e.m., two-tailed, paired Student’s t-test). c,d, Real-time analysis of the ECAR (c) and OCR (d) by human CD8+CD45RA T cells using a Seahorse Extracellular Flux Analyzer. The dotted lines show the time point of addition of the indicated substances. Left, representative experiment with technical replicates; right, cumulative quantification with individual healthy donors (n = 7; mean ± s.e.m. two-tailed, paired Student’s t-test). e,g,i,n, Flow cytometric analysis of human CD8+CD45RA T cells. Left, representative experiment; right, cumulative quantification (n = 7 (e), n = 9 (g), n = 9 (i), n = 4 (n); mean ± s.e.m., two-tailed, paired Student’s t-test). f, Expression of the indicated genes encoding glucose transporters in a transcriptomic comparison of bulk human CD8+CD45RA T cells stimulated for 5 d with CD3 and CD28 mAbs under high and low NaCl conditions (n = 3). h, Significantly enriched terms of GO-annotated, mitochondrial biological processes after overrepresentation analysis of upregulated genes from the bulk transcriptomic comparison of human CD8+CD45RA T cells stimulated as in a. The q values show P-value adjustment for multiple-test correction. Term redundancy was reduced using REVIGO (http://revigo.irb.hr, similarity parameter = 0.5). j,k, Transmission electron microscopy, number of mitochondria (j, n = 632 for low NaCl, 373 for high NaCl conditions) and cristae per mitochondrion (k, n = 18 for low NaCl, 21 for high NaCl) (two-tailed, unpaired Student’s t-test). The data represent two independent experiments. l, Nontargeted metabolic profiling (metabolome analysis) of CD8+CD45RA T cells stimulated as in a (n = 4 individual blood donors (matched samples); one-way ANOVA). m,o, ScRNA-seq analysis of cells cultured as in a (m, SLC7A5; o, FABP5) one biological replicate (Wilcoxon’s rank-sum test). p, Phospho-flow analysis of CD8+CD45RA T cells cells stimulated as in a after TCR crosslinking for the indicated time points (n = 3; mean ± s.e.m., two-way ANOVA with uncorrected Fisher’s LSD; *P < 0.05). q, Preranked GSEA. One-tailed permutation test for positive enrichment is based on an adaptive multilevel split Monte Carlo scheme (R package FGSEA).
Fig. 5
Fig. 5. NaCl enhances membrane hyperpolarization through Na+/K+-ATPase.
a, Flow cytometric analysis of the membrane potential of human CD8+CD45RA T cells after stimulation for 5 d with CD3 and CD28 mAbs under high and low NaCl conditions in the presence or absence of ouabain treatment for 1 h before analysis (n = 3; mean ± s.e.m., one-way ANOVA with Fisher’s LSD test). b, ATPase gene expression. Bulk mRNA-seq analysis of CD8+CD45RA T cells stimulated under high and low NaCl conditions with CD3 and CD28 mAbs for 5 d. Multiple test-adjusted P value and log2(fold-changes) according to DESeq2 test statistics are given over all transcriptome data (n = 3). c, Colorimetric analysis of the Na+/K+-ATPase activity of CD8+CD45RA T cells treated under high and low NaCl conditions as in b in the presence or absence of ouabain (n = 5; two-tailed, paired Student’s t-test). d,e, Flow cytometric analysis of intracellular K+ (d) and Na+ (e) for cells treated as in a. rel, relative. f, Calcium flux analysis with flow cytometry as in Fig. 2j before and after TCR crosslinking of CD8+CD45RA T cells stimulated as in a (one-way ANOVA). g, Phospho-flow cytometry of CD8+CD45RA T cells stimulated as in a (one-way ANOVA). h, ELISA of 1-h cell culture supernatants on day 5 of CD8+CD45RA T cells stimulated as in a (n = 3; mean ± s.e.m., one-way ANOVA with Fisher’s LSD test). i, Overview of molecular mechanism of NaCl-induced T cell hyperactivation.
Fig. 6
Fig. 6. NaCl licenses CD8+ T cells for killing of tumor cells in vitro and in vivo.
a, Real-time killing assay with nucleofected MART-1-specific T cells and A375 melanoma cell target cells at a 1:1 ratio under high and low NaCl conditions using the xCELLigence technology. Left, the normalized cell index; middle, the specific lysis; right, the cumulative quantification of 3T cell donors (n = 3 experiments; mean ± s.e.m.; two-way ANOVA, *P < 0.05). b, Murine ROR1 CAR T cells generated and cultured for 48 h under high and low NaCl conditions and then cocultured with ROR1-expressing target cells at a 10:1 ratio. Antigen-specific lysis of Panc02-ROR1 cells by CD8+ CAR T cells was determined at different time points (n = 3 independent experiments; mean ± s.d., two-way ANOVA). c, Experimental design. d, The tumor growth curves of subcutaneous tumors. Tumor growth was normalized to the tumor size on the day of CD8+ T cell injection (n = 7 (PancOVA), n = 6 (PancOVA + low NaCl control (CTL)), n = 6 (PancOVA + high NaCl CTL); mean ± s.e.m. two-way ANOVA with Tukey’s honestly significant difference (HSD), multiple-comparison test). e,f, Flow cytometric analysis of intratumoral CD45.2+CD8+ T cells 72 h after T cell transfer (n = 6 (e), n = 5 (f); mean ± s.d., two-tailed, unpaired Student’s t-test). g, ScRNA-seq and module score calculation for T cell cytotoxicity genes obtained from published reports,, validated with genes from GO:0001916 (P = 0.01). Intratumoral CD8+ T cells are shown from 56 patients with pancreatic cancer (from accession nos. GSE155698, GSE111672, GSE154778, GSM4293555 and PRJCA001063), integration of all cells: 10.5281/zenodo.6024273. CD8+ T cells were categorized into cells with a high and low NaCl signature based on the NaCl signature obtained from scRNA-seq of CD8+CD45RA T cells treated under high versus low NaCl concentrations (top 60 upregulated DEGs; Supplementary Table 2; cutoff defined as module score ≥0 and <0 for high versus low NaCl signature, respectively; Wilcoxon’s rank-sum test). h,i, Kaplan–Meier tumor-free survival probability of patients from TCGA database diagnosed with pancreatic cancer. Patients were subgrouped by computing an optimal cutoff for NFAT5 (h) and ATP1A1 (i) expression. TPM values were normalized toward overall survival outcome. Number of patient samples: pancreatic cancer: n = 72 for NFAT5 high, n = 9 for NFAT5 low; n = 41 for ATP1A1 high; n = 40 for ATP2A2 low; significance of survival differences was determined using the Peto–Peto algorithm with the surv_pvalue function (method = ‘S1’) as implemented in the R package survminer.

References

    1. DePeaux, K. & Delgoffe, G. M. Metabolic barriers to cancer immunotherapy. Nat. Rev. Immunol.21, 785–797 (2021). - PMC - PubMed
    1. Eil, R. et al. Ionic immune suppression within the tumour microenvironment limits T cell effector function. Nature537, 539–543 (2016). - PMC - PubMed
    1. Vodnala, S. K. et al. T cell stemness and dysfunction in tumors are triggered by a common mechanism. Science363, eaau0135 (2019). - PMC - PubMed
    1. Matthias, J. et al. Salt generates antiinflammatory Th17 cells but amplifies pathogenicity in proinflammatory cytokine microenvironments. J. Clin. Invest.130, 4587–4600 (2020). - PMC - PubMed
    1. Wu, C. et al. Induction of pathogenic TH17 cells by inducible salt-sensing kinase SGK1. Nature496, 513–517 (2013). - PMC - PubMed

MeSH terms

Substances