. 2024 Sep;25(9):1650-1662.
doi: 10.1038/s41590-024-01928-4. Epub 2024 Aug 28.

Attenuated effector T cells are linked to control of chronic HBV infection

Affiliations

Attenuated effector T cells are linked to control of chronic HBV infection

Kathrin Heim et al. Nat Immunol. 2024 Sep.

Abstract

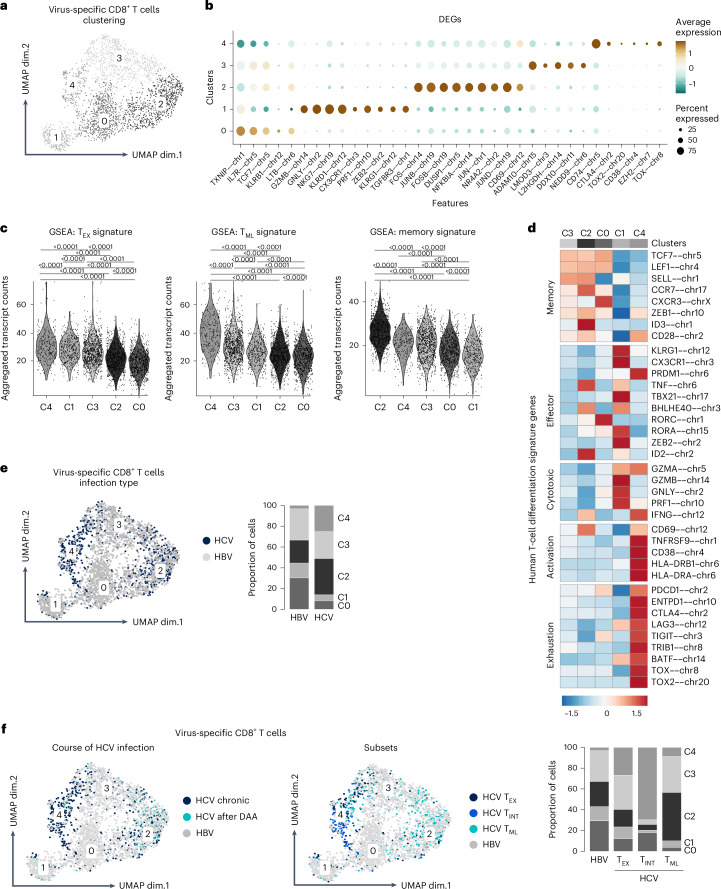
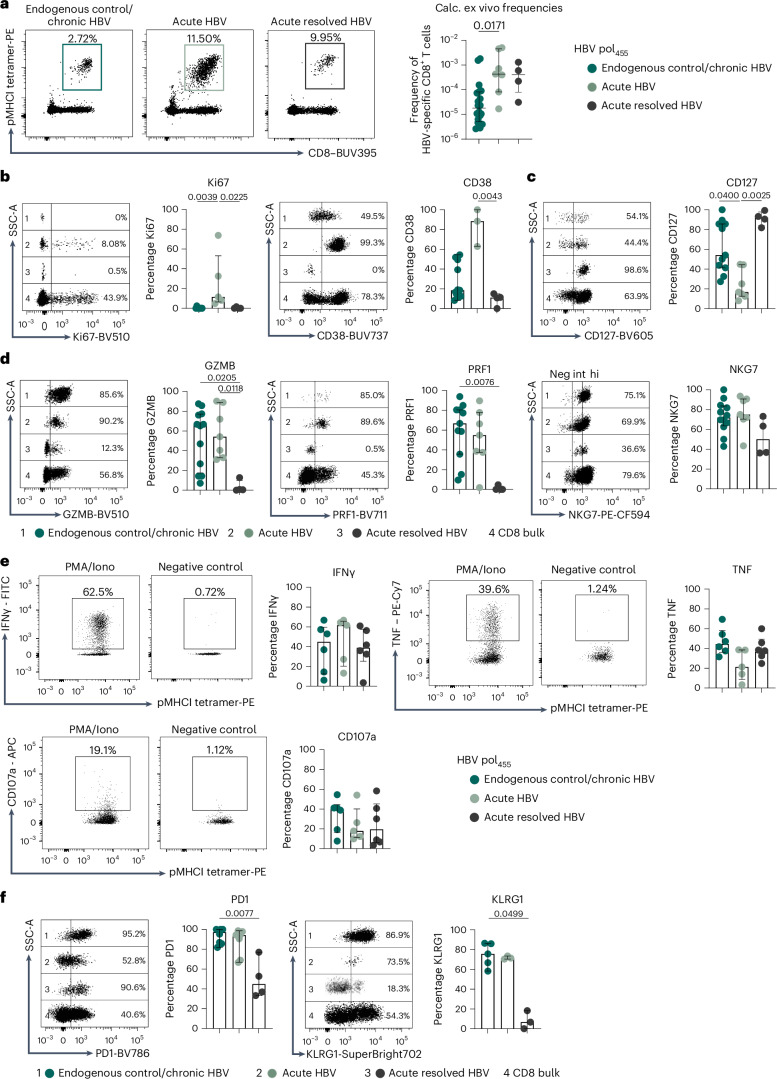
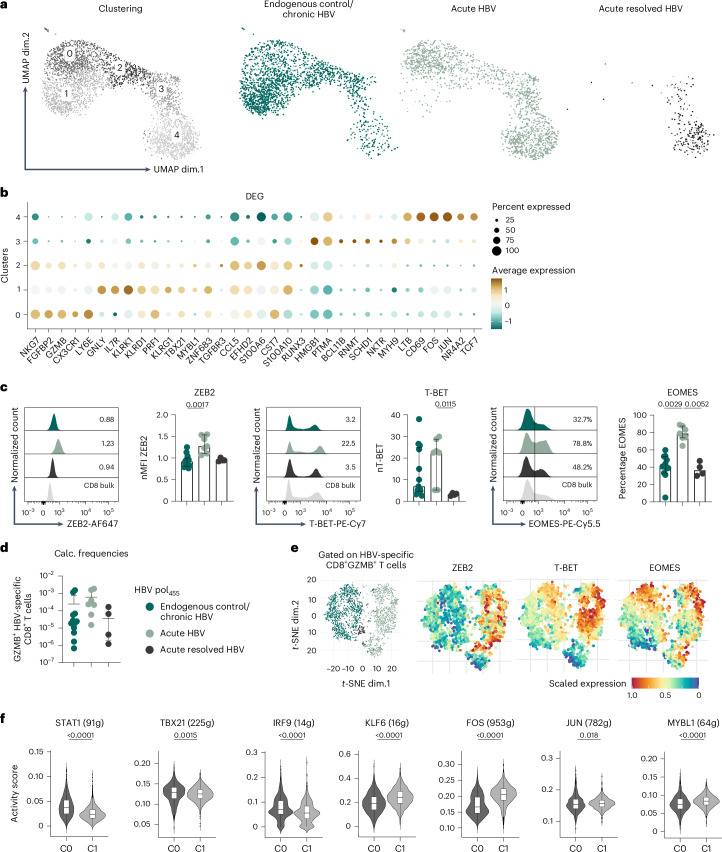
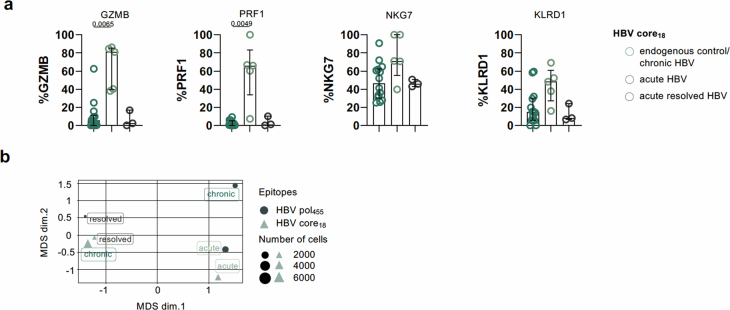
Hepatitis B virus (HBV)-specific CD8+ T cells play a dominant role during acute-resolving HBV infection but are functionally impaired during chronic HBV infection in humans. These functional deficits have been linked with metabolic and phenotypic heterogeneity, but it has remained unclear to what extent different subsets of HBV-specific CD8+ T cells still suppress viral replication. We addressed this issue by deep profiling, functional testing and perturbation of HBV-specific CD8+ T cells during different phases of chronic HBV infection. Our data revealed a mechanism of effector CD8+ T cell attenuation that emerges alongside classical CD8+ T cell exhaustion. Attenuated HBV-specific CD8+ T cells were characterized by cytotoxic properties and a dampened effector differentiation program, determined by antigen recognition and TGFβ signaling, and were associated with viral control during chronic HBV infection. These observations identify a distinct subset of CD8+ T cells linked with immune efficacy in the context of a chronic human viral infection with immunotherapeutic potential.


Conflict of interest statement

The authors declare no competing interests.

Figures

Fig. 1
Fig. 1. Subset diversification of virus-specific CD8+ T cells in chronic viral hepatitis.
a, Cluster analysis via Seurat and Harmony algorithm applied to single-cell transcriptomes of HBV- (n = 14) and HCV-specific CD8+ T cells (n = 8). Each dot corresponds to one individual cell. Five clusters (C0–C4) were identified and color coded. b, Bubble plot of DEGs among the five clusters is displayed. Scaled expression is depicted. c, GSEA of terminally exhausted, memory-like and classical memory murine T cell signatures (from ref. ) comparing C0–C4. Violin plots depict the aggregated transcript counts. Statistical significance was assessed by a Kruskal–Wallis test, including Dunn’s multiple comparisons test. d, Heatmap showing human T cell differentiation signature gene expression (memory, effector, cytotoxic, activation and exhaustion) in C0–C4. Scaled expression levels are color coded (blue, low; red, high). e, C0–4 are color coded according to infection type (dark blue, HCV; gray, HBV) and the proportion of each cluster was assessed for HBV- and HCV-specific CD8+ T cells, respectively. f, HCV-specific CD8+ T cells were highlighted with respect to the course of HCV infection (dark blue, HCV chronic; light blue, HCV after DAA; gray, HBV) or with respect to distinct T cell subsets (dark blue, HCV TEX cells; dark blue/gray, HCV TINT; light blue, HCV TML; gray, HBV) and the proportions were assessed for each cluster. TML, memory-like T cells; TINT, intermediate exhausted T cells. Source data
Fig. 2
Fig. 2. Distinct subsets of HBV core18- and HBV pol455-specific CD8+ T cells.
a, Cluster analysis via Seurat and Harmony algorithm applied to single-cell transcriptomes of HBV core18-specific (n = 7) versus HBV pol455-specific (n = 7) CD8+ T cells of individuals who were chronically HBV-infected (HBeAg−, low VL). Each dot corresponds to one cell. Four clusters (C0–3) were identified and color coded. b, Bubble plot showing DEGs in C0–C3. Scaled expression is depicted. c, C0–3 are color coded according to targeted viral proteins (light gray/green, HBV core18; dark green/gray, HBV pol455). Proportions of C0–C3 among HBV-specific CD8+ T cells are illustrated. d, GSEA of cytotoxicity (from ref. ) and cytokine production (GO:0002369) signatures are depicted. The aggregated transcript counts of C0–3 are mapped. Statistical significance was assessed by a Kruskal–Wallis test, including Dunn’s multiple comparisons test. e, t-SNE representation of concatenated flow cytometry data comparing HBV core18- versus HBV pol455-specific CD8+ T cells is illustrated (HBV core18, n = 25; HBV pol455, n = 26). Expression levels (blue, low; red, high) of the indicated markers are plotted. Source data
Fig. 3
Fig. 3. Cytotoxic HBV pol455-specific CD8+ T cells are associated with endogenous control in chronic HBV infection.
a, Cluster analysis via Seurat and Harmony algorithm applied to single-cell transcriptomes of HBV pol455-specific CD8+ T cells obtained from chronic HBV-infected individuals with endogenous control/chronic HBV (n = 3) versus NUC control/chronic HBV (n = 4). Each dot corresponds to one individual cell. Three clusters (C0–2) were identified and color coded. Feature plots showing gene expression of cytotoxic genes among the three clusters and scaled expression (gray, low; red, high) are depicted. b, C0–2 are color coded according to the clinical phase of chronic HBV infection (dark green, endogenous control; light green, NUC control) and proportions of C0–2 of HBV pol455-specific CD8+ T cells were assessed. c, Flow cytometric analysis of the cytotoxic molecules GZMB and PRF1, the cytolytic regulator NKG7 as well as the C-type lectin-like natural killer cell receptors KLRD1 and KLRG1 in HBV pol455/173-specific CD8+ T cells from chronic HBV-infected individuals (for GZMB, PRF1, NKG7, KLRD1: endogenous control/chronic HBV (low VL, HBV pol455: n = 12, HBV pol173: n = 7), chronic HBV/high VL (HBV pol455: n = 4), NUC control/chronic HBV (low VL, HBV pol455: n = 14, HBV pol173: n = 7; for KLRG1: endogenous control/chronic HBV (low VL, HBV pol455: n = 5, HBV pol173: n = 3), chronic HBV/high VL (HBV pol455: n = 4) NUC control/chronic HBV (low VL, HBV pol455: n = 9, HBV pol173: n = 3)). Histograms and statistical graph depicting gating and frequencies of HBV pol455/173-specific CD8+ T cells are displayed. Each dot represents one HBV pol455/173-specific CD8+ T cell and is color coded as indicated: dark green, endogenous control/chronic HBV; dark gray green, chronic HBV/high VL; light green, NUC control/chronic HBV. Bar charts show the median value with interquartile range (IQR). d, Diffusion map showing flow cytometry data of HBV pol455-specific CD8+ T cells according to the clinical phase of chronic HBV infection is depicted (endogenous control/chronic HBV, n = 12; chronic HBV/high VL, n = 4; NUC control/chronic HBV, n = 14). e, Diffusion pseudotime (DPT) trajectory of the single-cell transcriptomes of HBV pol455-specific CD8+ T cells is shown. Each dot represents one cell and these are color coded according to clinical phase of chronic HBV infection endogenous control/chronic HBV (n = 3) versus NUC control/chronic HBV (n = 4). f, Binary regulon activity of HBV pol455-specific CD8+ T cells is plotted on diffusion map based on SCENIC analysis. Cells are colored in red when the indicated regulon is active. Statistical significance was assessed by a Kruskal–Wallis test, including Dunn’s multiple comparisons test (c). Source data
Fig. 4
Fig. 4. Attenuated cytotoxic HBV pol455-specific CD8+ T cell response.
a, Dot plots show circulating peptide/HLA-A*02:01 tetramer-enriched HBV pol455-specific CD8+ T cells in endogenous control/chronic HBV (left, n = 20), acute HBV (middle, n = 7) and acute resolved HBV (right, n = 4) infection. The frequency of HBV pol455-specific CD8+ T cells within the total CD8+ T cell population is indicated. Calculated ex vivo frequencies are depicted. bd, Flow cytometric analysis of the activation status (Ki67: endogenous control/chronic HBV, n = 7; acute HBV, n = 5; acute resolved HBV, n = 4; CD38: endogenous control/chronic HBV, n = 5; acute HBV, n = 3; acute resolved HBV, n = 4) (b), the memory-associated marker CD127 (endogenous control/chronic HBV, n = 11; acute HBV, n = 7; acute resolved HBV, n = 4) (c) and the cytotoxic molecules GZMB and PRF1 as well as the cytolytic regulator NKG7 (endogenous control/chronic HBV, n = 12; acute HBV, n = 7; acute resolved HBV, n = 4) (d) in HBV pol455-specific CD8+ T cells is shown. Dot plots and statistical graph depicting gating and frequencies of HBV pol455-specific CD8+ T cells are displayed. e, Dot plots showing IFNγ-, TNF- and CD107a-producing HBV pol455-specific CD8+ T cells (after peptide/HLA-A*02:01 tetramer-enrichment) in response to PMA/Iono stimulation (left, PMA/Iono stimulation; right, negative control). The percentages of IFNγ-, TNF- and CD107a-producing HBV pol455-specific CD8+ T cells were determined (endogenous control/chronic HBV, n = 6; acute HBV, n = 5; acute resolved HBV, n = 6). f, Expression levels of PD1 (endogenous control/chronic HBV, n = 8; acute HBV, n = 7; acute resolved HBV, n = 4) and KLRG1 (endogenous control/chronic HBV, n = 5; acute HBV, n = 3; acute resolved HBV, n = 3) were examined in HBV pol455-specific CD8+ T cells. Dot plots and statistical graph depicting gating and frequencies of HBV pol455-specific CD8+ T cells are displayed. Each dot represents one HBV pol455-specific CD8 + T cell and is color coded as indicated: dark green, endogenous control/chronic HBV; light green, acute HBV; dark gray, acute resolved HBV. Bar charts show the median value with IQR. Statistical analyses were performed by a Kruskal–Wallis test, including Dunn’s multiple comparisons test (af). Source data
Fig. 5
Fig. 5. Unique transcriptional regulation of attenuated HBV pol455-specific CD8+ T cells.
a, Cluster analysis via Seurat and Harmony algorithm applied to single-cell transcriptomes of HBV pol455-specific CD8+ T cells obtained from endogenous control/chronic HBV (n = 3), acute HBV (n = 3) and acute resolved HBV (n = 2) infection using 10x Genomics platform. Each dot corresponds to one individual cell. Five clusters (C0–4) were identified and color coded according to disease phases. b, Bubble plot of DEGs among C0–4 is displayed. Scaled expression is depicted. c, Flow cytometric analysis of transcription factors linked to effector cell differentiation (ZEB2, T-BET, EOMES) was performed in HBV pol455-specific CD8+ T cells (endogenous control/chronic HBV, n = 13; acute HBV, n = 7; acute resolved HBV, n = 4). Histograms and statistical graph depicting gating and frequencies of HBV pol455-specific CD8+ T cells are displayed. d, The calculated frequencies of GZMB+ HBV pol455-specific CD8+ T cells within the total CD8+ T cell population are depicted (endogenous control/chronic HBV, n = 12; acute HBV, n = 7; acute resolved HBV, n = 4). e, t-SNE representation of concatenated flow cytometry data gated on GZMB+ HBV pol455-specific CD8+ T cells is illustrated. Scaled expression (blue, low; red, high) is depicted. f, Binary regulon activity based on SCENIC analysis is depicted in violin plots (box center line, median; box limits, upper and lower quartiles; box whiskers, interquartile range (IQR)) comparing C0 and C1 (endogenous control/chronic HBV, n = 3; acute HBV, n = 3; acute resolved HBV, n = 2). Each dot represents one HBV pol455-specific CD8+ T cell and is color coded as indicated: dark green, endogenous control/chronic HBV; light green, acute HBV; dark gray, acute resolved HBV. Bar charts show the median value with IQR. Statistical significance was assessed by a Kruskal–Wallis test, including Dunn’s multiple comparisons test (c,d) and two-tailed Mann–Whitney test (f). Source data
Fig. 6
Fig. 6. TGFβ signaling is linked to HBV-specific CD8+ T cell attenuation.
a, Bubble plot showing TGFβ receptor gene expression in HBV pol455-specific CD8+ T cells of endogenous control/chronic HBV (n = 3), acute HBV (n = 3) and acute resolved HBV infection (n = 2). Scaled expression levels are color coded (blue, low; brown, high). b, KEGG analysis of the TGFβ signaling pathway in HBV pol455-specific CD8 + T cells of endogenous control/chronic HBV, acute HBV and acute resolved HBV infection. The aggregated transcript counts are mapped in violin plots. c, Experimental workflow of peptide-specific in vitro expansion of CD8+ T cells is illustrated. TGFβ signaling was blocked by adding TGF-β RI kinase inhibitor II CAS 446859-33-2 into the cell culture. d, Dot plots showing ZEB2, EOMES and GZMB expression of HBV pol455-specific CD8+ T cells after 14 days of in vitro culture with (left) and without TGF-β RI kinase inhibitor II (right) (endogenous control/chronic HBV, n = 6). Statistical graph depicting frequencies of ZEB2+, T-BET+, EOMES+ or GZMB+ HBV pol455-specific CD8+ T cells are displayed. e, Experimental workflow of peptide-specific in vitro expansion of CD8+ T cells treated with IL-12 or IFNα is illustrated. f,g, ZEB2, T-BET, EOMES and GZMB expression of HBV pol455-specific CD8+ T cells after 14 days of in vitro culture with IL-12 (endogenous control/chronic HBV, n = 7) (f) or IFNα treatment (g) (endogenous control/chronic HBV, n = 8) or without any treatment is shown. h, t-SNE (left) and MDS (right) representations of concatenated flow cytometry data gated on HBV pol455-specific CD8+ T cells of acute HBV (n = 7) and endogenous control/chronic HBV infection (ex vivo, n = 13) or the later one after IL-2 treatment (n = 10), after blocking of TGFβ signaling (n = 6) or treatment with IL-12 (n = 7) or IFNα (n = 8), is illustrated. Each dot represents one of the respective HBV pol455-specific CD8+ T cell responses with color coding as indicated: dark green, endogenous control/chronic HBV; light green, acute HBV. Statistical analyses were performed via Kruskal–Wallis test, including Dunn’s multiple comparisons test (b) and two-tailed Wilcoxon matched-pairs signed-rank test (d,f,g). Source data
Extended Data Fig. 1
Extended Data Fig. 1. Experimental setup of scRNAseq analysis using mCEL-seq2.
(a) Study design is illustrated. Comprehensive analysis of the single-cell transcriptomes of HCV-specific CD8 + T cells from individuals infected with chronic HCV (n = 6) and after DAA-mediated cure of chronic HCV infection (n = 2) versus HBV-specific CD8 T cells from chronic HBV-infected individuals (n = 14) were performed by using the mCEL-seq2 technology. (b) Gating strategy of flow cytometry-based cell sorting of HBV-specific CD8 + T cells for scRNA-seq: after lymphocyte gating and two-way doublet exclusion, live CD8+ T cells were gated. Naïve CD8+ T cells (CD45RA + CCR7 + ) were excluded and HLA-A*02:01-restricted HBV-specific CD8+ T cells were identified by peptide-loaded HLA class I tetramer and then sorted into 384-well plates. (c) Feature plots showing gene expression of STAT5, KLRC1 and KLRB1 genes in C0–4. Scaled expression is depicted (gray, low; red, high). (d) Heatmap showing the expression of cytokines, cytotoxic markers and activation-related genes within the virus-specific CD8 + T cell clusters. Scaled expression levels are color coded (blue, low; brown, high). Source data
Extended Data Fig. 2
Extended Data Fig. 2. Phenotypic and transcriptional characteristics of HBV-specific CD8+ T cells.
(a) Feature plots showing TCF7 and IL7R gene expression in C0–2 of HBV pol455-specific CD8+ T cells (endogenous control/chronic HBV n = 3, NUC control/chronic HBV n = 4). Scaled expression is depicted (gray, low; red, high). (b) Expression analysis of cytotoxic molecules (GZMB and PRF1), the cytolytic regulator NKG7 as well as the C-type lectin-like NK cell receptors KLRD1 and KLRG1 was performed in peptide-loaded/HLA class I tetramer-enriched HBV core18-specific CD8+ T cells from chronic HBV-infected individuals (for GZMB, PRF1, NKG7, KLRD1: endogenous control/ chronic HBV, low viral load, dark green, n = 14; high viral load, dark green/black, n = 2; NUC control/chronic HBV, low viral load, light green, n = 11; for KLRG1: endogenous control/ chronic HBV, low viral load, dark green, n = 8; high viral load, dark green/black, n = 2; NUC control/chronic HBV, low viral load, light green, n = 12). Representative histograms including gating of the individual markers are displayed. Each dot represents one HBV core18-specific CD8+ T cell response and with color coding as indicated. Bar charts show the median value with IQR. (c) Expression levels of indicated markers are plotted on the diffusion map (blue, low; red, high) (endogenous control/ chronic HBV, low viral load, dark green, n = 12; high viral load, dark green/black, n = 4; NUC control/chronic HBV, low viral load, light green, n = 14). (d) Regulon activity matrix obtained from single-cell transcriptomes of HBV pol455-specific CD8+ T cells of chronically HBV-infected individuals (endogenous control/chronic HBV n = 3, NUC control/chronic HBV n = 4) after applying SCENIC algorithm. Statistical significance was assessed by a Kruskal–Wallis test including Dunn’s multiple comparisons test (b). Source data
Extended Data Fig. 3
Extended Data Fig. 3. Cytotoxic characteristics of HBV core18-versus HBV pol455-specific CD8+ T cells.
(a) Flow cytometric analysis of the cytotoxic molecules GZMB and PRF1, the cytolytic regulator NKG7 as well as the C-type lectin-like NK cell receptor KLRD1 in HBV core18-specific CD8+ T cells from these cohorts is shown. Statistical graph depicts frequencies of HBV core18-specific CD8+ T cells. Each dot represents one of the respective HBV core18-specific CD8+ T cell responses with color coding as indicated: dark green, endogenous control/chronic HBV, n = 14; light green, acute HBV, n = 5; dark gray, acute resolved HBV, n = 3. (b) MDS representation of concatenated flow cytometry data gated on HBV core18-specific and HBV pol455-specific CD8+ T cells of acute (n = 12; HBV core18: n = 5, HBV pol455: n = 7), acute resolved (n = 7; HBV core18: n = 3, HBV pol455: n = 4) and endogenous control/chronic HBV infection (n = 26; HBV core18: n = 14, HBV pol455: n = 12) is illustrated. Bar charts show the median value with IQR. Statistical significance was assessed by a Kruskal–Wallis test including Dunn’s multiple comparisons test (a). Source data
Extended Data Fig. 4
Extended Data Fig. 4. Distinct cytotoxic HBV pol455-specific CD8+ T cell responses in endogenously controlled versus acute HBV infection.
(a) Comparison of mCEL-seq2 (endogenous control/chronic HBV, n = 3; NUC control/chronic HBV, n = 4) and 10x Genomics scRNA-seq data (endogenous control/chronic HBV, n = 3; acute HBV, n = 3; acute resolved HBV, n = 2) are illustrated. nFeature RNA, nCount RNA and the clustering are depicted. (b) Comparison of C0–4 identified with 10x scRNA-seq with cluster signatures defined in the mCEL-seq2 approach by GSEA. (c) The transcription factors RUNX3 and BLIMP1 were assessed in HBV pol455-specific CD8+ T cells of different cohorts (endogenous control/chronic HBV, n = 7; acute HBV, n = 5; acute resolved HBV, n = 4). Histograms and statistical graph depicting gating and frequencies of HBV pol455-specific CD8+ T cells are displayed. (d) Serum HBV DNA in endogenous control/chronic HBV (n = 24) versus acute HBV (n = 8) and acute resolved HBV (n = 11) are depicted. (e) Correlation analyses of viral load and the frequency of HBV pol455-specific CD8+ T cells expressing GZMB, ZEB2, EOMES obtained from individuals within endogenous control/chronic HBV (for GZMB and EOMES: n = 11; for ZEB2: n = 13) or acute HBV (n = 7) are depicted, respectively. Each dot represents one HBV pol455-specific CD8+ T cell response with color coding as indicated: dark green, in endogenous control/chronic HBV; light green, acute HBV; dark gray, acute resolved HBV. Bar charts show the median value with IQR. Statistical analyses were performed via Kruskal–Wallis test including Dunn’s multiple comparisons test (b,c,d) and simple linear regression analysis (e). Source data
Extended Data Fig. 5
Extended Data Fig. 5. Characteristics of HBV pol455-specific CD8+ T cells in endogenously controlled vs. acute. vs acute resolved HBV infection.
(a) Protein expression levels of the indicated cytotoxic- and exhaustion-associated markers in GZMB+ HBV pol455-specific CD8+ T cells are plotted on t-SNE (endogenous control/chronic HBV, n = 12; acute HBV, n = 7; acute resolved HBV, n = 4). Scaled expression (blue, low; red, high) is depicted. (b) Expression levels of TCF-1 were examined in HBV pol455-specific CD8+ T cells t-SNE (endogenous control/chronic HBV, n = 8; acute HBV, n = 4; acute resolved HBV, n = 5). Histograms and statistical graph depicting gating and frequencies of HBV pol455-specific CD8+ T cells are displayed. (c) Regulon activity matrix obtained from single-cell transcriptomes of HBV pol455-specific CD8+ T cells in endogenous control/chronic HBV (n = 3), acute HBV (n = 3) and acute resolved HBV infection (n = 2) after applying SCENIC algorithm. Each dot represents one HBV pol455-specific CD8+ T cell response with color coding as indicated: dark green, in endogenous control/chronic HBV; light green, acute HBV; dark gray, acute resolved HBV. Bar charts show the median value with IQR. Statistical analyses were performed via Kruskal–Wallis test including Dunn’s multiple comparisons test (b). Source data
Extended Data Fig. 6
Extended Data Fig. 6. TGFß pathway analyses of HBV-specific CD8+ T cells.
(a) Heatmap showing TGFβ-receptor gene expression in HBV core18-specific and HBV pol455-specific CD8+ T cells of endogenous control/chronic HBV (n = 7; HBVcore18: n = 4, HBVpol455: n = 3) and NUC control/chronic HBV (n = 7; HBVcore18: n = 3, HBVpol455: n = 4) (left). Scaled expression levels are color coded (blue, low; brown, high). GSEA analysis of the TGFβ signaling pathway in HBV core18-specific versus HBV pol455-specific CD8+ T cells of endogenous control/chronic HBV and NUC control/chronic HBV (right). The aggregated transcript counts are mapped in violin plots (box center line, median; box limits, upper and lower quartiles; box whiskers, IQR). (b) Feature plots showing CD8A, GZMB, TGFBR1 and TGFBR3 co-expression in CD8+ T cells sampled from blood and the liver by FNA (data from Genshaft et al., Hepatology, 2023). (c) IL-10 cytokine pathway gene expression analysis of HBV pol455-specific CD8+ T cells obtained from endogenous control/chronic HBV (n = 3), acute HBV (n = 3) and acute resolved HBV infection (n = 2). The aggregated transcript counts are mapped in violin plots (box center line, median; box limits, upper and lower quartiles; box whiskers, IQR). (d) Dot plots showing T-BET and PRF1 expression of HBV pol455-specific CD8+ T cells obtained from endogenous control/chronic HBV (n = 6) after 14 days of in vitro culture with (left) and without TGF-β RI Kinase Inhibitor II (right). Statistical graph depicting frequencies of T-BET+ or PRF1 + HBV pol455-specific CD8+ T cells are displayed. (e) ZEB2, T-BET, EOMES, GZMB and PRF1 expression of HBV pol455-specific CD8+ T cells obtained from acute HBV infection (n = 4) after 14 days of in vitro culture with and without TGF-β RI Kinase Inhibitor II is shown. (f) TGFβ concentration in plasma (EDTA) in endogenous control/chronic HBV (n = 26), acute HBV (n = 7) and acute resolved HBV (n = 7) was determined by ELISA and is depicted as pg/ml. Bar charts show the median value with IQR. Statistical analyses were performed via Kruskal–Wallis test including Dunn’s multiple comparisons test (a,c,f) and two-tailed Wilcoxon matched-pairs signed rank test (d,e). Source data
Extended Data Fig. 7
Extended Data Fig. 7. Impact of TGFβ signalling inhibition on HBV pol455-specific CD8+ T cell function.
(a) Dot plots showing IFNγ-, TNF and CD107a-producing HBV pol455-specific CD8+ T cells in response to peptide stimulation after 14 days of in vitro culture with (left) and without TGFβ RI Kinase Inhibitor II (middle). Negative control is depicted on the right. The percentages of IFN-γ-, TNF and CD107a-producing HBV pol455-specific CD8+ T cells were determined in relation to the frequency of HBV pol455-specific CD8+ T cells for individuals with endogenous control/chronic HBV. (b) The polyfunctionality of HBV pol455-specific CD8+ T cells were assessed by gating on IFN-γ and TNF positive cells. Each dot represents one of the respective HBV pol455-specific CD8+ + T cell responses with color coding as indicated: dark green, endogenous control/chronic HBV, n = 6. Statistical analyses were performed via two-tailed Wilcoxon matched-pairs signed rank test (a,b). Source data
Extended Data Fig. 8
Extended Data Fig. 8. Effects of IL12 and IFNα on the attenuated HBV pol455-specific CD8+ T cell response.
(a) IL-2, IL-12 and IFNα cytokine pathway gene expression analysis of HBV pol455-specific CD8+ T cells obtained from endogenous control/chronic HBV (n = 3), acute HBV (n = 3) and acute resolved HBV infection (n = 2). The aggregated transcript counts are mapped in violin plots (box center line, median; box limits, upper and lower quartiles; box whiskers, IQR). (b+c) PRF1 expression of HBV pol455-specific CD8+ T cells after 14 days of in vitro culture with (b) IL-12 (endogenous control/chronic HBV n = 7) or (c) IFNα treatment (endogenous control/chronic HBV n = 8) or without any treatment is shown (d) Protein expression levels of the indicated cytotoxic and effector-associated markers in HBV pol455-specific CD8+ T cells are plotted. Scaled expression (blue, low; red, high) is depicted. Each dot represents one of the respective HBV pol455-specific CD8+ T cell responses with color coding as indicated: dark green, endogenous control/chronic HBV. Statistical analyses were performed via Kruskal–Wallis test including Dunn’s multiple comparisons test (a) and two-tailed Wilcoxon matched-pairs signed rank test (b,c). Source data

References

    1. World Health Organization. Hepatitis B. https://www.who.int/news-room/fact-sheets/detail/hepatitis-b (2024).
    1. EASL. 2017 Clinical Practice Guidelines on the management of hepatitis B virus infection. J. Hepatol.67, 370–398 (2017). 10.1016/j.jhep.2017.03.021 - DOI - PubMed
    1. Thimme, R. et al. CD8(+) T cells mediate viral clearance and disease pathogenesis during acute hepatitis B virus infection. J. Virol.77, 68–76 (2003). 10.1128/JVI.77.1.68-76.2003 - DOI - PMC - PubMed
    1. Maini, M. K. et al. The role of virus-specific CD8(+) cells in liver damage and viral control during persistent hepatitis B virus infection. J. Exp. Med.191, 1269–1280 (2000). 10.1084/jem.191.8.1269 - DOI - PMC - PubMed
    1. Webster, G. J. et al. Longitudinal analysis of CD8+ T cells specific for structural and nonstructural hepatitis B virus proteins in patients with chronic hepatitis B: implications for immunotherapy. J. Virol.78, 5707–5719 (2004). 10.1128/JVI.78.11.5707-5719.2004 - DOI - PMC - PubMed

Substances