. 2024 Sep;633(8028):174-181.
doi: 10.1038/s41586-024-07806-1. Epub 2024 Aug 28.

Spatially clustered type I interferon responses at injury borderzones

Affiliations

Spatially clustered type I interferon responses at injury borderzones

V K Ninh et al. Nature. 2024 Sep.

Abstract

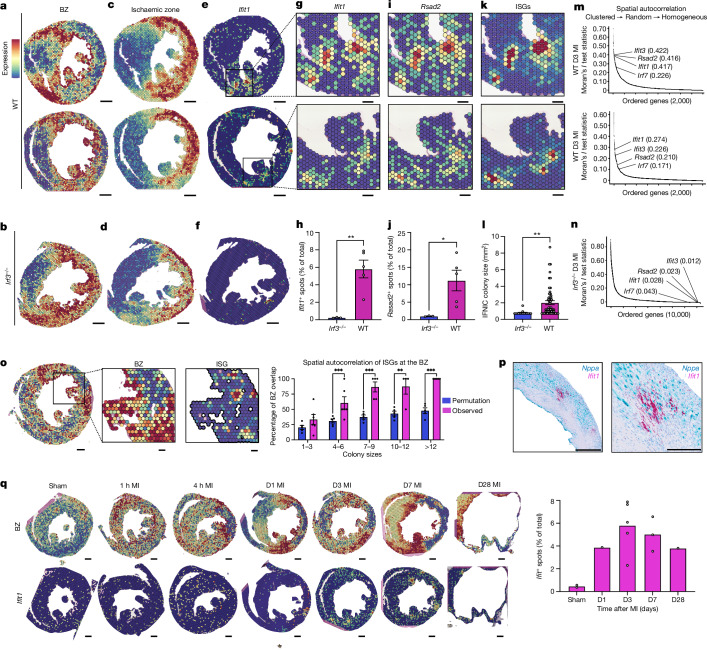
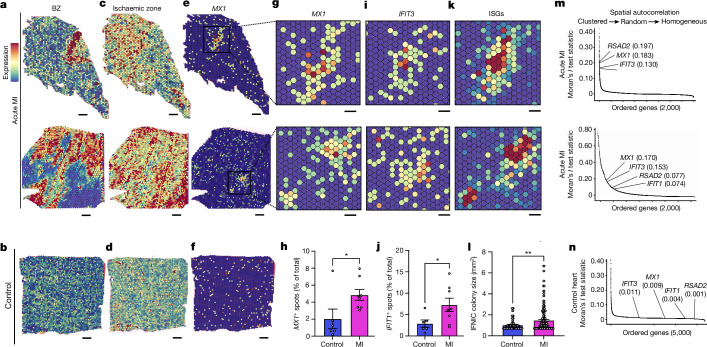
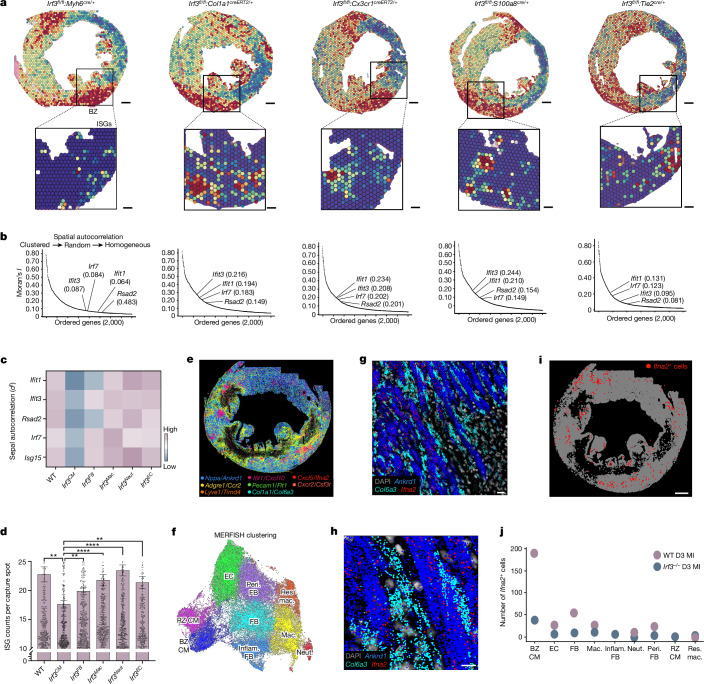
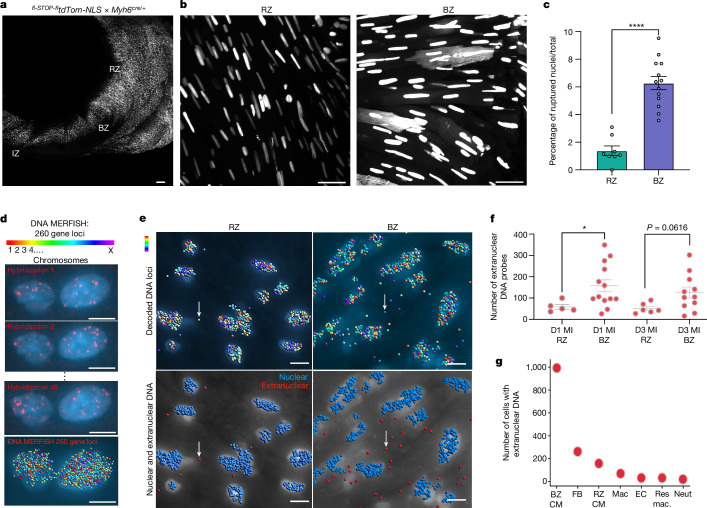
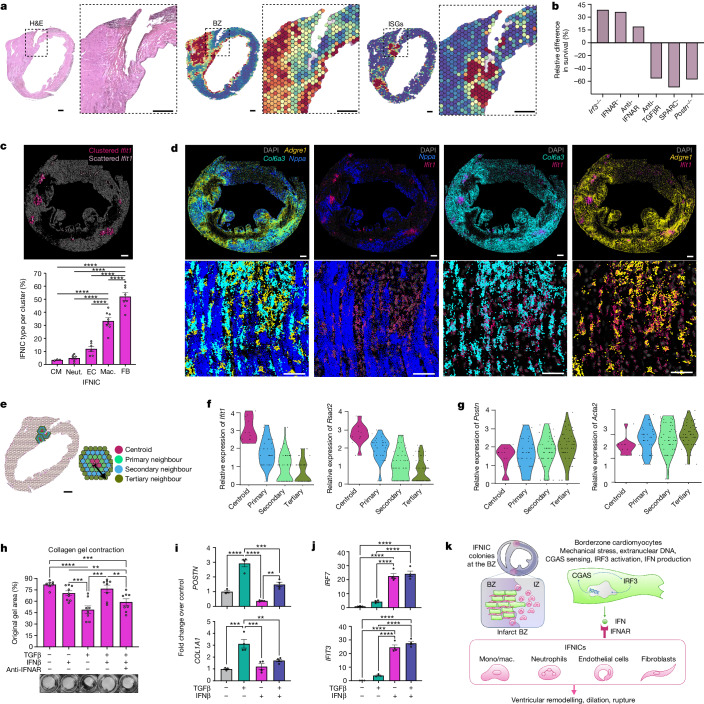
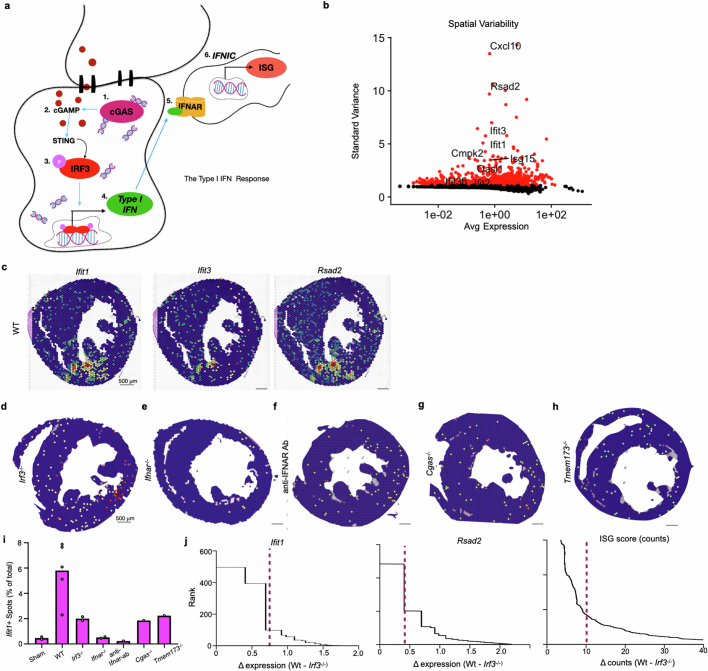
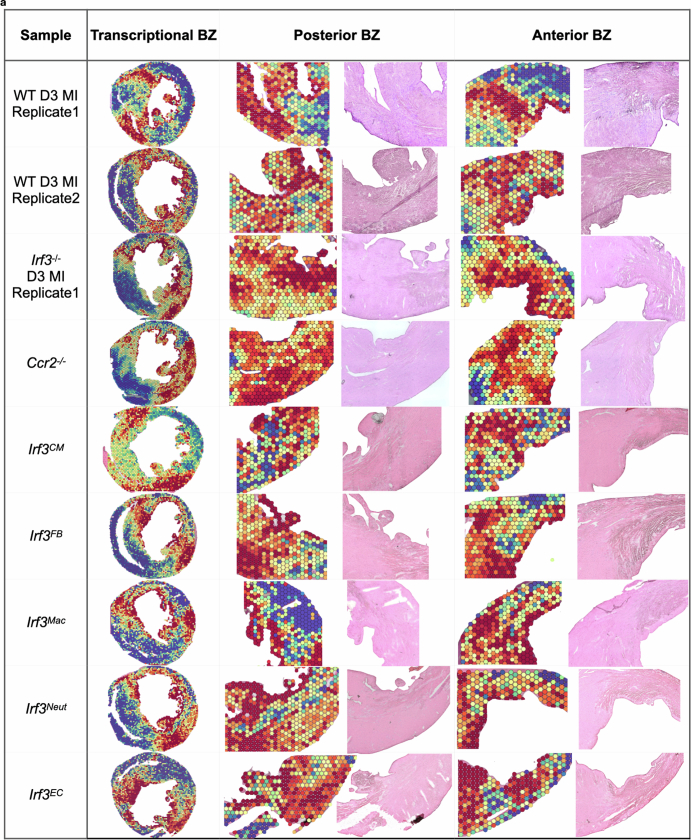
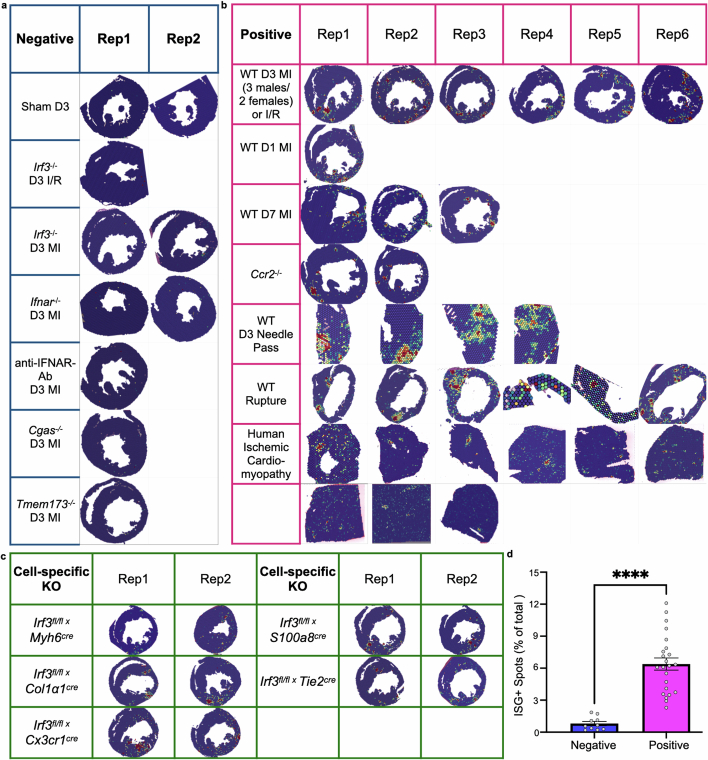
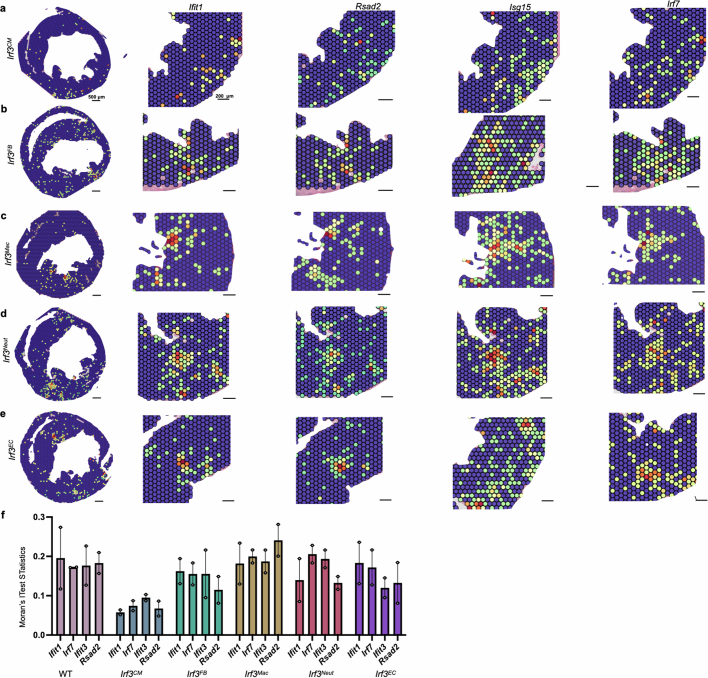
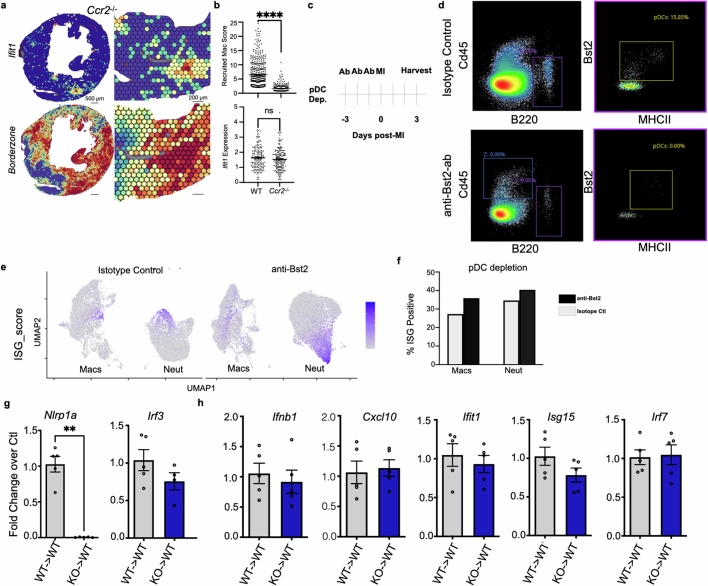
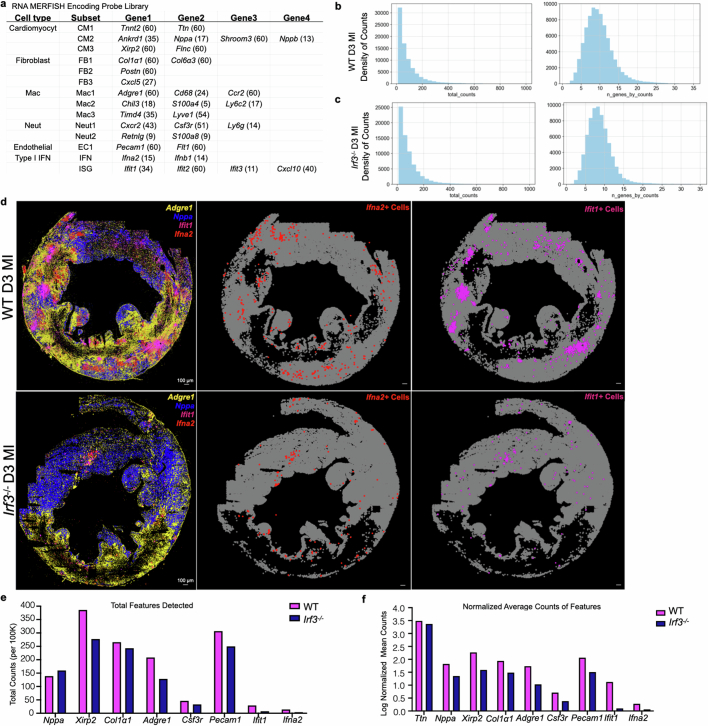
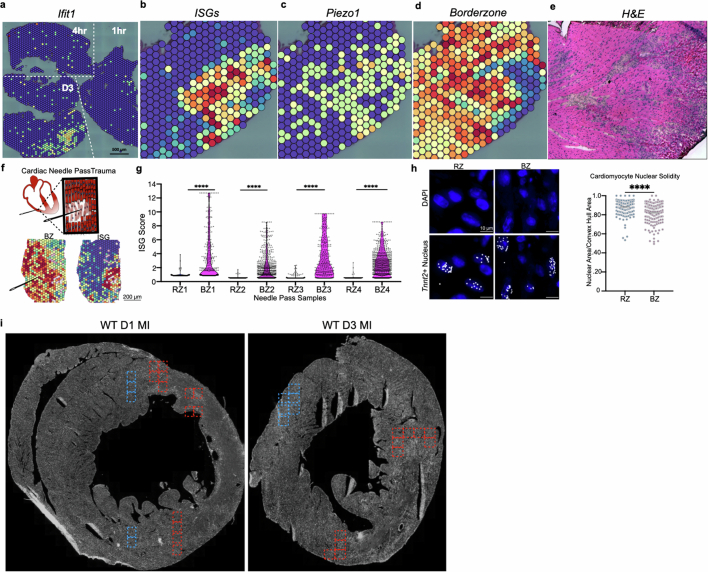
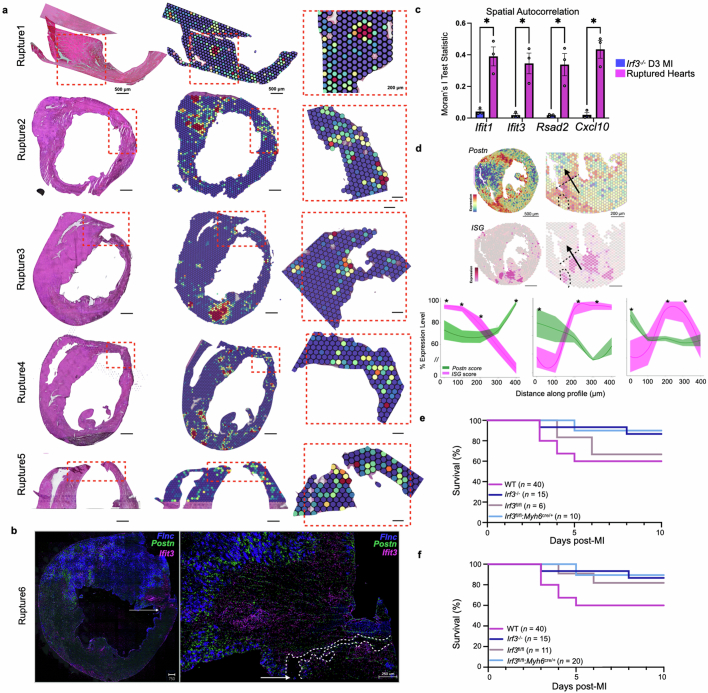
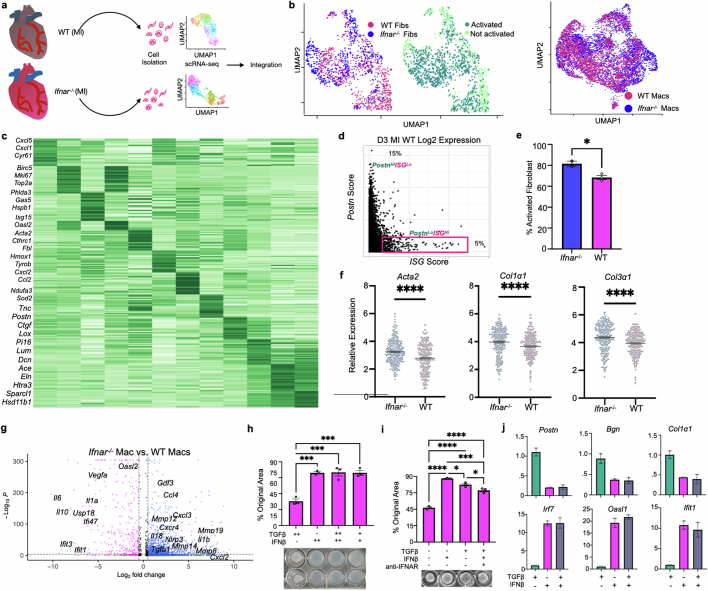
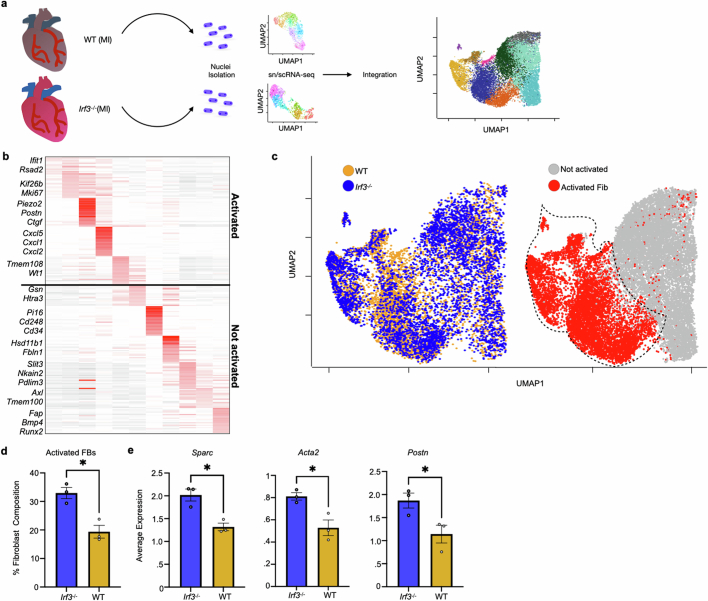
Sterile inflammation after myocardial infarction is classically credited to myeloid cells interacting with dead cell debris in the infarct zone1,2. Here we show that cardiomyocytes are the dominant initiators of a previously undescribed type I interferon response in the infarct borderzone. Using spatial transcriptomics analysis in mice and humans, we find that myocardial infarction induces colonies of interferon-induced cells (IFNICs) expressing interferon-stimulated genes decorating the borderzone, where cardiomyocytes experience mechanical stress, nuclear rupture and escape of chromosomal DNA. Cardiomyocyte-selective deletion of Irf3 abrogated IFNIC colonies, whereas mice lacking Irf3 in fibroblasts, macrophages, neutrophils or endothelial cells, Ccr2-deficient mice or plasmacytoid-dendritic-cell-depleted mice did not. Interferons blunted the protective matricellular programs and contractile function of borderzone fibroblasts, and increased vulnerability to pathological remodelling. In mice that died after myocardial infarction, IFNIC colonies were immediately adjacent to sites of ventricular rupture, while mice lacking IFNICs were protected from rupture and exhibited improved survival3. Together, these results reveal a pathological borderzone niche characterized by a cardiomyocyte-initiated innate immune response. We suggest that selective inhibition of IRF3 activation in non-immune cells could limit ischaemic cardiomyopathy while avoiding broad immunosuppression.


Conflict of interest statement

K.L.C. is a cofounder, board member and consultant for, and holds equity interest in Ventrix and Karios Technologies. K.R.K. and V.K.N. hold a patent declaration PCT 114198-5210 on compositions and methods to treat muscle injury and disease.

Figures

Fig. 1
Fig. 1. MI induces focal IFNIC colonies at BZs in mice.
Spatial transcriptomics analysis of short-axis sections from infarcted mouse hearts at day 3 (D3) after MI. a,b, BZ gene scores (Supplementary Table 2) for 2 WT (a) and 1 Irf3−/− (b) hearts. c,d, Ischaemic zone gene scores for 2 WT (c) and 1 Irf3−/− (d) hearts. e,f, Ifit1 gene expression for WT (e) and Irf3−/− (f) hearts. gl Magnified view of representative ISGs Ifit1 (g) and Rsad2 (i) and the summed ISG score count score (k). Quantification of Ifit1+ (h) and Rsad2+ (j) spots per section, and IFNIC colony sizes (l) in day 3 WT hearts compared with in day 3 Irf3−/− hearts. n = 3 (Irf3−/−) and n = 5 (WT) mice. m,n, Moran’s I test statistics of the top 2,000 variable features with annotated ISGs within represented samples in WT (m) and Irf3−/− (n) hearts. o, ISG cluster localization to the infarct BZ determined by permutation testing of randomly placed ISG clusters of different sizes in each WT day 3 sample. n = 5 WT mice (Supplementary Fig. 3c). p, Representative in situ hybridization staining of Nppa (blue) and Ifit1 (magenta) transcripts. q, The time course of cardiac spatial transcriptomic patterns (left) of the BZ gene score (top) and Ifit1 (bottom) for sham, 1 h, 4 h, day 1, day 3, day 7 and day 28 after MI. Data were analysed using two-tailed Student’s t-tests (h, j and l), one-sided Moran’s I test statistic with Benjamini–Hochberg false-discovery rate (FDR) adjustment (m and n), and values derived from Monte Carlo simulation of autocorrelation coefficients were compared to observed values using two-sided Fisher’s exact tests with Yates’ correction (o); *P < 0.05, **P < 0.001, ***P < 0.0001. Data are mean ± s.e.m. Results in ap are representative of three independent repeated experiments. Detailed statistics for null-hypothesis testing are provided in Supplementary Table 1. Scale bars, 500  μm (af, o (left), p and q) and 200 μm (g, i, k and o (middle and right)). Source Data
Fig. 2
Fig. 2. MI induces focal colonies of IFNICs in humans.
Spatial transcriptomics analysis of tissue sections from infarcted human hearts or controls. a,b, Human BZ gene scores (Supplementary Table 3.1) in two representative infarcted hearts (a) and one control heart (b). c,d, Human ischaemic zone gene score (Supplementary Table 3.2) for the same infarcted (c) and control (d) hearts. e,f, Representative ISG expression (MX1) for the same infarcted (e) and control (f) hearts. gl, Magnified views of IFNIC gene expression in the same infarcted hearts for MX1 (g), IFIT3 (i) and the ISG score (k) (Supplementary Table 3.3), and quantification of MX1+ (h) and IFIT3+ (i) pixels per section and IFNIC colony size (l). n = 6 non-infarcted or RZ individuals, n = 8 individual hearts. m,n, Moran’s I test statistics of the top 2,000 variable features with annotated ISGs within represented samples in infarcted (m) and control (n) human hearts. Data were analysed using two-tailed Student’s t-tests (h, j and l) and one-sided Moran’s I test statistic with Benjamini–Hochberg FDR adjustment (m and n). Data are mean ± s.e.m. The results in an are representative of three independent repeat analyses. Scale bars, 500 μm (af) and 200 μm (g, i and k). Source Data
Fig. 3
Fig. 3. Cardiomyocytes are dominant initiators of the type I IFN response in MI.
Sequencing-based spatial transcriptomics performed on cell-type-specific Irf3-knockout hearts collected at day 3 after MI. a, BZ gene scores in cell-type-specific Irf3-knockout mice (top) with magnified ISG scores shown in conditional knockout mice (bottom). b, Moran’s I test statistic of the top 2,000 variable features with annotated ISGs with represented conditional knockout samples. c, Sepal scores derived from diffusion-based modelling to assess spatial autocorrelation. n = 4 WT mice and n = 2 mice per genotype. d, Gene counts of ISG score were summed in each spatial sequencing spot and thresholded to remove spots with counts of <10 in WT and transgenic mice. n = 4 WT mice, 9,273 transcriptome spots; n = 2 Irf3CM mice, 4,928 spots; n = 2 Irf3FB mice, 4,841 spots; n = 2 Irf3Mac mice, 4,734 spots; n = 2 Irf3Neut mice, 4,860 spots; and n = 2 Irf3EC mice, 4,310 spots. ej, RNA MERFISH analysis was performed in WT and Irf3−/− hearts at day 3 after MI. e, Representative image of cell marker probes used in cell clustering. f, Uniform manifold approximation and projection (UMAP) analysis of annotated cells from WT and Irf3−/− hearts at day 3 after MI. Data of cells from Irf3−/− hearts at day 3 after MI were ingested with data of WT day 3 MI heart using Scanpy. n = 44,606 cells, 1 WT mouse; n = 41,953 Irf3−/− cells, 1 Irf3−/− mouse. RZ CM, remote zone cardimyocyte; BZ CM, borderzone cardiomyocyte; EC, endothelial cell; Peri FB, perivascular fibroblast; FB, fibroblast; Inflamm FB, inflammatory fibroblast; Res Mac, resident macrophage; Mac, infiltrating macrophage; Neut, neutrophil. g,h, Representative localization of type I IFN Ifna2 (red), BZ cardiomyocyte gene Ankrd1 (blue) and fibroblast gene Col6a3 (cyan) (g) with a magnified view shown below (h). i,j, Ifna2 transcripts assigned to individual cells represented by red circles as Ifna2+ cells (i) and quantification of Ifna2+ cells (j) in WT and Irf3−/− mice. Data were analysed using one-tailed Moran’s I test statistic with Benjamini–Hochberg FDR adjustment (b) or one-way ANOVA with Bonferroni’s (c) or Dunn’s (d) correction for multiple-comparison testing. Data are mean ± s.e.m. ****P < 0.0001. Results in a and b are representative of two independent repeated experiments. Scale bars, 750 μm (i), 500 μm (a, top), 200 μm (a, bottom) and 150 μm (g and h). Source Data
Fig. 4
Fig. 4. Nuclear rupture and extranuclear DNA are found in load-bearing cells of the infarct BZ in vivo.
a, Representative image of short-axis whole-mounted heart from an infarcted cardiomyocyte-specific nuclear reporter mouse (CM-tdTom-NLS). This transgenic reporter was generated by crossing fl-STOP-fltdTom-NLSfl-STOP-fl and Myh6cre/+ mice. b, Representative images of CM-tdTom-NLS in nuclei of the RZ and BZ. Nuclear rupture was visualized as fluorescent reporter diffused throughout the cytoplasm of the outlined cardiomyocytes, whereas tdTom fluorescence was confined within the nuclear membrane in non-ruptured nuclei. c, Quantification of ruptured nuclei in the RZ versus BZ of infarcted CM-tdTom-NLS heart measured as the ratio between ruptured nuclei over total nuclei in each field of view. n = 788 RZ nuclei in 8 fields of view, 954 BZ nuclei in 13 fields of view, 1 mouse. d, Sequence-specific DNA probes were designed and synthesized to detect nuclear and extranuclear DNA in mouse hearts at day 1 and 3 after MI. Representative images of DNA MERFISH probes for 260 gene loci in 21 mouse chromosomes and rounds of hybridization of fluorescently labelled readout probes. e, Representative images of computationally decoded DNA loci (blue) in the RZ and BZ (e; top). Neighbour-based clustering of hybridized DNA probes was used to determine DNA probe localization to nuclear (blue) or extranuclear (red) compartments (e; bottom) and to quantify the number of extranuclear probes in imaged RZ and BZ regions (f) on days 1 and 3 after MI. n = 1,535 cells, 2 mice. g, Data of cells containing extranuclear DNA were ingested with RNA MERFISH data to determine the relative amounts of extranuclear DNA probes within each cell type. Data were analysed using unpaired two-tailed Mann–Whitney tests (c and f). Data are mean ± s.e.m. Results in ac are representative of 70 observations of ruptured nuclei within the whole-mount section. Scale bars, 150 μm (a) and 10 μm (b, d and e). Source Data
Fig. 5
Fig. 5. MI-induced IFNIC colonies co-localize at ventricular rupture sites.
a, Representative haematoxylin and eosin (H&E) staining, BZ score and ISG score with magnified insets of the ventricular rupture site. b, The relative difference in post-MI survival in cited studies that inhibited type I IFN signalling or fibroblast activation,–. c, Clustered and scattered expression of Ifit1 were identified using density-based clustering (DBSCAN). The relative proportion of each cell type within each cluster is shown below. n = 1,250 cells in 8 clusters, 1 mouse. d, Fluorescent cell-type-specific probes for Nppa (cardiomyocytes; blue), Col6a3 (fibroblasts; cyan), Adgre1 (macrophages; yellow) and Ifit1 (ISG, magenta) from RNA MERFISH (top). Bottom, magnified view within IFNIC colony 7 from c. e, ISG scores were processed for k-means clustering, and spots with the highest expression were designated as centroids, and adjacent spots were designated as primary, secondary or tertiary neighbours. n = 4 mice. f,g, Differential gene expression analysis comparing ISG neighbours versus centroid, and selected genes are shown in violin plots for Ifit1 and Rsad2 (f), and Postn and Acta2 (g). h, Collagen gel contraction using human iPS-cell-derived fibroblasts as untreated controls (n = 7) or treated with 10 ng ml−1 IFNβ1 (n = 8), 10 ng ml−1 TGFβ (n = 9), IFNβ1 + TGFβ (n = 8) or IFNβ1 + TGFβ + anti-IFNAR antibody (n = 8). i,j, Matricellular (i) and ISG (j) gene expression in cells treated similarly to in h. k, The proposed model in which BZ cardiomyocytes are dominant initiators of IFNIC colonies leading to pathogenic IRF3-dependent responses to MI. Data were analysed using one-way analysis of variance (ANOVA) with Bonferroni’s post hoc test (c, i and j), two-way ANOVA with Tukey’s post hoc test (h) and Wilcoxon rank-sum tests (f and g). Data are mean ± s.e.m. The results in hj are representative of two independently repeated experiments. Scale bars, 750 μm (c and d (top)), 500 μm (a), 200μm (d (bottom)) and 100 μm (e). Source Data
Extended Data Fig. 1
Extended Data Fig. 1. The type I IFN response produces spatially clustered ISG expression.
(a) Representative depiction of the type I IFN pathway. The primary response involves cGAS sensing of decompartmentalized dsDNA in the cytosol and resulting 2nd messenger production of cGAMP. This activates the STING adaptor resulting in phosphorylation and activation of the master transcriptional regulator IRF3. Translocation of IRF3 into the nucleus induces expression and secretion of type I IFN cytokines which signal to bystander cells via binding to the IFNAR receptor in an autocrine or paracrine manner. IFNAR-binding results in the expression of hundreds of interferon stimulated genes (ISGs) as a robust readout of the secondary response and delineation of IFNICs. (b) Spatially variable features were calculated by Seurat’s FindVariableFeatures() using vst as the selection method. Standard variance plotted against log normalized average expression of highly variable features. ISGs were among the 2000 topmost variable features labelled. (c) Interferon stimulated genes projected onto space in a D3 post-MI cardiac section. (d-h) Genetic knockout mice of signalling components in the cGAS-STING-IRF3 axis were infarcted and harvested D3 post-MI for spatial transcriptomic analysis. Representative Ifit1 expression in infarcted (d) Irf3−/− (n = 2 mice), (e) Ifnar−/− (n = 2 mice), (f) anti-IFNAR-ab treatment (n = 1 mouse), (g) Cgas−/− (n = 1 mouse) and (h) STING−/− (Tmem173) hearts (n = 1 mouse). (i) Number of positive spots (above zero) for Ifit1 expression for infarcted WT and genetic knockout mice of the cGAS-STING-IRF3 signalling axis. (j) Ranked plots for Ifit1 expression (.70), Rsad2 expression (.45), and gene counts of the ISG score (10) by measuring the difference between WT and Irf3−/− (n = 2 mice per genotype). Source Data
Extended Data Fig. 2
Extended Data Fig. 2. Comparison of transcriptionally defined BZ and underlying H&E tissue histology.
(a) H&E tissue histology underlying the transcriptionally defined anterior and posterior BZs for representative spatial transcriptomics samples.
Extended Data Fig. 3
Extended Data Fig. 3. Biological replicates of the clustered type I IFN response after MI in mice and humans and corresponding negative controls.
ISG scores represented in all the sequencing-based spatial transcriptomic datasets used in this study with a minimum cutoff of expression level 2. Reps refer to biological replicates and correspond with numbers of mice. (a) Table representing all biological replicates and samples used for spatial transcriptomic analysis in this study. Column a contains representative images of sample conditions that were negative for IFNIC colonies including the validation of using knockouts of Cgas-Sting-IRF3 pathway as negative controls for the study. (b) Positive IFNIC colonies represented in biological replicates for conditions used to determine the presence of ISG+ conditions. (c) Representative IFNIC colonies in cell-specific knockouts (n = 2 each transgenic line). (d) Percent of pixels positive for ISG scores out of total pixels overlying tissue were calculated for each sample in negative vs. positive mouse datasets. Data analysed using two-tailed Mann-Whitney test and data are means ± s.e.m. and ****P < 0.0001. Source Data
Extended Data Fig. 4
Extended Data Fig. 4. IFNIC colonies are initiated by BZ cardiomyocytes.
(a) Representative images of 4 individual ISGs in cardiomyocyte- (b) fibroblast- (c) macrophage- (d) neutrophil-, and (e) endothelial-specific deletions of Irf3. (f) Ranked percentile of Moran’s I test statistic for ISGs Ifit1, Ifit3, Rsad2, Irf7, and Isg15 computed for each biological replicate of WT D3 infarcted mice and cell-type deletions of Irf3−/− mice (n = 3 WT mice and n = 2 mice per transgenic line). (f) Data analysed with one-way ANOVA and Dunnett’s post-hoc analysis for multiple comparisons. Data presented as mean values ± s.e.m. and **P < 0.005. Results in (a-f) are representative of 2 independent repeated experiments. Source Data
Extended Data Fig. 5
Extended Data Fig. 5. Infiltrating myeloid cells are dispensable for IFNIC colony formation in the infarcted murine heart.
(a) Representative Ifit1 + IFNIC colony and BZ gene score in Ccr2-defiicient hearts at D3 post-infarct. (b) Gene scores for recruited macrophages and ISG’s were summed in each spot in WT and Ccr2-defiicient hearts at post-MI D3 (n = 2 mice per condition). (c) Timeline of antibody-mediated plasmacytoid dendritic cell (pDC) depletion. Anti-Bst2 antibody or isotype control antibody was administered for 3 days prior to MI surgery and hearts were harvested D3 post-MI and processed for scRNA-seq. (d) Gating strategy to determine pDCs depletion in isotype control-treated or anti-BST2-ab treated, infarcted mouse hearts. Cd45 + B220+ positive myeloid cells were gated by MHCII expression and BST2 to identify pDCs. (e) Feature plots of Ifit1 expression in neutrophils and macrophages isolated from mice treated with either isotype control-antibody or anti-Bst2-Ab treated mice. (f) Percentage of ISG+ macrophages and neutrophils in scRNA-seq data from D3 post-MI mouse hearts treated with anti-Bst2 (n = 23,104 cells; 1 mouse) or Isotype control (n = 12,196 cells; 1 mouse). (g) Chimeric bone marrow transplant experiment in which the bone marrow from WT or Irf3−/− mice are transplanted into irradiated WT or Irf3−/− mice. Mice were allowed 8–10 weeks to recover from bone marrow transplant before performing MI and harvesting infarcted hearts D4 post-MI to perform. Nlrp1a and Irf3 gene expression analysis measured by qPCR in the WT- > WT condition compared to KO- > WT condition (n = 5 mice per condition). (h) Gene expression analysis by qPCR in D4 infarcted hearts between WT- > WT transfer and KO- > WT transfer conditions. Data was analysed using two-tailed unpaired student’s t-test (b, g, h) and presented as mean values ± s.e.m., **P < 0.01, ****P < 0.0001. Source Data
Extended Data Fig. 6
Extended Data Fig. 6. Validation of RNA MERFISH encoding probe library by comparison of log-normalized of transcripts detected in WT and Irf3-deficient mice.
(a) Number of total probes designed for each transcript in the encoding library used in this study. (b) Quality control metrics of total counts of each transcript detected in WT D3 MI heart and (c) in Irf3-deficient D3 MI heart. (d) Representation of Ifna2 (red), Ifit1 (magenta), and Nppa (blue) in WT and Irf3−/− D3 MI mice (n = 44,606 cells from 1 WT mouse and 41,953 cells from 1 Irf3−/− mouse). (e) Comparison of the total mean counts in the raw data and (f) log-normalized counts of detected transcripts for BZ genes such as Nppa, Flnc, Ankrd1 between WT and Irf3-deficient mice.
Extended Data Fig. 7
Extended Data Fig. 7. DNA MERFISH enables sequence-specific detection of extranuclear DNA.
(a) Time course of needle pass injury. The appearance of Ifit1 expression occurred at D3 post-injury at the side of needle insertion, similar to the time course of ISG expression in infarcted hearts. (b) Close-up view of scored ISGs, (c) mechanically induced Piezo1, (d) scored BZ genes, and (e) H&E at the site of day 3 post-injury. (f) Schematic of experimental traumatic injury induced by in vivo needle-insertion in healthy hearts. BZ gene score and ISG score spatial transcriptomics and (g) quantitative comparison of ISG scores at BZ vs. RZ at the site of mechanical injury (n = 4 mice). (h) Nuclear solidity of RZ vs. BZ cardiomyocytes was identified by Tnnt2 transcript expression (n = 200 nuclei per region of interest across 2 mice) in RNA MERFISH images. (i) Regions of interest used to image and quantify extranuclear DNA probes in WT D1 and WT D3 infarcted hearts were chosen based on underlying histology demarcating the RZ and BZ (n = 2 mice). The regions designated as RZ are shown in blue dashed boxes, and the regions designated as the BZ are shown in red dashed boxes for each sample. RNA MERFISH was then performed on these same samples by hybridizing the encoding library listed in Extended Data Fig. 6a to identify the cell types containing extranuclear DNA probes. (g, h) Data was analysed using one-way ANOVA with Sidak’s multiple comparisons test between between RZ and BZ regions across 4 biological samples (g) and two-tailed Mann-Whitney test (h). Data are means ± s.e.m. and ****P < 0.0001. Source Data
Extended Data Fig. 8
Extended Data Fig. 8. IFNIC colonies and ISG expression appear directly adjacent to the site of ventricular rupture.
(a) Infarcted mice were monitored during D3-D7 post-MI for sudden death and rapidly collected by flash-freezing to preserve RNA integrity. Representative images of 7 collected rupture samples from WT mice show IFNIC colonies directly adjacent to the site of ventricular rupture (n = 7). (b) In situ hybridization of ruptured cardiac cross section with representative Flnc (blue), Postn (green), and Ifit3 (magenta). Clustering of Ifit3 to the site of rupture is seen and demarcated by white dotted line. (c) Moran’s I test statistic for each ISG was computed in ruptured heart samples compared to Irf3−/− hearts (n = 3 mice per condition). (d) Line scans were performed in WT D3 MI samples to quantify the inverse correlation between Postn (Supplementary Table 2) and ISG scores along a diagonal vector (n = 3 mice). (e) Post-MI survival performed with WT (n = 40 mice), Irf3−/− (n = 15 mice), Irf3fl/fl:Myh6cre/+ (n = 10), and Irf3fl/fl littermate controls (n = 6). Littermate controls from this cohort matched WT survival as expected. (f) Littermate controls from the second cohort exhibited 100% survival (n = 5). Given the potential batch effect, the littermate controls are thus underpowered. Spatial correlation coefficients were transformed with Fisher’s Z and compared using two-tailed unpaired t-tests (c). ANCOVA with LOESS moving average and regression analysis was used in (d). Data presented as mean values ± s.e.m. and *P < 0.05. Results in (a-c) are representative of 4 independent repeats. Source Data
Extended Data Fig. 9
Extended Data Fig. 9. Signalling through type I IFN receptor antagonizes fibroblast activation and function.
(a) Whole cell isolation from WT and IFNAR-deficient hearts processed for scRNA-seq. Single cell datasets were integrated and log normalized (n = 4 WT, 2 Ifnar−/− mice). (b) UMAP of clustered fibroblasts and macrophages from WT and Ifnar−/− D4 infarcted hearts. Integrated fibroblasts were split by activated vs. nonactivated fibroblasts based on differential expression of Postn gene score. (c) Heatmap of fibroblast subcluster marker genes. (d) Feature scatterplot from D4 MI hearts showing an inverse scatter profile between PostnHI and ISG scores. Approximately 5% of fibroblasts isolated from WT infarcted hearts are IFNICs and express low counts of Postn (n = 4 WT mice). (e) Percentage of activated fibroblast composition between Ifnar−/− and WT mouse hearts and (f) log normalized expression of gene markers in activated fibroblast populations (n = 784 WT and 802 Ifnar−/− fibroblasts). (g) Volcano plot of differentially expressed genes between WT and Ifnar−/− macrophages corrected (n = 3628 WT macs, 3885 Ifnar−/− macs). (h) Collagen Gel contraction assays performed with L929 fibroblasts treated with 10 ng/mL TGFβ, 10 ng/mL IFNβ, or combination treatment (n = 3 replicates per condition). (i) Treatment with anti-IFNAR-ab abrogated the IFNβ-mediated blockade of the fibroblast contractile phenotype (n = 3 gels per condition). (j) Top: L929 fibroblast gene expression of matricellular proteins after treatment with TGFβ, IFNβ, or combination treatment, and corresponding inverse expression of ISG’s in the bottom panel (n = 2 replicates per condition). Data was analysed using two-tailed unpaired t or Mann-Whitney test (e, f), Wilcoxon rank sum test with Benjamini-Hochberg FDR correction (b, c, g), and two-tailed one-way ANOVA with Bonferroni’s post-hoc analysis (h, i, j). Data are mean ± s.e.m., *P > 0.05, *** P > 0.0005 ****P > 0.00005. Source Data
Extended Data Fig. 10
Extended Data Fig. 10. Irf3-deficient hearts have greater fibroblast activation and protective matricellular responses.
(a) Nuclei isolation from WT and Irf3-deficient hearts were processed for snRNA-seq. Nuclei data sets were integrated to enable direct comparison of cell types. (b) Averaged heatmap identifying fibroblast subpopulations were further stratified into activated and not activated based on variable expression level of Postn. (c) UMAP of clustered fibroblasts from snRNA-seq integrated data of WT and Irf3−/− nuclei from D3 infarcted hearts in the left panel and separation of activated vs. non-activated fibroblast populations in the right panel (Wilcoxon-signed rank test, Bonferroni-adjusted P < 0.01). (d) Percent of activated fibroblasts out of total captured fibroblasts (n = 3 mice per condition). (e) Log normalized expression of fibroblast activation markers between those captured from Irf3-deficient and WT D3 MI hearts. Data were analysed using two-tailed unpaired t test (d, e). All data represented as mean ± s.e.m. *P > 0.05, **P > 0.005, ***P > 0.0005, ****P > 0.00005. Source Data

Comment in

References

    1. Chen, C. J. et al. Identification of a key pathway required for the sterile inflammatory response triggered by dying cells. Nat. Med.13, 851–856 (2007). 10.1038/nm1603 - DOI - PubMed
    1. Adamo, L., Rocha-Resende, C., Prabhu, S. D. & Mann, D. L. Reappraising the role of inflammation in heart failure. Nat. Rev. Cardiol.17, 269–285 (2020). 10.1038/s41569-019-0315-x - DOI - PubMed
    1. King, K. R. et al. IRF3 and type I interferons fuel a fatal response to myocardial infarction. Nat. Med.23, 1481–1487 (2017). 10.1038/nm.4428 - DOI - PMC - PubMed
    1. Cohn, J. N., Ferrari, R. & Sharpe, N. Cardiac remodeling-concepts and clinical implications: a consensus paper from an international forum on cardiac remodeling. J. Am. Coll. Cardiol.35, 569–582 (2000). 10.1016/S0735-1097(99)00630-0 - DOI - PubMed
    1. Martin, S. S. et al. 2024 heart disease and stroke statistics: a report of US and global data from the American Heart Association. Circulation149, e347–e913 (2024). 10.1161/CIR.0000000000001209 - DOI - PMC - PubMed

MeSH terms