. 2024 Sep;633(8031):905-913.
doi: 10.1038/s41586-024-07873-4. Epub 2024 Aug 28.

Fibrin drives thromboinflammation and neuropathology in COVID-19

Affiliations

Fibrin drives thromboinflammation and neuropathology in COVID-19

Jae Kyu Ryu et al. Nature. 2024 Sep.

Abstract

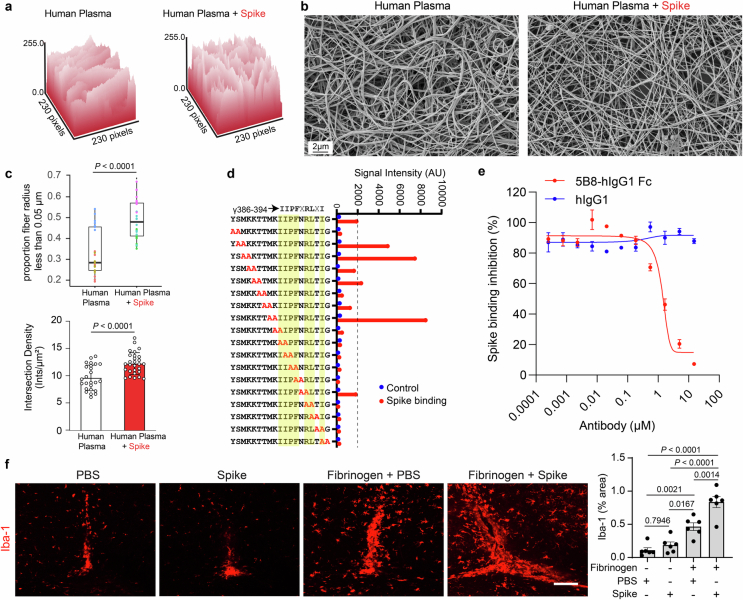
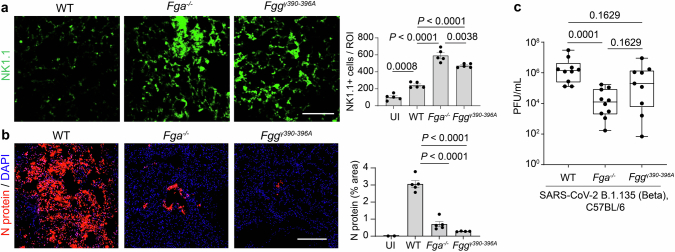
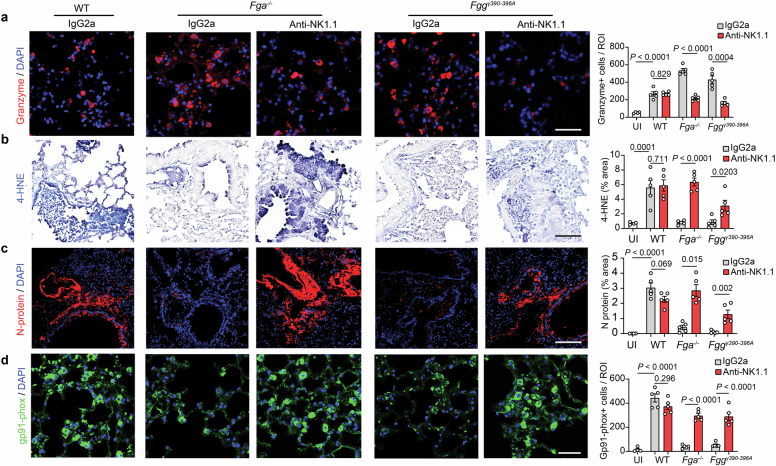
Life-threatening thrombotic events and neurological symptoms are prevalent in COVID-19 and are persistent in patients with long COVID experiencing post-acute sequelae of SARS-CoV-2 infection1-4. Despite the clinical evidence1,5-7, the underlying mechanisms of coagulopathy in COVID-19 and its consequences in inflammation and neuropathology remain poorly understood and treatment options are insufficient. Fibrinogen, the central structural component of blood clots, is abundantly deposited in the lungs and brains of patients with COVID-19, correlates with disease severity and is a predictive biomarker for post-COVID-19 cognitive deficits1,5,8-10. Here we show that fibrin binds to the SARS-CoV-2 spike protein, forming proinflammatory blood clots that drive systemic thromboinflammation and neuropathology in COVID-19. Fibrin, acting through its inflammatory domain, is required for oxidative stress and macrophage activation in the lungs, whereas it suppresses natural killer cells, after SARS-CoV-2 infection. Fibrin promotes neuroinflammation and neuronal loss after infection, as well as innate immune activation in the brain and lungs independently of active infection. A monoclonal antibody targeting the inflammatory fibrin domain provides protection from microglial activation and neuronal injury, as well as from thromboinflammation in the lung after infection. Thus, fibrin drives inflammation and neuropathology in SARS-CoV-2 infection, and fibrin-targeting immunotherapy may represent a therapeutic intervention for patients with acute COVID-19 and long COVID.


Conflict of interest statement

K.A. is listed as an inventor on US patents 7,807,645, 8,569,242, 8,877,195 and 8,980,836, covering fibrin antibodies, submitted by the University of California. K.A. and J.K.R. are listed as co-inventors on US patent 9,669,112 covering fibrin in vivo models, and US patents 10,451,611 and 11,573,222 covering in vitro fibrin assays submitted by Gladstone Institutes. K.A., J.K.R., M.M. and W.C.G. are listed as co-inventors on US patent 12,016,934 covering the COVID-induced thromboinflammation model and US patent application 18/267,710 for use of fibrin immunotherapy in COVID-19 submitted by Gladstone Institutes. K.A. is a co-founder and scientific advisor of Therini Bio. K.A. has served as a consultant for F. Hoffman-La Roche not related to this study. W.C.G. is a co-founder and shareholder in InvisiShield Technologies, but work in this company has no overlap with the topic or findings presented in this paper. M.O. is a founder of DirectBio and is on the scientific advisory board of InvisiShield, but both are scientifically unrelated to this study. The Krogan Laboratory has received research support from Vir Biotechnology, F. Hoffmann-La Roche and Rezo Therapeutics unrelated to this study. N.J.K. has a financially compensated consulting agreement with Maze Therapeutics, is the president and is on the board of directors of Rezo Therapeutics, and is a shareholder in Tenaya Therapeutics, Maze Therapeutics, Rezo Therapeutics, GEn1E Lifesciences and Interline Therapeutics, but all are unrelated to this study. Their interests are managed in accordance with their respective institutions’ conflict of interest policies. The other authors declare no competing interests.

Figures

Fig. 1
Fig. 1. Fibrinogen interaction with SARS-CoV-2 spike.
a,b, Binding enzyme-linked immunosorbent assay (ELISA) of spike to fibrinogen (a) or fibrin (b). Kd, dissociation constant. A450, absorbance at 450 nm. c, Fibrinogen immunoprecipitation (IP) with spike. d, Spike and fibrinogen immunoreactivity in the lungs at 3 d.p.i. Representative of five Beta-infected WT mice. Scale bar, 300 μm. e, Peptide array of fibrinogen chains Aα, Bβ and γ blotted with spike. The binding signal intensity is shown (white to orange). f, Scanning electron microscopy (SEM) images and quantification of the fibrin clot fibre radius in human plasma with spike. The fibre radius distribution was determined in n = 25 (plasma) and n = 28 (plasma with spike) images from three biologically independent experiments (generalized linear mixed-effects model with Holmes multiple correction; Methods) and the fibre radius proportion (<0.05 µm) was determined from n = 3 biologically independent experiments (two-sided paired t-test; Methods). Scale bar, 1 µm. FOV, field of view. g, The turbidity of fibrin polymerization with spike in human plasma. h, Immunoblot (IB) analysis of fibrin degradation by plasmin representative from five (0, 2 and 4 h) or three (1 and 6 h) biologically independent experiments. i, ROS in BMDMs stimulated with fibrin and/or spike. n = 6 (unstimulated and spike) and n = 3 (fibrin or fibrin with spike) biologically independent experiments. a.u., arbitrary units. j, Fibrin γC domain and spike-binding epitope γ364–395 (red). Alanine scanning of γ377–395 blotted with His–spike. The binding of spike to Ala-substituted peptides is shown. The residues that are required for binding are indicated in yellow. k, Competitive ELISA of 5B8-huFc (5B8 with human IgG1 Fc region) or huIgG1 versus spike for binding to fibrin. n = 3 biologically independent experiments. l, ROS in BMDMs stimulated with fibrin and/or spike treated with 5B8 or IgG2b. n = 3 biologically independent experiments. Representative data of n = 3 (ac) or n = 4 (g) biologically independent experiments. For i and l, statistical analysis was performed using one-way analysis of variance (ANOVA) with Tukey’s multiple-comparison test. Data are mean ± s.e.m. Gel source data are provided in Supplementary Fig. 1. Source Data
Fig. 2
Fig. 2. Fibrin drives lung pathology after SARS-CoV-2 infection.
a, Lung pathology of Beta-infected WT, Fga−/− and Fggγ390–396A mice. b, Microscopy analysis of Mac2 (macrophages) and fibrin/fibrinogen in uninfected (UI) (n = 4) and Beta-infected WT (n =10), Fga−/− (n = 10) and Fggγ390–396A (n = 9) mice; gp91phox in uninfected (n = 3) and Beta-infected WT (n = 10), Fga−/− (n = 10) and Fggγ390–396A (n = 9) mice; and Trichrome (collagen, blue; fibrin, red) in uninfected (n = 4) and Beta-infected WT (n = 5), Fga−/− (n = 5), Fggγ390–396A (n = 4) mice. Data are from mice infected in two independent experiments. c, Gene set enrichment analysis (GSEA) of pathways significantly altered in Beta-infected lungs of Fga−/− mice compared with WT mice. NES, normalized enrichment score. d, Significant genes and pathways. Uninfected: n = 4 (WT) and n = 3 (Fga−/−) mice; Beta: n = 4 (WT) and n = 5 (Fga–/–) mice. e, Microscopy analysis of NKp46, granzyme and spike in lung after infection. NKp46: uninfected, n = 8 (WT); infected, n = 10 (WT), n = 10 (Fga−/−) and n = 9 (Fggγ390–396A) mice; granzyme: uninfected, n = 4 (WT); infected, n = 5 mice per group; spike: uninfected, n = 4 (WT); infected: n = 10 (WT), n = 10 (Fga−/−) and n = 9 (Fggγ390–396A) mice. Statistical analysis was performed using one-way ANOVA with Tukey’s multiple-comparison test (b and e) and two-sided quasi-likelihood F-test implemented in edgeR (d). In d, bold font indicates adjusted P < 0.05 (Benjamini–Hochberg). Each lane represents the average scaled z-score for each genotype. Data are mean ± s.e.m. Scale bars, 100 μm (b and e). The diagram in a was created with BioRender. Source Data
Fig. 3
Fig. 3. Fibrin suppresses NK cells and promotes SARS-CoV-2 infection.
a, Heat map of selected genes and pathways from bulk RNA-seq analysis of primary mouse NK cells stimulated with fibrin for 4 days in vitro. n = 3 mice. Each lane represents the normalized scaled expression (z score) from each individual mouse (Methods). b, Fibrin-suppressed GO term networks from bulk RNA-seq analysis of primary mouse NK cells. Each circle represents one significantly altered pathway. NES, normalized enrichment score. c, Kinase activities inferred as a z score of phosphorylated substrates from global MS phosphoproteomics analysis of NK cells isolated from PBMCs unstimulated (mock) or treated with fibrin or IL-15 for 1 h. The colours indicate an increase (red) or decrease (blue) in kinase activity. The black bounding boxes indicate a significant shift in kinase-specific substrate regulation. Statistical analysis was performed using a two-tailed z-test (unadjusted P < 0.05) based on the log2-transformed fold changes between n = 8,054 phosphorylation sites derived from 2 (mock), 3 (fibrin) and 2 (IL-15) biologically independent experiments (Methods). d, The NES of selected pathways from GSEA of fibrin-induced genes in NK cells (shown in b) and macrophages (mac.; scRNA-seq data from a previous study). e, Microscopy analysis of Mac2 and spike in the lungs of Beta-infected WT, Fga–/– and Fggγ390–396A mice given intraperitoneal injection of anti-NK1.1 or IgG2a at a dose of 8 mg per kg body weight. Nuclei were stained with DAPI (blue). Scale bars, 50 μm (Mac2) and 200 μm (spike). Uninfected: n = 4 WT mice; Beta infected: n = 5 mice per group. Statistical analysis was performed using two-way ANOVA with Tukey’s multiple-comparison test. Data are mean ± s.e.m. Source Data
Fig. 4
Fig. 4. Fibrin drives infection-independent SARS-CoV-2 pathology.
a, Lung pathology from spike PV i.v. administration in WT, Fga−/− and Fggγ390–396A mice. The diagram was created using BioRender. b,c Mac2 and gp91phox microscopy and quantification in lungs of WT, Fga–/– and Fggγ390–396A mice after bald or spike PV administration. n = 6 mice per group. Statistical analysis was performed using two-tailed Welch two-sample t-tests followed by multiple-correction testing using the Holm procedure. Data are mean ± s.e.m. Scale bars, 50 µm (b and c). Source Data
Fig. 5
Fig. 5. Anti-fibrin antibody provides protection against SARS-CoV-2.
a, Beta infection of 5B8-treated WT mice. b,c, Lung pathology in WT mice prophylactically treated with 5B8 or IgG2b (n = 5 (Trichrome, N protein); n = 10 (Mac2, gp91phox, spike, granzyme)) at 3 d.p.i. (b) or therapeutically treated with 5B8 (n = 11) or IgG2b (n = 12) (Mac2 and gp91phox) at 7 d.p.i. (c). d, Beta infection of WT, Fga−/− and Fggγ390–396A mice or 5B8-treated WT mice at 7 d.p.i. e, Fibrinogen and IBA1 in the cortex, representative of four Beta-infected WT mice. f, IBA1 in the hippocampus. UI: n = 6 mice; Beta infected, prophylactic: n = 10 (prophylactic 5B8 or IgG2b) mice per group; Beta infected, therapeutic: n = 12 (IgG2b) and n = 11 (5B8) mice. g, IBA1 and CD68 in the hippocampus. Uninfected: n = 6 WT mice; Beta infected, n = 6 (WT), n = 6 (Fga−/−) or n = 5 (Fggγ390–396A) mice. h, Delta infection of 5B8-treated K18-hACE2 mice. i, Fibrinogen and IBA1 in various brain regions of uninfected and Delta-infected mice at 3 d.p.i. Uninfected: n = 4 (hippocampus (Hippo)) and n = 5 (corpus callosum (Cc), striatum (Str) and frontal cortex (FCtx)) mice; Delta infected: n = 4 (frontal cortex) and n = 5 (hippocampus, corpus callosum, striatum) mice. j,k, IBA1, CD68, calbindin and NeuN in the cortex (j) and hippocampus (k). Uninfected: n = 5 mice; Delta infected, prophylactic, 3 d.p.i.: n = 5 (IgG2b) or n = 4 (5B8) mice; Delta infected, therapeutic, 9 d.p.i.: n = 6 mice per group. l, Mouse survival and weight. n = 12 mice per group (therapeutic, 5B8 or IgG2b, Delta infected). Statistical analysis was performed using log-rank tests (survival) and a mixed-effects model (weight). m, Significantly altered genes in the hippocampus of Delta-infected mice given 5B8 or IgG2b. n = 6 mice per group. Statistical analysis was performed using two-sided unpaired t-tests (unadjusted P < 0.05; Methods). For af and hm, 5B8 or IgG2b was given intraperitoneally at a dose of 30 mg per kg body weight, prophylactically (at 0 d.p.i.) or therapeutically (at 1 d.p.i.). Statistical analysis was performed using two-tailed Mann–Whitney U-tests (b (all except for granzyme) and c), two-tailed Welch t-tests with Holm multiple-comparison correction (b (granzyme) and i) and one-way ANOVA Tukey’s multiple-comparison test (f, g, j and k). Data are mean ± s.e.m. Scale bars, 100 μm (b, c, e, j and i) or 50 μm (f, g and k). The diagrams in a, d and h were created using BioRender. Source Data
Extended Data Fig. 1
Extended Data Fig. 1. Fibrin interaction and colocalization with Spike.
a, Binding ELISA of Spike S1(N501Y) to fibrin. Dissociation constants (Kd). Representative curvefits from two independent biological experiments in duplicates. b, Spike overlap with perivascular fibrin(ogen) deposition in lung of Beta-infected WT mice at 3 d.p.i. The 51% of the calculated proportion of fibrin that colocalizes with Spike protein is significantly higher than the 23% predicted if the correlation were random. Fisher’s exact test (two-tailed); n = 78 images from 5 mice (Methods). Representative confocal images are shown. Scale bar, 200 μm. c, Scatter plot of positive correlation of fibrinogen and Spike immunoreactivity in n = 78 images from 5 mice, Pearson correlation two-tailed (Methods). d. 3D reconstruction of light sheet acquisitions of whole lung tissue from an Alexa546-fibrinogen and Alexa647-Spike S1(N501Y)-injected WT mouse following 3DISCO tissue clearing. Two representative focal fibrinogen deposits from n = 3 mice were selected for 3D visualization. Volumetric rendering reveals close interactions between fibrinogen deposits (green) and trimeric spike (magenta), confirming colocalization. Scale bars, 100 μm (top), 300 μm (bottom). e, Fibrinogen crystal structure (PDB: 3GHG) with mapped peptides (red). Proximity of peptides γ163-181 and γ364-395 (inset). f, Peptide array mapping with immobilized peptides of SARS-CoV-2 Spike blotted with fibrinogen and fibrinogen γ chain. Heatmap of signal intensity showing binding sites (white-orange) within the S1-NT Spike domain. Key indicates fluorescence intensities signal values from low (white) to high (orange). Schematic indicating Spike domains and amino acid sequence. Source Data
Extended Data Fig. 2
Extended Data Fig. 2. Computational modelling of fibrinogen-Spike protein interactions.
a, Predicted computational complex model using crystal structure of fibrinogen (PDB ID: 3GHG) and cryoEM structure of Spike (PDB ID: 6VSB). b, Surface of this complex. c, Schematic representation of intermolecular interface of this predicted model. d, 3D representation of interface shown by side chain of the few residues involved in interaction. e, Intermolecular interface showing atom-wise interaction with all the residues involved in the interaction including a hydrogen bond highlighted in green dashed line using LigPlot +, v.2.2. https://www.ebi.ac.uk/thornton-srv/software/LigPlus/.
Extended Data Fig. 3
Extended Data Fig. 3. Fibrin clot ultrastructure and Spike protein interactions.
a, Topographic visualization of fibrin fibre surface in SEM images of fibrin clots in healthy human donor plasma in the presence of Spike. b, SEM of fibrin clots in human plasma in the presence of Spike. x4000 magnification. Images representative of n = 3 independent biological replicates quantified in (c) and Fig. 1f. c, Fibre radius proportion less than 0.05 µm (boxplot) and intersection density (bar plot) in plasma or plasma with Spike. Generalized linear mixed effects model (boxplot) and two-sample two-sided Welch t-test (bar plot). n = 25 (plasma), n = 28 (plasma with Spike) images from n = 3 biologically independent experiments quantified in Fig. 1f. Images from biologically independent experiments are indicated by different colour dots in boxplot. Box indicates the interquartile range (IQR) and whiskers denote the 1.5 × IQR. d, Alanine scan mutagenesis peptide array. Fibrin peptide γ377-395 was subjected to double-alanine scanning mutagenesis and incubated with His-tagged recombinant Spike. Signal intensity bar graph of the binding of Spike to sequential Ala-Ala substituted peptides (red). Control signal is shown in blue. Residues with low signal intensity upon Ala-Ala substitution are required for binding and highlighted in yellow. e. ELISA of 5B8-huFc or huIgG1 isotype control pre-incubated with fibrin versus the Spike for binding to fibrin. Data are mean ± s.e.m from three biologically independent experiments. f. Iba-1 immunoreactivity in brain following stereotaxic co-injection of fibrinogen with PBS or Spike in WT mice. Scale bar, 50 µm. Data are from n = 6 mice per group. One-way ANOVA with Tukey’s multiple comparisons test. All data are mean ± s.e.m. Source Data
Extended Data Fig. 4
Extended Data Fig. 4. Lung microscopy from SARS-CoV-2 infection.
a, Microscopy of hematoxylin and eosin staining from lung of WT, Fga–/– and Fggγ390–396A mice after Beta infection or uninfected (UI) WT mice. Representative images from UI n = 4; Infected, WT n = 5, Fga–/– n = 5 and Fggγ390–396A n = 4 mice. Scale bar, 200 μm b, Microscopy of fibrin(ogen) (red), Spike (green), Mac-2 (green), and gp91-phox (red) immunoreactivity in the lung from UI mice. Nuclei are stained with DAPI (blue). Scale bar, 70 μm. Representative images from n = 3 mice per group. c, Microscopy for 4-HNE in lung from UI n = 5 and Beta-infected n = 5 WT, n = 5 Fga–/–, n = 4 Fggγ390–396A mice. One-way ANOVA with Tukey’s multiple comparisons test. All data are mean ± s.e.m. Scale bars, 100 μm. Source Data
Extended Data Fig. 5
Extended Data Fig. 5. Suppression of the human type I interferon network in Fga/ mice after SARS-CoV-2 infection.
Overlay of the differentially expressed genes in the lung from Beta-infected Fga–/–mice on the “Type I interferon induction and signalling during SARS-CoV-2 infection - Homo sapiens” pathway. Gene nodes are coloured with red-blue gradient to indicate degree of log2 fold change in gene expression between WT and Fga/ mice. Red borders indicate statistical significance of unadjusted P < 0.05 calculated by two-sided quasi-likelihood F-test implemented in edgeR. https://new.wikipathways.org/pathways/WP4868.html.
Extended Data Fig. 6
Extended Data Fig. 6. Lung pathology and viral titers after SARS-CoV-2 infection.
a, Microscopy of NK1.1 in lung after Beta-infection at 3 d.p.i. n = 5 mice per group. b, Microscopy of N protein in lung after infection at 3 d.p.i; Infected, n =5 WT, n = 5 Fga–/–, n = 4 Fggγ390-396A mice. c, Box-and-whisker plots showing the number of PFUs propagated from lung homogenates of infected animals on Vero cells. PFU/ml from lung homogenates of Beta-infected n = 10 WT, n = 10 Fga/ and n = 9 Fggγ390–396A mice at 3 d.p.i. P values shown by Welch two-sample two-sided t-test followed by multiple correction testing using the Holm procedure. Box indicates the interquartile range (IQR) and whiskers denote the 1.5 × IQR. a, b, One-way ANOVA with Tukey’s multiple comparisons test. All data are mean ± s.e.m. Scale bars, 100 μm. Source Data
Extended Data Fig. 7
Extended Data Fig. 7. NK cell responses to fibrin stimulation.
a, Volcano plots of DEGs from bulk RNA-seq of fibrin-stimulated mouse primary NK cells for four days. n = 3 mice per group. The cutoffs were Log2 fold change > 0.25, adjusted P (FDR) < 0.1 by two-sided quasi-likelihood F-test in edgeR with the Benjamini-Hochberg method. b, Differential phosphorylation site intensities between Fibrin- and IL-15-treated NK cells isolated from PBMCs. Phosphorylation sites grouped based on upstream kinases annotated in the OmniPath network database of kinase-substrate relationships. Red boxes indicate a significant shift in kinase-specific substrate regulation. Unadjusted P < 0.05 calculated from log2 fold changes of n = 8,054 phosphorylation sites between conditions derived from 2 (mock), 3 (fibrin) and 2 (IL-15) biologically independent experiments (two-tailed z-test, Methods). Box indicates the interquartile range (IQR) and whiskers denote the 1.5 × IQR. c, Downregulated network of phosphoproteomic interaction in fibrin-treated human NK cells for 1 h compared to IL-15. Colour of kinase represents z-score of kinase activity and colour of substrates represents log2FC (Methods). d, Flow cytometry of mouse NK cells fibrin-stimulated for four days. Ki-67 (%), granzyme B (MFI) and IFN-γ (MFI), n = 8 mice per group. Two-tailed paired Student’s t-test. e, Flow cytometry of fibrin-stimulated mouse NK cells for four days at concentrations indicated. NKp46 (MFI), NKG2D (MFI). n = 4 mice per group. One-way ANOVA with post-hoc analysis by Sidak’s multiple comparisons. Data are mean ± s.e.m. f, Flow cytometry of NK cells fibrin-stimulated for 1, 2, and 4 days. NKG2D (MFI), CD54 (MFI), NKp46 (MFI), and granzyme B (%). n = 4 mice per group. Two-tailed paired Student’s t-test. g, Kinase activities inferred from global mass spectrometry phosphoproteomics of NK cells and macrophages (data from Mendiola et al.) unstimulated (Mock) or Fibrin-treated for 1 h. Gating strategy is shown in Supplementary Fig. 2. Source Data
Extended Data Fig. 8
Extended Data Fig. 8. NK cell depletion in vivo.
a-d, Microscopy of granzyme, 4-HNE, N protein and gp91-phox in lung from Beta-infected WT, Fga–/–, and Fggγ390-396A mice given anti-NK1.1 or IgG2a n = 5 mice per group. Uninfected (UI), n = 4 mice. Scale bars, 50 μm (a, d), 200 μm (b, c). a-c, Welch two-sample t-test (two-sided) followed by multiple correction testing using the Holm procedure. Unadjusted P values (b). d, Two-way ANOVA with Tukey multiple comparison correction. All data are mean ± s.e.m. Source Data
Extended Data Fig. 9
Extended Data Fig. 9. Production of PVs and in vivo characterization.
a, Spike PV production (Methods). b, Immunoblot of Spike expression in PVs blotted with anti-Spike, anti-p24 Gag (detecting p55) and anti-Vpr. Spike PVs expressed S1, S2, cleaved S1 and Spike multimeric forms. PVs express comparable levels of the proviral backbone indicated by HIV Env VPs (Vpr). c, Fibrinogen immunoprecipitation with PVs blotted with anti-Spike or anti-fibrinogen. d, ROS production in fibrin-stimulated BMDMs (24 h) with PVs. n = 3 biologically independent experiments. e, Fibrin(ogen) from lungs of n = 6 WT mice per group 24 h after PV injection. Scale bars, 200 µm and 50 µm (inset). Welch two-sample t-test (two-tailed) followed by Holm multiple correction testing. f. Confocal microscopy of Spike (green) and fibrin(ogen) (red) in lung 24 h after Spike PVs injection; orthogonal views of the y/z and x/z planes show the localization of fibrinogen and Spike. Scale bar, 50 μm. Scatter plot shows correlation of fibrinogen and Spike in n = 24 images from three mice, Pearson correlation (Methods). g, gp91-phox (red) and Mac-2 (green) in lungs 24 h after injection of n = 6 mice (Bald, Spike or HIV-ENV PVs) and n = 3 uninjected controls (UI). Scale bars, 100 μm. h, Mac-2 (green) and gp91-phox (red) in lungs from WT and Fga–/– mice after Bald PVs injection. Scale bar, 70 μm. Representative images from n = 6 mice per group. Quantification in Fig. 4c. i, Iba-1 in corpus callosum after stereotactic co-injection of fibrinogen with PBS, Bald PVs or Spike PVs. Scale bar, 50 µm. n = 6 mice per group. Representative immunoblots from two (b) or three (c) biologically independent experiments. d, g, i, One-way ANOVA with Tukey’s multiple comparisons test. All data are mean ± s.e.m. For gel source data, see Supplementary Fig. 1. Source Data
Extended Data Fig. 10
Extended Data Fig. 10. 5B8 target engagement in the brain and effects on lung pathology in Beta infection.
a, Microscopy of fibrinogen and NK1.1 in lungs from prophylactic 5B8- and IgG2b-treated Beta-infected WT mice 3 d.p.i. Scale bars, 100 μm. Infected, n = 10 mice per group; uninfected (UI), n = 4 mice. Two-tailed Mann-Whitney test (fibrin(ogen)), one-way ANOVA with Tukey multiple comparisons (NK1.1). b, Box-and-whisker plots showing the number of PFUs propagated from lung homogenates of infected animals on Vero cells at 3 d.p.i. PFU/ml from lung homogenates of Beta-infected WT mice given prophylactically 5B8 or IgG2b. n = 10 per group. Two-tailed Mann-Whitney. Box indicates the interquartile range (IQR) and whiskers denote the 1.5 × IQR. c, Microscopy of 4-HNE in lungs from therapeutic 5B8- and IgG2b-treated WT mice after Beta infection at 7 d.p.i. Scale bars, 100 μm. n  = 12 (IgG2b) or n = 11 (5B8). Two-tailed Mann-Whitney test. d, Microscopy of brain sections from Beta-infected WT (left) and UI control (right) given i.p. injection of 30 mg/kg 5B8-huFc showing the spatial co-localization (yellow) between 5B8-huFc detected with FITC-human IgG (green), and fibrin deposition detected with antibody to fibrin(ogen) (red) at 7 d.p.i. The 5B8-huFc antibody was used in target engagement studies to enable in vivo detection in the mouse by human FITC-IgG. Scale bars, 80 μm. Data are representative of n = 3 mice. All data are mean ± s.e.m. Source Data
Extended Data Fig. 11
Extended Data Fig. 11. Disease-associated genes in microglia in Delta-infected mice.
a, Representative RNAscope images of Trem2, Cst7, and Spp1 (red) mRNA expression in Iba-1 immunoreactive microglia (green) within the hippocampus of Delta-infected K18-hACE2 mice. b, Quantification of Trem2, Cst7, and Spp1 mRNA expression as percentage of total Iba-1+ cells in the hippocampus. Data are from n = 5 mice per group. Two-tailed Mann-Whitney test. Scale bars, 20 μm. All data are mean ± s.e.m. UI, uninfected. Source Data
Extended Data Fig. 12
Extended Data Fig. 12. Fibrin-targeting immunotherapy protects from SARS-CoV-2 Spike neuroinflammation.
a, Confocal microscopy of fibrin(ogen) and MBP in brains from Delta-infected K18-hACE2 mice at 3 d.p.i. Representative images from five mice per group. UI, uninfected. Delta-infected K18-hACE2 mice were given IgG2b isotype control. Scale bar, 60 μm. b, Box-and-whisker plots showing the number of PFUs propagated from lung homogenates of infected animals on Vero cells at 3 d.p.i. PFU/ml from lung homogenates of Delta-infected K18-hACE2 mice given prophylactically 5B8 (n = 4) or IgG2b (n = 5). Two-tailed Mann-Whitney. Box indicates the interquartile range (IQR) and whiskers denote the 1.5 × IQR. c, Confocal microscopy of Iba-1 and Iba-1 and MBP in brains from Delta-infected K18-hACE2 mice treated prophylactically with 5B8 or IgG2b. Scale bars, 50 μm (top) and 100 μm (bottom). UI, n = 5 mice; infected, 5B8 n = 4 mice and IgG2b n = 5 (MBP), n = 4 (Iba-1) mice. One-way ANOVA with Tukey’s multiple comparisons test or two-tailed Mann-Whitney test. d, Confocal microscopy of Iba-1 immunoreactivity in cortex from Delta-infected K18-hACE2 mice treated prophylactically with 5B8 or IgG2b. Representative images from five uninfected and four infected mice per group. Right-most image shows magnification of the white box. Scale bar, 100 μm; 50 μm (inset). e, GSEA analysis of the top 20 down-regulated pathways in brain tissues at 9 d.p.i from Delta-infected K18-ACE2 mice treated therapeutically with 5B8 versus IgG2b, starting at 1 d.p.i then every 2 days for 8 days. f, Microscopy of Mac-2 and gp91-phox in lungs from Spike PV-injected WT mice at 24 h given prophylactically 5B8 or IgG2b. Scale bars, 50 μm. n = 6 mice per group. Two-tailed Mann-Whitney test. All data are mean ± s.e.m. Source Data

Comment in

  • Targeting fibrin in COVID-19.
    Crunkhorn S. Crunkhorn S. Nat Rev Drug Discov. 2024 Nov;23(11):816. doi: 10.1038/d41573-024-00159-4. Nat Rev Drug Discov. 2024. PMID: 39333711 No abstract available.

References

    1. Conway, E. M. et al. Understanding COVID-19-associated coagulopathy. Nat. Rev. Immunol.22, 639–649 (2022). - PMC - PubMed
    1. Monje, M. & Iwasaki, A. The neurobiology of long COVID. Neuron110, 3484–3496 (2022). - PMC - PubMed
    1. Spudich, S. & Nath, A. Nervous system consequences of COVID-19. Science375, 267–269 (2022). - PubMed
    1. Al-Aly, Z. & Topol, E. Solving the puzzle of Long Covid. Science383, 830–832 (2024). - PubMed
    1. Taquet, M. et al. Acute blood biomarker profiles predict cognitive deficits 6 and 12 months after COVID-19 hospitalization. Nat. Med.29, 2498–2508 (2023). - PMC - PubMed

MeSH terms

Supplementary concepts