. 2024 Sep;633(8030):670-677.
doi: 10.1038/s41586-024-07862-7. Epub 2024 Aug 28.

Fate induction in CD8 CAR T cells through asymmetric cell division

Affiliations

Fate induction in CD8 CAR T cells through asymmetric cell division

Casey S Lee et al. Nature. 2024 Sep.

Abstract

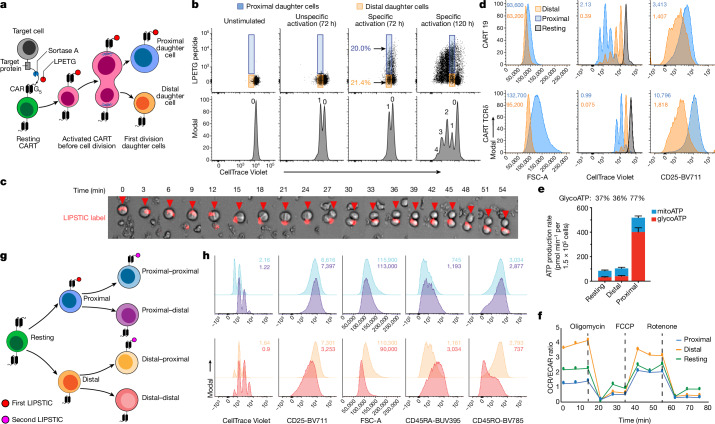
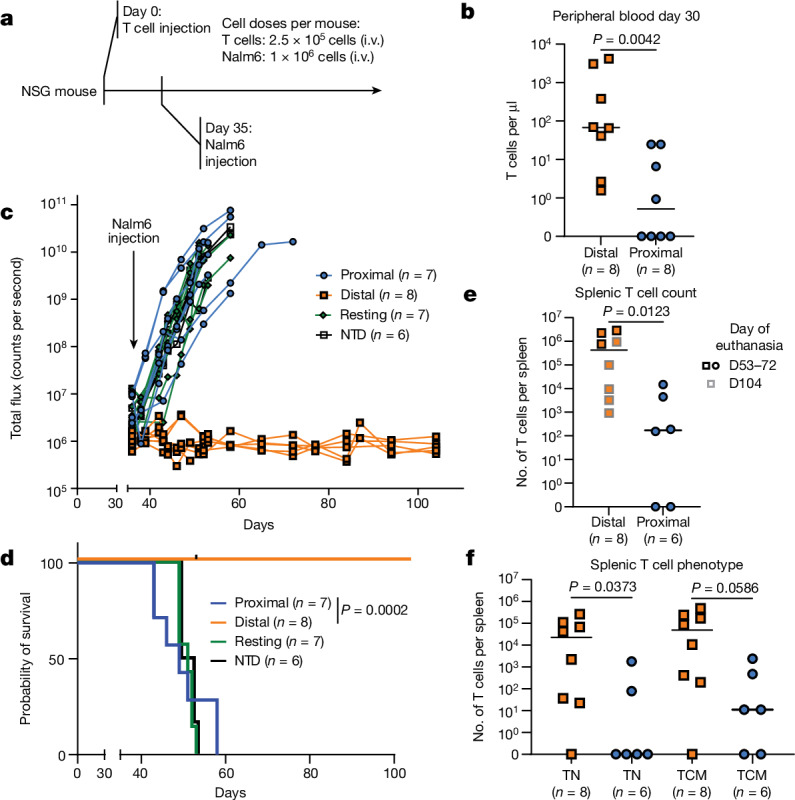
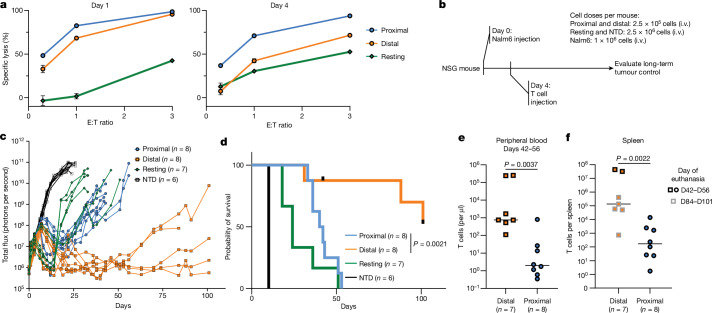
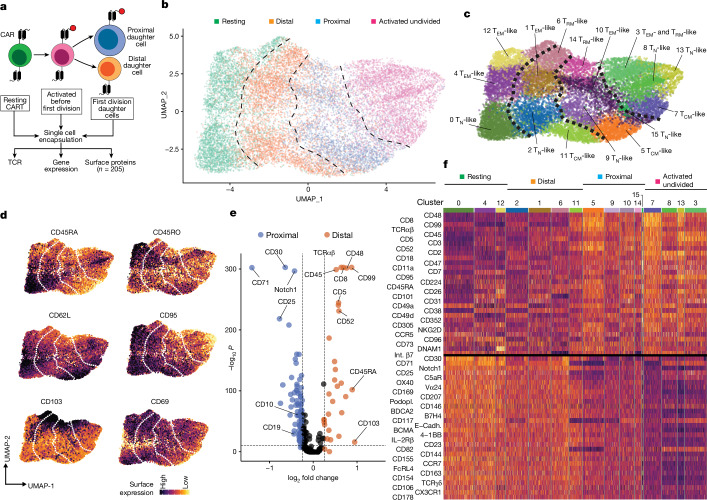
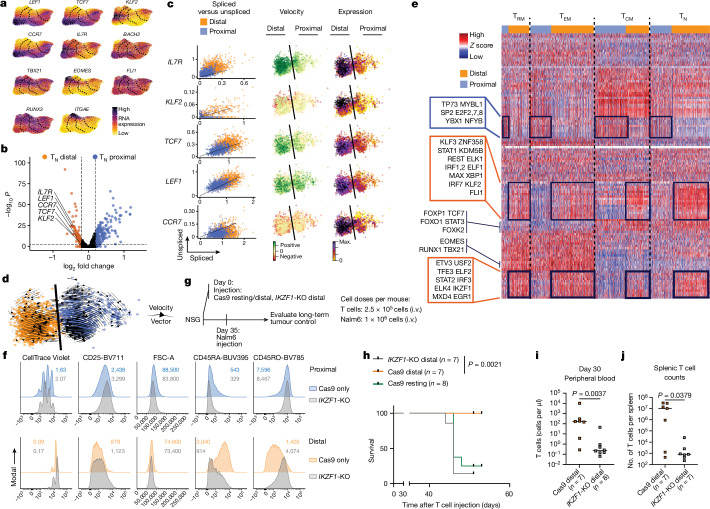
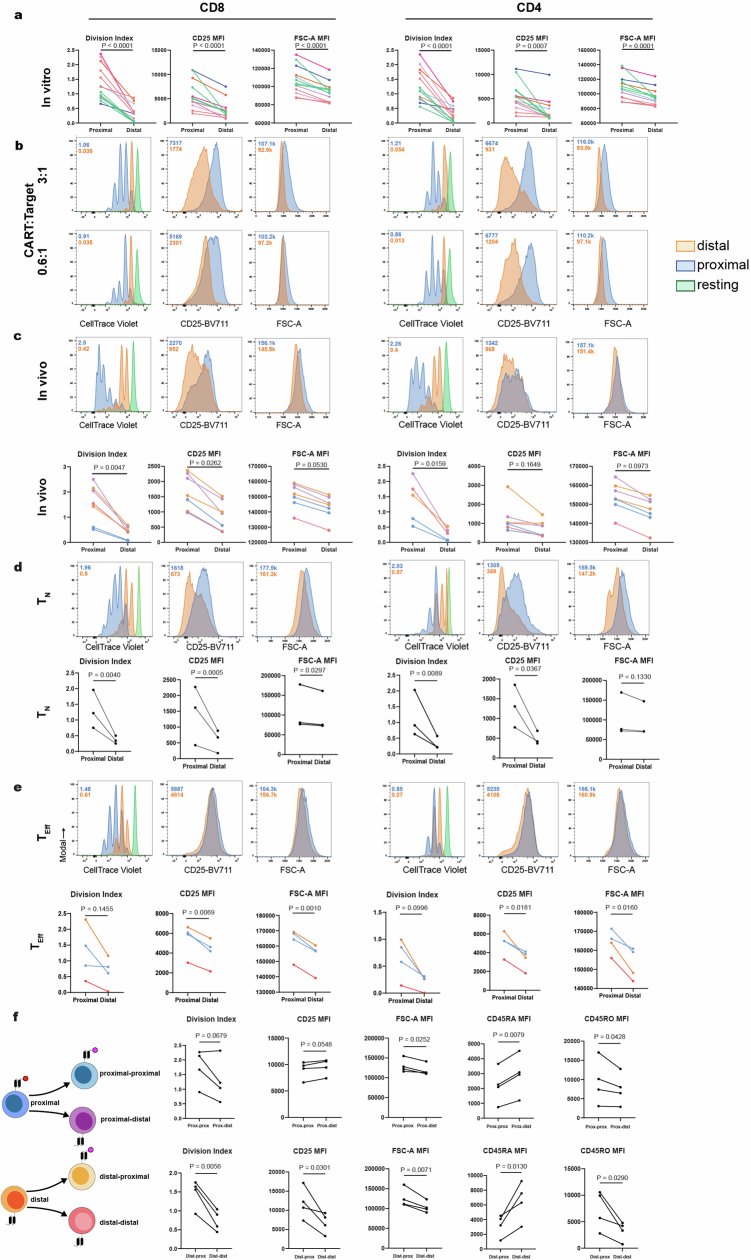
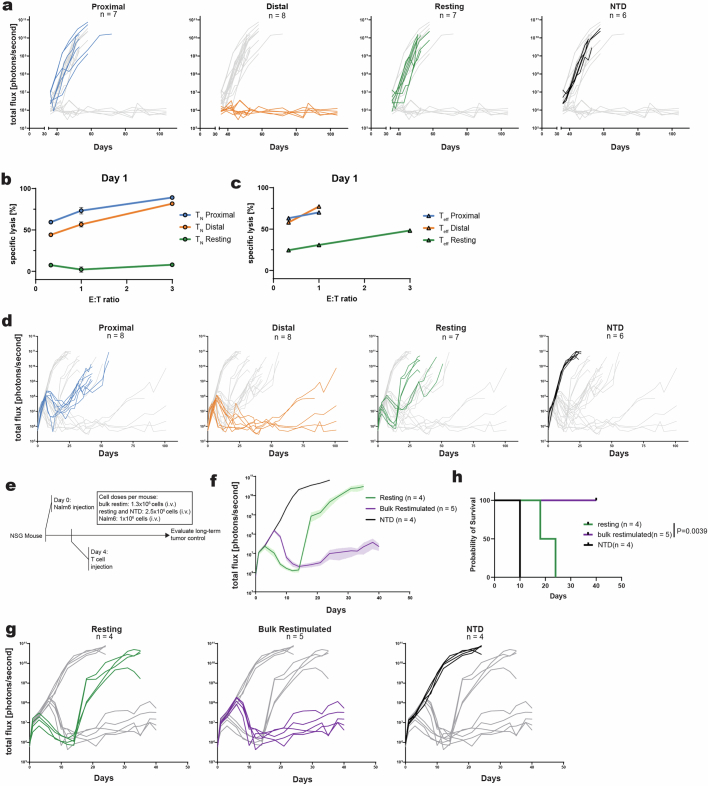
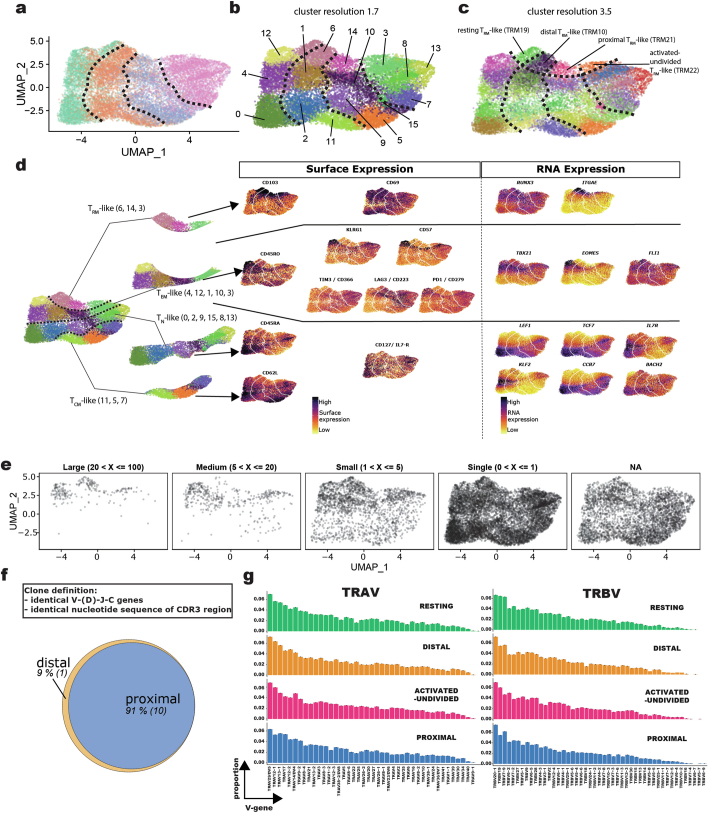
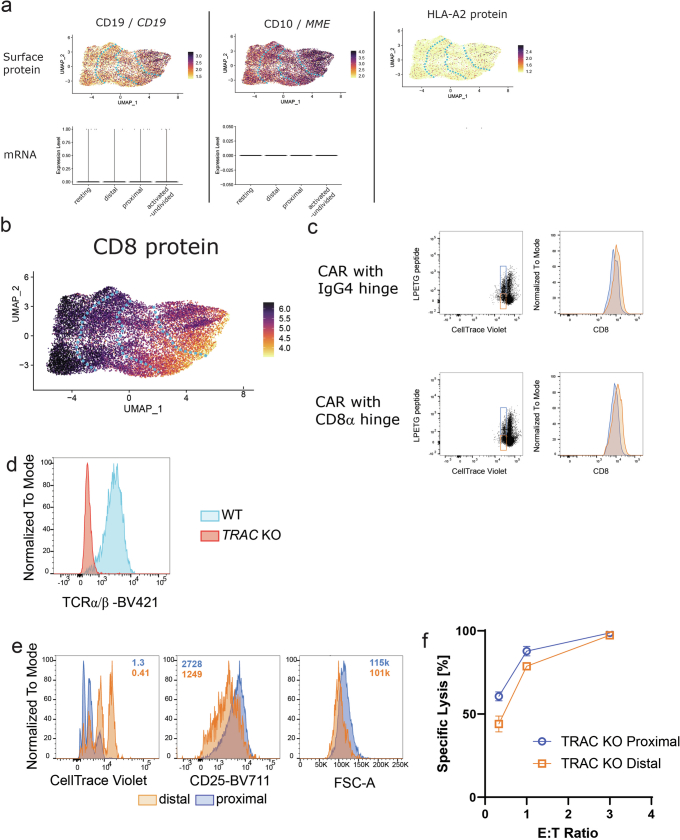
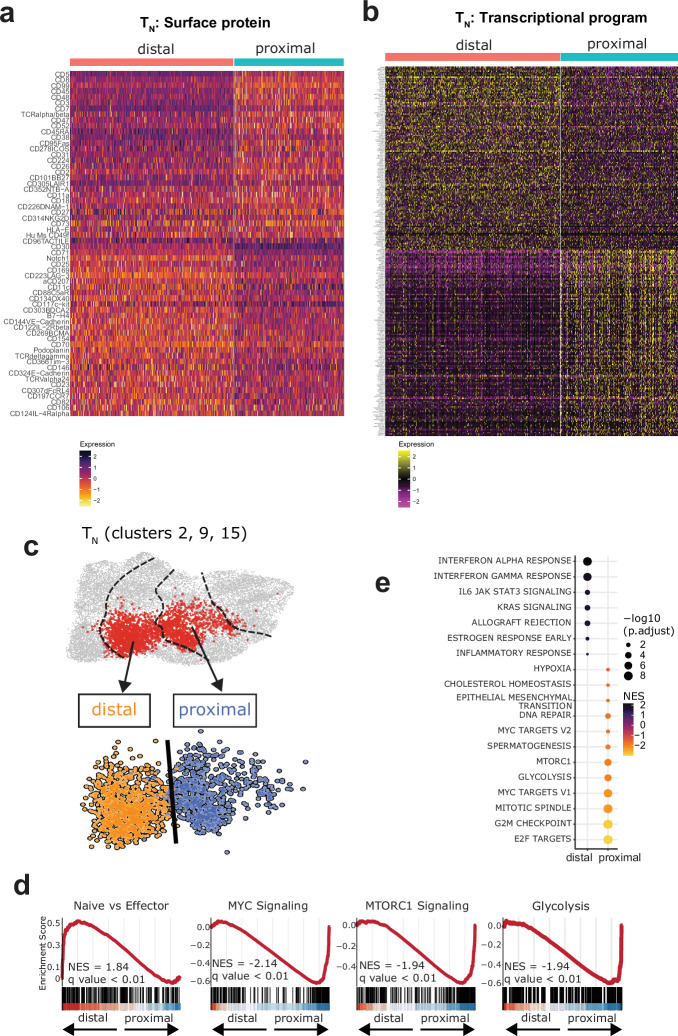
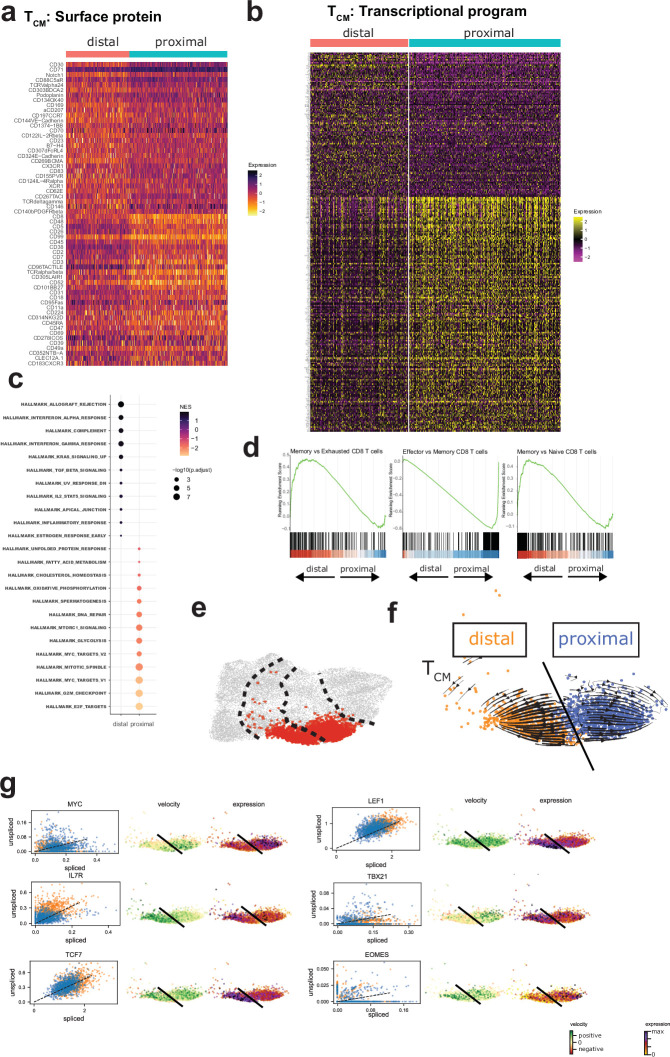
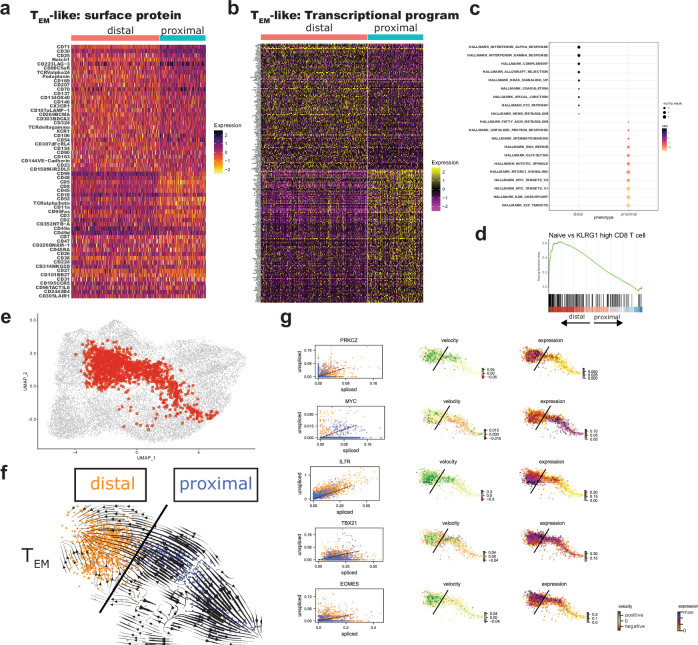
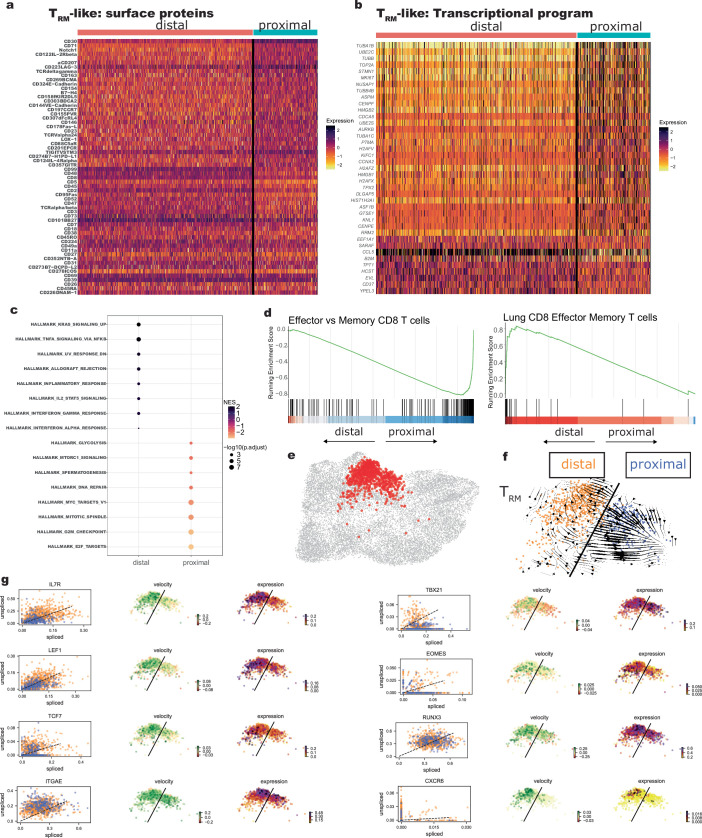
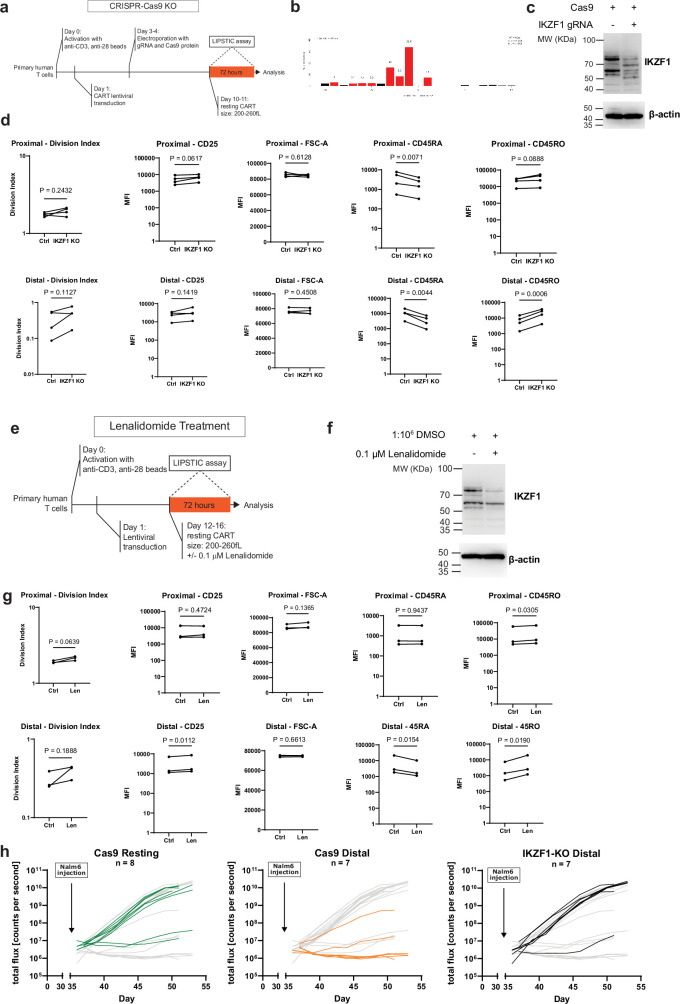
Early expansion and long-term persistence predict efficacy of chimeric antigen receptor T cells (CARTs)1-7, but mechanisms governing effector versus memory CART differentiation and whether asymmetric cell division induces differential fates in human CARTs remain unclear. Here we show that target-induced proximity labelling enables isolation of first-division proximal-daughter and distal-daughter CD8 CARTs that asymmetrically distribute their surface proteome and transcriptome, resulting in divergent fates. Target-engaged CARs remain on proximal daughters, which inherit a surface proteome resembling activated-undivided CARTs, whereas the endogenous T cell receptor and CD8 enrich on distal daughters, whose surface proteome resembles resting CARTs, correlating with glycolytic and oxidative metabolism, respectively. Despite memory-precursor phenotype and in vivo longevity, distal daughters demonstrate transient potent cytolytic activity similar to proximal daughters, uncovering an effector-like state in distal daughters destined to become memory CARTs. Both partitioning of pre-existing transcripts and changes in RNA velocity contribute to asymmetry of fate-determining factors, resulting in diametrically opposed transcriptional trajectories. Independent of naive, memory or effector surface immunophenotype, proximal-daughter CARTs use core sets of transcription factors known to support proliferation and effector function. Conversely, transcription factors enriched in distal daughters restrain differentiation and promote longevity, evidenced by diminished long-term in vivo persistence and function of distal-daughter CARTs after IKZF1 disruption. These studies establish asymmetric cell division as a framework for understanding mechanisms of CART differentiation and improving therapeutic outcomes.


Conflict of interest statement

C.T.E.—equity (Cabaletta Bio), patent licensing (Cabaletta Bio, Novartis). A.S.P.—equity, payments, research grants (Cabaletta Bio), patent licensing (Cabaletta Bio, Novartis), consultant (Janssen). S.O.—patent licensing (Cabaletta Bio). R.O.C.—equity (Nucleus Biologics), research grant (NeoTx) and patent licensing (Novartis). The remaining authors declare no competing interests.

Figures

Fig. 1
Fig. 1. LIPSTIC distinguishes first-division proximal and distal-daughter CARTs.
a, Schematic for the LIPSTIC assay to discriminate first-division proximal- and distal-daughter CARTs. G5, N-terminal pentaglycine tag. b, Representative flow cytometry plot of LIPSTIC labelling and cell division following activation. Unstimulated indicates donor-matched CARTs cultured without target cells. Unspecific activation indicates anti-CD3/anti-CD28 beads, versus specific activation through the CAR by LPETG-labelled target Nalm6 cells. Gating strategy in Extended Data Fig. 2g. c, LPETG label (red) retention on one daughter CART cell following first cell division after specific activation; photographs were acquired every 3 min. d, Representative flow cytometry histograms of bulk anti-CD19 and anti-TCRδ CARTs 3 days after isolating first-division daughter cells from in vitro coincubation. e, ATP production rate of sorted first-division proximal- and distal-daughter bulk CARTs comparing mitochondrial (mitoATP) to glycolytic (glycoATP) ATP production. Error bars indicate mean + standard deviation from four replicates for resting and distal and five replicates for proximal. f, Oxygen consumption rate (OCR)/extracellular acidification rate (ECAR) ratio of resting and sorted proximal- and distal-daughter CD8 CARTs. g,h, First-division distal-daughter CARTs show ACD following second target encounter. g, Schematic of isolating second-division daughter CARTs after second target engagement. h, Representative flow cytometry histograms of CD8 CART progeny 2 days after second-division daughter cell isolation. Median fluorescence intensity or division index is shown in the histogram plots (d,h). Plots are representative of 2–5 independent experiments with CARTs from distinct donors. Source Data
Fig. 2
Fig. 2. Distal-daughter CARTs show superior in vivo functional persistence.
a, NSG mice are injected with proximal-daughter CARTs, distal-daughter CARTs, resting CARTs or non-transduced (NTD) T cells and subsequently challenged with Nalm6 cells 35 days later. b, Peripheral blood T cell count on 30 days after T cell injection. Lines represent the medians. c, Bioluminescence imaging quantification of Nalm6 cells in NSG mice. d, Kaplan–Meier survival curve. Dashes indicate censored data. e,f, Splenic T cell counts. Lines represent the medians. e, Total splenic T cell counts. f, Splenic counts by TCM (CD62L+CD45RA) and TN (CD62L+CD45RA+) phenotype. Data pooled from three independent experiments with distinct donors (n = 6–8 mice per condition). Statistical significance was determined using a log-rank test (d) and two-tailed Mann–Whitney test (b,e,f). i.v., intravenous. Source Data
Fig. 3
Fig. 3. First-division daughter CARTs demonstrate distinct patterns of cytotoxic activity and in vivo leukaemia control.
a, Twenty-hour in vitro cytotoxicity assay data performed 1 day (left) or 4 days (right) after first-division daughter cell isolation. Data points represent the mean of triplicates and error bars represent standard error of the mean. E:T, effector:target ratio. b, CARTs are injected into Nalm6-bearing NSG mice 4 days after engraftment. c, Bioluminescence imaging quantification of Nalm6 cells in NSG mice. d, Kaplan–Meier survival curve. Dashes indicate censored data. e, Peripheral blood T cell count on days 42–56 after Nalm6 injection. Lines represent the medians. f, Total splenic T cell counts. Lines represent the medians. Data pooled from three independent experiments with distinct donors (n = 6–8 mice per condition). Statistical significance was determined using a log-rank test in d and two-tailed Mann–Whitney test in e,f. Source Data
Fig. 4
Fig. 4. Proximal-daughter and distal-daughter CD8 CARTs show asymmetry in surface protein expression.
a, Schematic for single-cell proteomic, transcriptomic and TCR analysis of first-division daughter, resting and activated CD8 CARTs before first cell division. b,c, UMAP plot using surface protein expression coloured by LIPSTIC assay cell population (b) and unsupervised clustering with cluster assignments made using a combination of transcriptional activity and surface proteins (c) as in Extended Data Fig. 5d. Dashed lines indicate borders between proximal, distal, resting and activated-undivided CARTs. d, Normalized single-cell surface protein levels. e, Volcano plot illustrating differentially abundant surface proteins on proximal-daughter and distal-daughter CARTs. The dashed lines denote cut-offs defined by isotype controls (log2 fold change 0.25; adjusted P value 10−11). f, Heat map of normalized surface protein levels showing the top 30 proteins enriched in either distal (top half) or proximal (bottom half) daughter CARTs in comparison to resting and activated-undivided CARTs. The top colour bar refers to clusters in c. Plots are representative of two independent experiments using the anti-CD19 CARTs and anti-TCRδ CARTs from distinct donors. Statistical significance was determined using two-tailed Wilcoxon rank-sum test with Benjamini–Hochberg correction for multiple comparisons (e).
Fig. 5
Fig. 5. Proximal-daughter and distal-daughter CD8 CART fates are driven by divergent transcriptional programmes.
a, Normalized single-cell gene expression levels. b, Volcano plot illustrating differentially expressed genes in CD8 TN daughter CARTs. Dashed lines indicate cut-offs for log2 fold change and −log10P. c, Gene-specific RNA velocity shown as spliced or unspliced transcripts (left column) and projected onto TN-like UMAP clusters from Extended Data Fig. 7c (middle column) in comparison to normalized gene expression levels (right column). d, Velocity vector projection onto TN-like UMAP clusters. The black line signifies border between distal (orange) and proximal (blue) cells. e, Heat map of single-cell regulon activity of bulk CD8 CARTs; the top colour bar referencing proximal and distal cells separated by T cell subset assignment (from Extended Data Fig. 5). The blue box shows the shared transcription factor set with increased activity in proximal daughters; orange boxes show the shared transcription factor set with increased activity in distal daughters. f, Flow cytometry histogram plots of CD8 proximal-daughter (top) and distal-daughter (bottom) IKZF1-knockout (KO) and wild-type CARTs. Median fluorescence intensity or division index is shown in the histogram plots. g, NSG mice are injected with IKZF1-KO distal, wild-type distal and wild-type resting CARTs and subsequently challenged with Nalm6 cells 35 days later. h, Kaplan–Meier survival curve. Dashes represent censored data. i, Peripheral blood T cell count on 30 days after T cell injection. Lines represent the medians. j, Total splenic T cell count. Lines represent the medians. af Representative of two independent experiments using the anti-CD19 CARTs and anti-TCRδ CARTs from distinct donors. f, Representative of three independent experiments with summary plots in Extended Data Fig. 11d. hj, Data pooled from two experiments with distinct donors (n = 7–8 mice per condition). Statistical significance was determined using a two-tailed Wilcoxon rank-sum test with Benjamini–Hochberg correction for multiple comparisons (b), log-rank test (h) and two-tailed Mann–Whitney test (i,j). Source Data
Extended Data Fig. 1
Extended Data Fig. 1. Schematics of CAR and target protein lentiviral constructs.
a, N-terminal pentaglycine (G5) anti-CD19 CAR (clone FMC63). b, N-terminal pentaglycine anti-TCRδ CAR (clone: 5A6.E9). c, Sortase-A linked CD19. d-f, Sortase-A linked TCRγ with TCRδ (d); CD3δ and CD3γ (e); and CD3ζ and CD3ε (f) for generating sortase-A linked γδ TCR target cells. g, Nucleotide and amino acid sequence of the N-terminus of CAR constructs showing the signal peptide, pentaglycine tag, and N-terminal portion of the anti-CD19 scFv. Gray rectangle indicates start of mature protein sequence. h, Schematic of sortase-A linked target protein; gray rectangle indicates mature protein. i, Representative flow staining of surface G5 anti-CD19 CAR and G5 anti-TCRδ CAR. LTR, long terminal repeat; scFv, single chain variable fragment; WHV PRE, woodchuck hepatitis virus post-transcriptional regulatory element; SrtA, sortase-A. Sequences of displayed constructs can be found in Supplementary Table 1.
Extended Data Fig. 2
Extended Data Fig. 2. Modified LIPSTIC assay specifically labels proximal-daughter CARTs using sortase-A linked target.
a, Timeline of lentivirally-transduced CART in vitro and in vivo LIPSTIC assay, electroporated CART in vitro LIPSTIC assay (for TN and TEff CART experiments), and second target encounter LIPSTIC assay. b, Comparison of previously described LIPSTIC and modified CAR-LIPSTIC protocols for specific labeling and sorting of proximal versus distal daughter CARTs. In the modified CAR-LIPSTIC approach, ligand-bearing target cells with sortase-A are incubated (‘preloaded’) with soluble biotinylated LPETG peptide, washed, and subsequently stained with streptavidin-fluorophore to detect LPETG peptides attached to sortase-A. Labeled target cells are co-incubated with CART cells, and LIPSTIC labeling of CAR molecules is analyzed by flow cytometry. c, Titration of soluble LPETG peptide concentration using the previously described LIPSTIC assay demonstrates increasing non-specific signal on nontransduced T cells and irrelevant CAR T cells with increasing LPETG peptide concentration (gated on live, singlet cells). d, Flow cytometry plots (gated on live, singlet cells) demonstrating the expression of sortase-A linked target protein (CD19 or γδTCR) and co-detection of LPETG peptide and sortase-A linked target proteins before and after LPETG peptide incubation. e, Flow cytometry plots (gated on live, singlet cells) showing increased LPETG label detection on target-specific CAR and decreased LPETG background labeling on irrelevant CAR when using the modified CAR-LIPSTIC approach compared to the previously described LIPSTIC approach. f, Flow cytometry plots demonstrating specific labeling of CAR targeting sortase-A linked target protein. Anti-CD19 and anti-γδTCR CAR T cells proliferate (determined by CellTrace Violet dilution) when coincubated with wild-type CD19- and γδTCR-sortase-expressing Nalm6 cells, but only the anti-γδTCR CAR is labeled with the LPETG peptide after coincubation. This demonstrates that LIPSTIC labeling is proximity sensitive, i.e. CART interaction with sortase-positive cells (where sortase is attached to a surface protein that is not in proximity to the CAR target) is not sufficient to label CARs; instead, the sortase enzyme has to be attached to the CAR target in order to facilitate labeling. g, Gating strategy for the discrimination of first-division proximal- and distal-daughter CARTs.
Extended Data Fig. 3
Extended Data Fig. 3. CART subsets exhibit ACD following first and second target encounter.
a-d, Representative flow cytometry histograms and summary statistics of CD8 (left) and CD4 (right) proximal-daughter and distal-daughter CART progeny 3 days after first-division daughter cell isolation. (a) Summary of in vitro LIPSTIC assays (n = 13, 8 distinct donors), (b) First-division daughters isolated after LIPSTIC assay coincubation using 3:1 or 0.6:1 CART:target ratio in vitro, (c) first-division daughters isolated after in vivo activation (n = 5 for CD4 Division Index, n = 7 for other measurements, 4 distinct donors), (d) first-division daughters isolated from CARTs generated in vitro from TN cells (n = 3 from distinct donors), (e) first-division daughters isolated from CARTs generated in vitro from Teff cells (n = 4, 3 distinct donors). f, Division index or median fluorescence intensity of CD8 proximal-proximal, proximal-distal, distal-proximal, and distal-distal daughter CART progeny 2 days after second-division daughter cell isolation (n = 4 from distinct donors). CD8 cells were gated on CTV+CD8+ singlets, and CD4 cells were gated on CTV+CD4+ singlets. In (b), (c), and (e), each color within the same panel represents a distinct donor, with the same colors representing technical replicates, and in (d) and (f), each connected pair represents a distinct donor. Data from both anti- TCRδ CARTs and anti-CD19 CARTs are combined. Statistical significance was determined using two-tailed ratio paired t-test. Source Data
Extended Data Fig. 4
Extended Data Fig. 4. First-division daughter and bulk restimulated CARTs exhibit potent tumor lysis and in vivo tumor control.
a, Bioluminescence imaging quantification of Nalm6 cells in NSG mice depicted in Fig. 2c by treatment group (n = 6–8 mice per treatment group pooled from 3 independent experiments).b-c, 20-hour in vitro cytotoxicity data of proximal-daughter, distal-daughter, and resting CARTs 1 day after first cell division of (b) TN-derived or (c) Teff-derived CARTs. Data points represent the mean (n = 3 replicates for all groups except n = 2 replicates for Teff proximal and distal) and error bars represent standard error of the mean in (b). d, Bioluminescence imaging quantification of Nalm6 cells in NSG mice depicted in Fig. 3c by treatment group (n = 6–8 mice per treatment group pooled from 3 independent experiments). e, Experimental design evaluating acute tumor control of bulk restimulated CARTs, resting CARTs, and NTD. f-g, Bioluminescence imaging quantification of Nalm6 cells in the NSG mouse model. In f, lines represent means and shaded areas represent standard error of the mean. h, Kaplan–Meier survival curve. Dashes indicate censored data. (f-h) n = 4–5 mice per treatment group from one experiment, with NTD and resting conditions constituting a subset of replicates displayed in Fig. 3c and Extended Data Fig. 4d. Statistical significance was determined using and log-rank test in (g). Source Data
Extended Data Fig. 5
Extended Data Fig. 5. Simultaneous surface proteomic and transcriptional profiling reveals CD8+ CART subsets, expanded T-cell clones in effector subsets, and clonal overlap between proximal- and distal-daughter CARTs.
a, UMAP plot using surface protein expression colored by LIPSTIC-sorted cell population. b-c, Unsupervised clustering of UMAP plot using (b) cluster resolution 1.7 and (c) cluster resolution 3.5. d, Using cluster resolution 1.7, clusters were assigned to TN-like (expression of CD45RA, CD62L, IL7-R, TCF7, LEF1, CCR7, KLF2, and BACH2), TCM-like (expression of CD62L, CD45RO, LEF1, CCR7, and absence of CD45RA), TEM-like (expression of CD45RO, KLRG1, CD57, TBX21, EOMES, FLI1 and RUNX3 and absence of CD62L), and TRM-like (expression of CD103, CD69, ITGAE, and RUNX3) subsets using surface protein and gene expression. UMAP plots identical to Fig. 5a (shown here for subset identification). e, UMAP plot based on the size of each cell’s clonotype. Clonotype is defined by identical V, D (if applicable), J, and C genes in addition to identical CDR3 nucleotide sequences on both the TCRα and TCRβ chains. The large and medium clonotypes were predominantly detected in TRM- and TEM-like clusters. f, Venn diagram showing the overlap of the top 10 expanded clonotypes in proximal daughters and their overlap with distal-daughter clonotypes. Of the 11 expanded clonotypes detected across proximal- and distal-daughter populations, 10 clonotypes are detected in both first-division daughter cell populations. g, Proportion of TRAV and TRBV gene usage in resting, distal, activated-undivided, and proximal CARTs. V-gene usage is similar across the T-cell groups, without notable V-gene skewing.
Extended Data Fig. 6
Extended Data Fig. 6. Simultaneous surface protein and gene expression detection demonstrates trogocytosis of B-cell-associated proteins from Nalm6 target cells to CARTs and surface CD8 enrichment in first-division distal-daughter CARTs.
a, Normalized B-cell-associated CD19 and CD10 protein detection on CARTs is displayed on UMAP plots in the top row, and normalized gene expression levels for these proteins in resting, distal, proximal, and activated-undivided CARTs are plotted in the bottom row. Absence of gene expression but detection of surface proteins supports transfer of these proteins from target cells to CARTs. HLA-A2 serves as isotype control. b, Normalized surface expression of CD8 displayed on UMAP plot demonstrating enrichment of CD8 on resting and distal-daughter CARTs over activated-undivided and proximal-daughter CARTs. c, Distal-daughter CARTs isolated when using CAR constructs with either an IgG4 hinge or a CD8α hinge demonstrate higher CD8 surface levels by flow cytometry compared to proximal-daughter CARTs. Cells are pregated on singlet cells. d, TCRα/β surface expression of WT or TRAC KO T cells. Cells are pregated on singlet cells. e, Flow cytometry histograms of proximal-daughters and distal-daughters generated from CD8 TRAC KO CARTs 3 days following first-division daughter cell isolation. Cells are gated on singlet CD8+ cells. f, In vitro cytotoxicity assay of bulk TRAC KO proximal-daughter and distal-daughter performed within one day after isolation of first-division daughter CARTs. Data points represent mean of triplicates, error bars represent standard deviation. Plots representative of 2–3 independent experiments with CARTs from distinct donors. Source Data
Extended Data Fig. 7
Extended Data Fig. 7. TN-like proximal-daughter and distal-daughter CD8 CARTs exhibit asymmetry in surface proteomic and transcriptional landscapes that drive differentiation and metabolic programs.
a-b, Heat maps for first-division TN-like CARTs of (a) normalized surface protein levels of the top 30 proteins enriched in either distal-daughter (top half) or proximal-daughter (bottom half) TN-like CARTs and (b) normalized gene expression of top enriched genes in distal-daughter (top half) and in proximal-daughter (bottom half) TN-like CARTs demonstrate asymmetry in surface proteome and transcriptional abundance between first-division proximal-daughter and distal-daughter TN-like CARTs. c, Proximal-daughter and distal-daughter CD8 TN clusters (2, 9,15) characterized in Fig. 5c,d. d, Gene-set enrichment plots comparing transcriptional programs of proximal-daughter and distal-daughter TN-like CD8 CARTs, indicating enrichment of naïve-associated genes in distal-daughter TN-like CD8 CARTs (positive enrichment score values) and enrichment of genes associated with MYC, MTORC1 signaling, and glycolysis in proximal-daughter TN-like CD8 CARTs (negative enrichment score values). e, Hallmark transcriptional programs of proximal-daughter and distal-daughter TN-like CARTs. Statistical significance was determined using GSEA test with Benjamini–Hochberg correction for multiple comparisons. Plots are representative of 2 independent experiments with distinct donors: one with the anti-TCRδ CAR (shown in this figure) and one with the anti-CD19 CAR.
Extended Data Fig. 8
Extended Data Fig. 8. TCM-like proximal-daughter and distal-daughter CD8 CARTs exhibit asymmetry in surface proteomic and transcriptional landscapes that drive effector or memory differentiation programs.
a-h, Surface proteomic and transcriptional profile asymmetry in first-division TCM-like daughter CARTs support memory maintenance in distal cells and proliferative and effector differentiation in proximal cells. (a) Heat map of normalized surface protein levels of the top 30 proteins enriched in either distal or proximal cells. (b) Heat map of normalized gene expression of top enriched genes in distal-daughters (180 genes) and proximal-daughters (240 genes). (c) Hallmark transcriptional programs of distal and proximal TCM-like CARTs support increased metabolic activity (fatty acid metabolism, oxidative phosphorylation, glycolysis, MTORC1 signaling) and proliferation (MYC targets, mitotic spindle, G2M checkpoint, E2F targets) in proximal-daughters compared to distal-daughters. Statistical significance was determined using GSEA test with Benjamini–Hochberg correction for multiple comparisons. (d) Gene-set enrichment plots comparing transcriptional programs between distal-daughter and proximal-daughter TCM-like CARTs demonstrating enrichment in memory-associated programs in distal cells and effector-associated programs in proximal cells. (e) Proximal and distal TCM clusters (clusters 11 and 5) characterized in f-g. (f) Velocity vector projection onto TCM UMAP clusters with streamline plots indicating divergent cell-state transitions between proximal and distal daughter cells. Black line signifies border between distal (orange) and proximal (blue) cells. (g) Gene-specific RNA velocity displayed as spliced/unspliced transcripts (left column) and projected onto TCM UMAP clusters (middle column), with normalized gene expression levels as a comparison (right column), demonstrate that both intrinsic transcriptional changes (MYC upregulation in proximal-daughters, IL7R upregulation in distal-daughters) and asymmetric assortment of pre-existing RNA (greater abundance of TCF7, LEF1 in distal-daughters with similar RNA velocities as proximal-daughters) are mechanisms for transcript abundance differences during ATCD. Plots are representative of 2 independent experiments with distinct donors: one with the anti-TCRδ CAR (shown in this figure) and one with the anti-CD19 CAR.
Extended Data Fig. 9
Extended Data Fig. 9. Surface proteomic and transcriptional asymmetry between proximal-daughter and distal-daughter TEM-like CD8 CARTs.
a-b, Heat maps of (a) normalized surface protein levels of the top 30 proteins enriched in either distal-daughters or proximal-daughters and (b) normalized gene expression of top enriched genes in distal-daughters and in proximal-daughters demonstrate asymmetry in surface proteome and transcriptional abundance between first-division proximal-daughter and distal-daughter TEM-like CARTs. c, Hallmark transcriptional programs of distal and proximal TEM-like CARTs support interferon alpha and gamma response in distal-daughters and increase metabolic activity (glycolysis, MTORC1 signaling) and proliferation (MYC targets, mitotic spindle, G2M checkpoint, E2F targets) in proximal-daughters. Statistical significance was determined using GSEA test with Benjamini–Hochberg correction for multiple comparisons. d, Gene-set enrichment plot between distal-daughter and proximal-daughter TEM-like CARTs demonstrate enrichment of naïve-associated programs rather than KLRG1hi effector cell-associated programs in distal-daughters. e, Proximal and distal TEM clusters (clusters 10 and 1) characterized in f-g. f, Velocity vector projection onto TEM UMAP clusters with streamline plots indicating divergent cell-state transitions between distal-daughters and a portion of proximal-daughters. A subset of proximal-daughters exhibit velocity vectors with the same directionality as that of distal-daughters, which may reflect heterogeneity in TEM-like proximal-daughters, with a fraction of proximal-daughters exhibiting a trajectory toward a memory-like rather than effector-like cell state. Black line signifies border between distal (orange) and proximal (blue) cells. g, Gene-specific RNA velocity displayed as spliced/unspliced transcripts (left column) and projected onto TEM UMAP clusters (middle column), with normalized gene expression levels as a comparison (right column) demonstrating that, consistent with prior reports, PRKCZ transcripts are enriched in distal-daughters and MYC transcripts are enriched in proximal-daughters. Consistent with the velocity vector projection in f and similar to distal-daughters, a portion of proximal-daughters upregulate and exhibit higher transcript abundance of PRKCZ and IL7R transcription. Similar to TN and TCM cells, MYC, IL7R, and TBX21 demonstrate velocity changes in first division daughter cells indicative of asymmetric intrinsic transcriptional changes of these genes. Plots are representative of 2 independent experiments with distinct donors: one with the anti-TCRδ CAR (shown in this figure) and one with the anti-CD19 CAR.
Extended Data Fig. 10
Extended Data Fig. 10. Surface proteomic and transcriptional asymmetry between first-division proximal-daughter and distal-daughter TRM-like CD8 CARTs.
a-b, Heat map of (a) normalized surface protein levels of the top 30 proteins enriched in either distal-daughters or proximal-daughters and (b) normalized gene expression of top enriched genes in either distal-daughters or proximal-daughters demonstrate asymmetry in surface proteome and transcriptional abundance between first-division proximal-daughter and distal-daughter TRM-like CARTs. c, Hallmark transcriptional programs of distal and proximal TRM-like CARTs support interferon alpha and gamma response in distal-daughters and increase metabolic activity (glycolysis, MTORC1 signaling) and proliferation (MYC targets, mitotic spindle, G2M checkpoint, E2F targets) in proximal-daughters. Statistical significance was determined using GSEA test with Benjamini–Hochberg correction for multiple comparisons. d, Gene-set enrichment plot between distal and proximal TRM-like CARTs demonstrate enrichment of lung effector memory cell-associated programs in distal-daughters and effector cell-associated programs in proximal-daughters. e, Proximal and distal TRM clusters (clusters TRM21 and TRM10) characterized in f-g. f, Velocity vector projection onto TRM UMAP clusters with streamline plots indicating divergent cell-state transitions between proximal-daughters and distal-daughters. Black line signifies border between distal (orange) and proximal (blue) cells. g, Gene-specific RNA velocity displayed as spliced/unspliced transcripts (left column) and projected onto TRM UMAP clusters (middle column), with normalized gene expression levels as a comparison (right column) demonstrating intrinsic upregulation of IL7R, LEF1, TCF7, and CXCR6 in distal-daughters compared to proximal-daughters. Plots are representative of 2 independent experiments with distinct donors: one with the anti-TCRδ CAR (shown in this figure) and one with the anti-CD19 CAR.
Extended Data Fig. 11
Extended Data Fig. 11. IKZF1 downregulation promotes effector-like differentiation of distal-daughter CARTs.
a, Experimental timeline of IKZF1-KO CART generation and subsequent LIPSTIC assay. b, Representative Tracking of Indels by Decomposition (TIDE) analysis of two independent experiments to calculate the rate of IKZF1 gene editing. c, Representative western blot of two independent experiments detecting IKZF1 and β-actin of Cas9 control and IKZF1-KO CARTs. d, Flow cytometry summary statistics comparing proximal- and distal-daughter progeny of Cas9 control and IKZF1-KO CARTs (n = 4 independent experiments with distinct donors). e, Bioluminescence imaging quantification of Nalm6 cells in NSG mice related to Fig. 5g–j by treatment group (n = 7–8 mice per treatment group pooled from 2 independent experiments). f, Experimental timeline of IKZF1 depletion with use of lenalidomide and subsequent LIPSTIC assay. g, Representative western blot of two independent experiments detecting IKZF1 and β-actin of CARTs treated with DMSO or 0.1 μM lenalidomide for 1 day. h, Flow cytometry summary statistics comparing proximal- and distal-daughter progeny of DMSO control and lenalidomide-treated CARTs (n = 3 independent experiments with distinct donors). Statistical significance was determined using two-tailed ratio paired t-test (d and h). Source Data

References

    1. Park, J. H. et al. Long-term follow-up of CD19 CAR therapy in acute lymphoblastic leukemia. N. Engl. J. Med.378, 449–459 (2018). - DOI - PMC - PubMed
    1. Maude, S. L. et al. Chimeric antigen receptor T cells for sustained remissions in leukemia. N. Engl. J. Med.371, 1507–1517 (2014). - DOI - PMC - PubMed
    1. Melenhorst, J. J. et al. Decade-long leukaemia remissions with persistence of CD4+ CAR T cells. Nature602, 503–509 (2022). - DOI - PMC - PubMed
    1. Porter, D. L. et al. Chimeric antigen receptor T cells persist and induce sustained remissions in relapsed refractory chronic lymphocytic leukemia. Sci. Transl. Med.7, 303ra139–303ra139 (2015). - DOI - PMC - PubMed
    1. Brentjens, R. J. et al. CD19-targeted T cells rapidly induce molecular remissions in adults with chemotherapy-refractory acute lymphoblastic leukemia. Sci. Transl. Med.5, 177ra138–177ra138 (2013). - DOI - PMC - PubMed

MeSH terms