. 2024 Sep;633(8029):398-406.
doi: 10.1038/s41586-024-07851-w. Epub 2024 Aug 28.

Cooperative thalamocortical circuit mechanism for sensory prediction errors

Affiliations

Cooperative thalamocortical circuit mechanism for sensory prediction errors

Shohei Furutachi et al. Nature. 2024 Sep.

Abstract

The brain functions as a prediction machine, utilizing an internal model of the world to anticipate sensations and the outcomes of our actions. Discrepancies between expected and actual events, referred to as prediction errors, are leveraged to update the internal model and guide our attention towards unexpected events1-10. Despite the importance of prediction-error signals for various neural computations across the brain, surprisingly little is known about the neural circuit mechanisms responsible for their implementation. Here we describe a thalamocortical disinhibitory circuit that is required for generating sensory prediction-error signals in mouse primary visual cortex (V1). We show that violating animals' predictions by an unexpected visual stimulus preferentially boosts responses of the layer 2/3 V1 neurons that are most selective for that stimulus. Prediction errors specifically amplify the unexpected visual input, rather than representing non-specific surprise or difference signals about how the visual input deviates from the animal's predictions. This selective amplification is implemented by a cooperative mechanism requiring thalamic input from the pulvinar and cortical vasoactive-intestinal-peptide-expressing (VIP) inhibitory interneurons. In response to prediction errors, VIP neurons inhibit a specific subpopulation of somatostatin-expressing inhibitory interneurons that gate excitatory pulvinar input to V1, resulting in specific pulvinar-driven response amplification of the most stimulus-selective neurons in V1. Therefore, the brain prioritizes unpredicted sensory information by selectively increasing the salience of unpredicted sensory features through the synergistic interaction of thalamic input and neocortical disinhibitory circuits.


Conflict of interest statement

The authors declare no competing interests.

Figures

Fig. 1
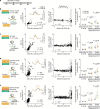
Fig. 1. Prediction errors amplify unexpected visual information.
a, Structure of the virtual corridor and experimental design. b, Two-photon calcium imaging approach. c, Average calcium responses to different stimuli in corridor traversals with unexpected C (red, in block 1) and with expected C (blue, in late block 2). V1 neurons responsive to the presented stimulus in unexpected C trials, expected C trials or both were included. Dotted vertical lines indicate grating onsets. Data from 9 mice; P values from hierarchical bootstrapping test. See also Extended Data Fig. 2b for combined responses of all grating-responsive neurons. d, Average calcium responses to stimuli C4 (dark grey) and A3 (light grey) during C trials across trials and blocks. e, Thought experiment to disambiguate information represented by prediction errors. f, Experimental design. Stimulus C was presented at position 2 (C2) or at position 3 (C3) in 5% of trials each in block 1. g, Average calcium responses to unexpected (red) and expected (blue) stimuli C2 (top) and C3 (bottom). Data from 9 mice, P values from hierarchical bootstrapping test. h, Responses to unexpected stimulus C2 plotted against responses to unexpected C3 for individual V1 layer 2/3 neurons; Pearson correlation. i, Difference in response strength between unexpected and expected C2 plotted against response strength difference between unexpected and expected C3 responses for individual V1 layer 2/3; Pearson correlation. j, Similar to e, but for a second thought experiment. Exp., expected; unexp., unexpected. k, Experimental design. Stimuli C or D were presented at position 4 (C4 and D4) in 10% of trials in different sessions. l, Same as g, but for stimuli C4 (top) and D4 (bottom). Data from 5 mice. m, Same as h, but for stimuli C4 and D4. n, Same as i, but for stimuli C4 and D4. c,d,g,l, Data are mean ± bootstrap 95% confidence intervals. See also Extended Data Figs. 1–3. Source Data
Fig. 2
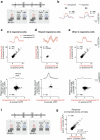
Fig. 2. Prediction error specifically boosts the most stimulus-selective neurons.
a, Trial-averaged responses of all prediction-error-responsive neurons (n = 329 cells, 9 mice) to all grating stimuli in traversals with unexpected C4 (top; block 1) and expected C4 (bottom; late block 2), sorted by response to unexpected C4. b, Same as a, but average response strength of individual neurons (top) and mean calcium responses of all neurons (bottom). Shading indicates bootstrap 95% confidence intervals. c, Difference in response strength to unexpected (block 1) and expected C4 (late block 2) for all grating-responsive cells in late block 2, plotted against response to expected C4 in late block 2 for individual neurons. Pearson correlation; 9 mice. d, Left, difference in response strength between unexpected and expected C4 responses of individual neurons, plotted against their response selectivity to stimulus C versus stimulus B in late block 2 (Methods) for all neurons responsive to at least one of the grating stimuli in late block 2. −1 indicates only responsive to B, +1 indicates only responsive to C, and 0 indicates similar responses to both. Right, same as on the left but for response selectivity to stimulus C versus stimulus A. e, Mean responses to expected (blue) and unexpected (red) C4, of V1 neurons responsive to A or B (left), of non-selective (middle; responsive to C with selectivity < 0.6) and highly selective neurons (right; responsive to C with selectivity towards C, compared to B > 0.8) in late block 2. Data are mean responses for individual mice (n = 9), black horizontal bars indicate mean across mice. Two-sided signed-rank test. f, Mean calcium responses to stimulus C4 across all trials of highly selective (dark grey, n = 77 cells from 9 mice) and non-selective (light grey, n = 53) grating C4-responsive cells in late block 2. Error bars indicate bootstrap 95% confidence intervals. See also Extended Data Figs. 4–6. Source Data
Fig. 3
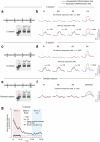
Fig. 3. Activity of VIP interneurons and pulvinar input is required for V1 prediction-error signals.
a, Experimental design. Calcium activity of VIP cells in V1 layer 2/3 was recorded during the experiment depicted in Fig. 1k. b, Single-cell responses for all VIP cells (individual rows) in the session with unexpected stimulus C (top; C session, n = 350 cells from 7 mice) and with unexpected stimulus D (bottom; D session, n = 403 cells from 7 mice) to expected B4 (left), unexpected C4 or D4 (middle; block 1) and expected C4 or D4 (right; late block 2), sorted by response strength to unexpected C4 or D4. c, Cell- and trial-averaged stimulus responses of all VIP cells in b. P values from hierarchical bootstrapping test with Bonferroni correction. d, Average calcium responses of all VIP cells to grating stimulus C4 or D4 (dark grey) and other gratings in the same trial (average of A1, B2 and A3, light grey) over time. e, Experimental design. Calcium activity of V1 layer 2/3 cells was recorded while VIP cells were optogenetically silenced during visual stimulus presentation. f, Top, cell- and trial-averaged responses of V1 neurons significantly responsive to the presented visual stimuli with (amber) or without (black) VIP silencing. Bottom, responses of individual neurons to the visual stimulus indicated above during VIP cell silencing (LED on), plotted against responses to the same stimulus in control trials (LED off). values from hierarchical bootstrapping test, from 9 mice. g, Effect of VIP neuron silencing (LED on − LED off during unexpected stimulus C4 or D4) plotted against the strength of prediction-error signals (response to unexpected C4 or D4 − response to expected C4 or D4); Pearson correlation. hk, Same as ad, but for calcium responses of pulvinar axonal boutons in V1 layer 1. ln, Same as eg, but the activity of V1 layer 2/3 cells was recorded while pulvinar axons in V1 were optogenetically silenced. c,d,f,j,k,m, Data are mean ± bootstrap 95% confidence intervals (shading or error bars). See also Extended Data Figs. 7–10. Source Data
Fig. 4
Fig. 4. Neocortical disinhibition and pulvinar input act synergistically.
a, Experimental design. After training in the virtual corridor (stimuli A–B–A–B), optogenetic manipulation was paired with grating B2 in 50% of trials. b, Left, the activity of V1 layer 2/3 cells was recorded while pulvinar axons were optogenetically stimulated. Stimulation started 0.1 s after grating onset and lasted for 1 s. Second column, responses of individual V1 neurons with and without pulvinar axonal stimulation (LED on versus LED off). n = 118 grating A or B responsive cells from 6 mice, Hierarchical bootstrapping test. Inset, cell-averaged calcium responses with (amber) or without (black) optogenetic stimulation. Lines and shaded regions are mean and bootstrap 95% confidence intervals. Third column, effect of optogenetic stimulation (difference of response to grating B2 with and without LED stimulation) plotted against response selectivity (Methods) of individual V1 neurons. Right, calcium response strength to stimulus B2 of neurons selective to A (left), and non-selective (selectivity B versus A < 0.6, middle) and highly selective (selectivity B versus A > 0.8, right) grating B2 responsive cells in V1 layer 2/3 with (amber) or without (grey) optogenetic stimulation. P values from two-sided signed-rank test. Data points depict mean responses for individual imaging sessions; n = 6 mice; black horizontal bars indicate mean across animals. c, Same as b, but the activity of V1 layer 2/3 cells was recorded while VIP cells were optogenetically stimulated. n = 6 mice. d, Same as b, but the activity of V1 layer 2/3 cells was recorded while pulvinar axons and VIP cells were optogenetically stimulated simultaneously. n = 9 mice. e, Same as b, but the activity of V1 layer 2/3 cells was recorded while pulvinar axons and SOM cells were optogenetically co-manipulated for 3 s starting at grating stimulus onset. n = 6 sessions from 4 mice. See also Extended Data Fig. 11. Source Data
Fig. 5
Fig. 5. Pulvinar activates a specific subpopulation of SOM cells.
a, Experimental design. The activity of SOM cells was recorded while pulvinar axons were optogenetically stimulated for 3 s starting at visual stimulus onset. b, Single-cell responses to expected and unexpected visual stimuli of all SOM cells (individual rows, n = 6 sessions from 4 mice) with (right) or without (left) optogenetic stimulation. c, Cell-averaged calcium responses with (amber) or without (black) optogenetic stimulation of SOM cells significantly activated by pulvinar stimulation (recruited cells, n = 29) and other cells (n = 159). Lines represent the mean and shaded regions indicate 95% confidence intervals. d, Visual stimulus responses of individual SOM neurons to expected B4 stimulus (left), unexpected C4 or D4 stimulus (middle; in block 1) and expected C4 or D4 stimulus (right; in late block 2) plotted against the effect of pulvinar stimulation (difference in strength of visual stimulus responses with and without optogenetic pulvinar axon stimulation) for recruited (brown) and other (black) SOM cells. e, Cell-averaged strength of calcium response to expected B4 (black), unexpected C4 or D4 (red) and expected C4 or D4 (blue) stimuli of recruited and other SOM cells. P values from hierarchical bootstrapping test with Bonferroni correction. Data are mean ± 95% bootstrap confidence intervals. f, Proposed circuit mechanism for sensory prediction errors. VIP neurons inhibit a specific subpopulation of SOM cells that otherwise gate pulvinar input to V1, resulting in specific pulvinar-driven response amplification of the most stimulus-selective neurons in V1. See also Extended Data Fig. 12. Source Data
Extended Data Fig. 1
Extended Data Fig. 1. Running and licking behaviour and pupil size during presentation of expected and unexpected gratings.
Related to Figs. 1 and 2. a, Running speed at virtual corridor position 3 (left, grating A3 shown) or at position 4 (right, grating B4 or C4 shown) in trials in which grating B was presented at position 4 (black, expected B4 trials, 90% of trials in block 1), trials in which grating C was presented at position 4 (red, 10% of trials in block 1, unexpected C4 trials) and trials in the second half of block 2 (blue, expected C4 trials, late block 2). Light grey shading indicates length of visual stimulus at the centre of monitors. Lines and shading are mean and bootstrap 95% CI (n = 20 mice). b, Same as a, but data from individual animals are shown separately. Black bars represent mean across animals. Position 3, running speed during grating A3 presentation in B4 vs unexpected C4 trials: P = 0.53; running speed during grating A3 presentation in unexpected vs expected C4 trials: P = 1. Position 4, running speed during B4 vs unexpected C4 presentation: P = 4.4 × 10⁻⁴; running speed during unexpected vs expected C4 presentation: P = 0.33. n = 20 mice, two-sided signed-rank test with Bonferroni correction. c and d, Same as a and b, but for relative pupil size (normalized by each session’s median value). d, Position 3, pupil size during grating A3 presentation in B4 vs unexpected C4 trails: P = 1; pupil size during grating A3 presentation in unexpected vs expected C4 trials: P = 0.078. Position 4, pupil size during B4 vs unexpected C4 presentation: P = 1; pupil size during unexpected vs expected C4 presentation: P = 0.055; n = 9 mice, two-sided signed-rank test with Bonferroni correction. e and f, Same as a and b, but for lick rate. e, Inset shows lick rate around the reward delivery. f, Position 3, lick rate during A3 presentation in B4 vs unexpected C4 trials: P = 0.063; lick rate during A3 presentation in unexpected vs expected C4 trials: P = 1. Position 4, lick rate during B4 vs unexpected C4 presentation: P = 0.60; lick rate during unexpected vs expected C4 presentation: P = 1. n = 9 mice, two-sided signed-rank test with Bonferroni correction. g-j, Same as a-d, but for a different unexpected visual stimulus D. h, Position 3, running speed during grating A3 presentation in B4 vs unexpected D4 trials: P = 0.63; running speed during grating A3 presentation in unexpected vs expected D4 trials: P = 1. Position 4, running speed during B4 vs unexpected D4 presentation: P = 0.31; running speed during unexpected vs expected C4 presentation: P = 0.63. n = 6 mice, two-sided signed-rank test with Bonferroni correction. j, Position 3, pupil size during grating A3 presentation in B4 vs unexpected D4 trials: P = 1; pupil size during grating A3 presentation in unexpected vs expected D4 trials: P = 0.063. Position 4, pupil size during B4 vs unexpected D4 presentation: P = 1; pupil size during unexpected vs expected D4 presentation: P = 0.063; n = 6 mice, two-sided signed-rank test with Bonferroni correction. k, Running speed (left) and responses to grating C4 (right) on trials with fast (black, top 50%) and slow (red, bottom 50%) running speed during grating C presentation at position 4 in block 1 (see Methods). l, Same as k, but for block 2. m, Scatterplot showing the relationship between response modulation by running speed (difference in calcium response between fast and slow trials) and strength of prediction error responses (Pearson correlation: r = 0.27, P = 1.3 × 10⁻¹²; n = 644 cells from 9 mice) in block 1. The positive correlation shows that the response to unexpected grating C was larger in trials with higher running speed, as expected from previous studies. This shows that running speed changes (deceleration in response to the unexpected stimulus) cannot explain the increased neural responses to unexpected stimuli. n, Same as m, but for block 2 (Pearson correlation: r = −0.064, P = 0.11; n = 644 cells from 9 mice). o, Scatterplot showing the relationship between correlation of z-scored ΔF/F and running speed (coefficient of determination R2, over the entire recording session) and strength of prediction error responses (Pearson correlation: r = −0.021, P = 0.60; n = 644 cells from 9 mice).
Extended Data Fig. 2
Extended Data Fig. 2. Average calcium responses in V1 to expected and unexpected stimuli and unexpected stimulus omissions.
a, Schematic of visual stimuli shown in a C session (unexpected C stimulus presented in 10% of trials instead of B at position 4 in block 1 and in 100% of trials in block 2). b, Top: Average calcium responses of all cells significantly responsive to any of the presented gratings in unexpected C4 (block 1) or expected C4 (late block 2) trials (n = 887). Dotted line indicates grating stimulus onset. Bottom: Average calcium responses as on top, but only of neurons significantly responsive to each presented grating stimulus (n = 158, 125, 146, 644; Gratings A1, B2, A3, C4 responsive cells). Same as Fig. 1c. Data from 9 mice. c, Schematic of visual stimuli shown in a D session (unexpected D stimulus presented in 10% of trials instead of B at position 4 in block 1 and in 100% of trials in block 2). d, Same as b but responses to stimulus D4 on the right. Top: n = 1,069. Bottom: n = 125, 129, 129, 840; A1, B2, A3, D4 responsive cells. Data from 7 mice. e, Schematic of visual stimuli shown in an omission session (stimulus B4 omitted in 10% of trials in block 1 and in 100% of trials in block 2). f, Average calcium responses to gratings A1, B2, A3 and omission of B4 of all omission responsive cells (n = 92 from 5 mice). Lines and shading are mean and bootstrap 95% CI. g, Average calcium responses to C4 (dark grey), average responses to A1, B2, A3 (light grey) and to B4 (black) of all cells significantly responsive to any of the presented gratings in block 1 or late block 2 trials (n = 887). Symbols and error bars depict mean and bootstrap 95% CI.
Extended Data Fig. 3
Extended Data Fig. 3. Prediction error responses to the same unexpected visual stimulus encountered at different locations.
a, Experimental design. Grating stimulus C was presented at position 2 (C2) or at position 4 (C4) in 5% of trials each in block 1. b, Average calcium responses to unexpected (red) and expected (blue) C2 (left, n = 496 from 5 mice, P < 1 × 10⁻⁴, hierarchical bootstrapping test) and C4 (right, n = 496 from 5 mice, P < 1 × 10⁻⁴). Cells responsive to unexpected or expected C2 or C4 were pooled. Lines and shading indicate mean and bootstrap 95% CI. c, Top: average calcium responses to unexpected C2 (dotted red) and unexpected C4 (red, n = 496 from 5 mice, P < 1 × 10⁻⁴, hierarchical bootstrapping test) and responses of individual V1 neurons to C2 plotted against their responses to C4. Bottom: average calcium response aligned to reward onset of all neurons and reward response (from 0.5 s before to 0.5 s after reward onset) plotted against difference in response to unexpected C2 and unexpected C4 (n = 496 from 5 mice). d, Same as c, but only for reward responsive cells (n = 28 from 5 mice, P = 0.0094, hierarchical bootstrapping test). e, Same as c, but for the remaining, reward non-responsive cells (n = 468 from 5 mice, P < 1 × 10⁻⁴, hierarchical bootstrapping test). f, Experimental design. Grating C was presented at position 2 (C2) or at position 3 (C3) in 5% of trials each in block 1. Same as Fig. 1f. g, Same as Fig. 1h, but responses are normalized across animals by mean response of all responsive neurons (C2 or C3) of individual animals (n = 549 from 9 mice, Pearson correlation: r = 0.88, P = 7.9 × 10−181).
Extended Data Fig. 4
Extended Data Fig. 4. Prediction error signal in response to a familiar visual stimulus encountered at an unexpected location (grating A presented at location 4 instead of grating B).
a, Schematic of experimental design (A session). b, Calcium responses of individual V1 neurons to expected grating A1 plotted against responses to expected grating A3. Neurons responsive to either A1 or A3 were included in the analysis (n = 95 cells from 8 mice, P = 0.53, hierarchical bootstrapping test). c, Calcium responses of individual V1 neurons to expected grating B2 plotted against responses to expected grating B4. Neurons responsive to either B2 or B4 were included in the analysis (n = 77 cells from 8 mice, P = 0.0032, hierarchical bootstrapping test). d, Calcium responses of individual V1 neurons to expected grating A3 plotted against responses to unexpected grating A4. Neurons responsive to either A3 or A4 were included in the analysis (n = 171 cells from 8 mice, P < 1 × 10⁻⁴, hierarchical bootstrapping test). e, Strength of prediction error signal (difference in response to unexpected grating A4 and expected grating A3) plotted against grating response selectivity (difference in response to grating A3 and grating B2 divided by the sum of responses) for all cells responsive to expected gratings. f, Cell-averaged response strength to expected grating A3 (blue) and unexpected grating A4 (red) of B-selective (left, n = 8 mice, P = 0.055, two-sided signed-rank test), and non-selective (selectivity A3 vs B2 < 0.6, left, n = 8 mice, P = 0.84, two-sided signed-rank test) and highly selective (selectivity A3 vs B2 > 0.8, right, n = 8 mice, P = 0.0078) grating A3 responsive cells. Data points depict mean responses for individual animals, n = 8 mice, black horizontal bars indicate mean across animals. g, Schematic of experimental design (C session). h, Same as d, but for C session. Calcium responses of individual V1 neurons to expected grating C4 plotted against responses to unexpected grating C4. Neurons responsive to either expected for unexpected C4 were included in the analysis (n = 644 cells from 9 mice, P < 1 × 10⁻⁴, hierarchical bootstrapping test). i, Calcium responses of individual V1 neurons to expected grating C4 plotted against responses to unexpected grating C4. Neurons responsive to unexpected C4 but not expected C4 were included in the analysis (n = 482 cells from 9 mice). Cell- and trial-averaged calcium responses of the same cells to unexpected C4 (red) and expected C4 (blue) were plotted on top. j, Same as i, but for neurons responsive to expected C4 (n = 162 from 9 mice). k, Average calcium responses to C4 of neurons responding to unexpected but not expected C4 (dark grey, n = 482) and of neurons responding to expected C4 (light grey, n = 162) across trials and blocks. Symbols and error bars depict mean and bootstrap 95% CI.
Extended Data Fig. 5
Extended Data Fig. 5. Prediction error responses of layer 2/3 cells in V1 to different visual stimuli.
a-d, Same as Fig. 1k–n, but excluding VIP neurons which were labelled with tdTomato in these experiments. b, Top: cell- and trial-averaged calcium responses of C4-responsive neurons to expected B4 (black, block 1), unexpected C4 (red, block 1) and expected C4 (blue, late block 2). n = 304 cells from 5 mice, P < 1 × 10⁻⁴, Hierarchical bootstrapping test. Bottom: cell- and trial-averaged calcium responses to expected B4 (black), unexpected D4 (red) and expected D4 (blue). n = 607 cells from 5 mice, P < 1 × 10⁻⁴, Hierarchical bootstrapping test. Lines and shading are mean and bootstrap 95% CI. c, Calcium responses of individual V1 neurons to unexpected D4 plotted against unexpected C4 responses. Pearson correlation: r = −0.17, P = 2.0 × 10⁻⁶, n = 814 cells from 5 mice. d, Left: the difference of responses between unexpected and expected D4 plotted against the difference of responses between unexpected and expected C4. Pearson correlation: r = −0.041, P = 0.25, n = 814 cells from 5 mice. Right: same as on the left but excluding neurons not responsive to C and D. Inset: distribution of prediction error absolute selectivity |(C − D)/(C + D)| of V1 neurons in the right scatter plot compared to a shuffled data set. V1 responses to the two stimuli are more selective than expected by chance. n = 467 cells from 5 mice, P < 1 × 10⁻⁴, randomization test. e, Pie chart with proportion of prediction-error responsive non-VIP neurons in V1 for stimulus C, stimulus D, or both (see Methods). n = 960 cells from 5 mice. f-h, Same as b-d, but for cells responsive to prediction error (C), but not responsive to expected C4 (n = 133). i-k, Same as f-h, but for cells responsive to prediction error (D), but not responsive to expected D4 (n = 138). l, Experimental design. Gratings C or A were presented at position 4 (C4 and A4) in 5% or 10% of trials in different sessions (C and A sessions, respectively). Note that a horizontal grating E was presented at position 1 and 3 in these experiments and during training. m-p, Same as b-e, but for comparison of unexpected C4 and unexpected A4 responses. m, Top: cell- and trial-averaged calcium responses of C4-responsive neurons to unexpected C4 (red, block 1) and expected C4 (blue, late block 2). n = 233 cells from 3 mice, P < 1 × 10⁻⁴, Hierarchical bootstrapping test. Bottom: cell- and trial-averaged calcium responses to unexpected A4 (red) and expected A4 (blue). n = 204 cells from 3 mice, P < 1 × 10⁻⁴, Hierarchical bootstrapping test. Lines and shading are mean and bootstrap 95% CI. n, Calcium responses of individual V1 neurons to unexpected A4 plotted against unexpected C4. Pearson correlation: r = −0.098, P = 0.052, n = 394 cells from 3 mice. o, The difference of responses between unexpected and expected A4 plotted against the difference of responses between unexpected and expected C4. Pearson correlation: r = −0.030, P = 0.56, n = 394 cells from 3 mice. p, Pie chart with proportion of prediction-error responsive non-VIP neurons for stimulus C, stimulus A, or both (see Methods). n = 464 cells from 3 mice. q, Schematic of visual stimuli shown in an omission session (stimulus B4 omitted in 10% of trials in block 1 and in 100% of trials in block 2) and a D session (stimulus D was presented at position 4 in 10% of trials in block 1 and in 100% of trials in block 2). r, Average V1 calcium responses to unexpected (red) and expected (blue) omission (top, n = 78 from 4 mice, P < 1 × 10⁻⁴) and D4 (bottom, n = 479 from 4 mice, P < 1 × 10⁻⁴). Hierarchical bootstrapping test. Lines and shading indicate mean and bootstrap 95% CI. s, Responses to unexpected omission plotted against responses to unexpected D4 for individual V1 layer 2/3 neurons (n = 538 cells from 4 mice). t, Difference between responses to unexpected omission and expected omission of B4 plotted against response difference between unexpected D4 and expected D4 stimulus responses for individual V1 layer 2/3 neurons. u-w, Same as r-t, but for cells with a significant difference in response between expected and unexpected stimulus omission (n = 39). x-z, Same as r-t, but for cells with a significant difference in response between expected and unexpected stimulus D4 (n = 234).
Extended Data Fig. 6
Extended Data Fig. 6. Prediction error specifically boosts neurons most selective to the presented visual stimulus (stimulus D).
a-f, Same as Fig. 2, but for a second unexpected visual stimulus D. a, Single-cell responses for all prediction-error responsive cells (individual rows) (n = 383 cells, 7 mice) to visual stimuli A1, B2, A3 and D4 in unexpected D4 (top) and expected D4 (bottom) trials, sorted by response to unexpected D4. b, Top: calcium responses for all prediction-error responsive cells (individual dots) (n = 383 cells, 7 mice) to visual stimuli A1, B2, A3 and D4 in unexpected D4 (red) and expected D4 (blue) trials. Bottom: Cell-averaged calcium responses. Lines and shading are mean and bootstrap 95% CI. c, Difference in response strength between unexpected (block 1) and expected D4 (late block 2) for all visual stimulus-responsive cells in late block 2, plotted against response to expected D4 (late block 2) for individual neurons. r = 0.32, P = 3.6 × 10⁻¹², Pearson correlation; n = 437, 7 mice. d, Left: difference in response strength between unexpected and expected D4 responses of individual neurons, plotted against their response selectivity to stimulus D vs. stimulus B in late block 2 (difference in response strength between expected D4 and B2 divided by the sum of responses to both stimuli) for all neurons responsive to at least one of the visual stimuli in late block 2. −1 indicates only responsive to B, +1 only responsive to D, and 0 equal responses to both. Right: same as on the left but for response selectivity to stimulus D vs. stimulus A in late block 2. e, Mean responses to expected (blue) and unexpected (red) stimulus D4 of A or B selective cells (left, n = 7 mice, P = 0.94; two-sided signed-rank test), and non-selective (selectivity towards D, compared to B < 0.6, middle, n = 7 mice; P = 0.69; two-sided signed-rank test) and highly selective (selectivity towards D, compared to B > 0.8, right, n = 7 mice; P = 0.016) stimulus D4 responsive cells in late block 2. Data points depict mean responses for individual animals, n = 7 mice, black horizontal bars indicate mean across animals. f, Mean calcium responses to stimulus D4 over all trials in the imaging session of highly selective (dark grey, n = 185) and non-selective (light grey, n = 75) stimulus D4 responsive cells in block 2. Responses were averaged over two trials. Error bars are bootstrap 95% CI. g, Same as Fig. 2e, but showing responses as raw ΔF/F0 without z-scoring. h, Same as g, but for sessions with unexpected stimulus D, equivalent to panel e. i, Same as Fig. 2e, but highly selective cells were sub-selected to match their average response strength to the expected stimulus C4 with the average response to expected stimulus C4 of non-selective cells. To achieve this, highly selective cells that responded strongly to expected gratings (top 35%) were removed from the analysis. Hierarchical bootstrapping test. Bars and error bars are mean and 95% bootstrap CI. j, Same as i, but for sessions with unexpected stimulus D, equivalent to panel e, but with matched average response strength to expected stimulus D4 of highly selective and non-selective V1 cells.
Extended Data Fig. 7
Extended Data Fig. 7. Prediction error responses of VIP cells to different visual stimuli, effect of optogenetic VIP neuron silencing on strongly responding layer 2/3 cells, and broad facilitation of pulvinar inputs by prediction errors.
a, Schematic of the experimental design. Stimulus C or D was presented at position 4 (C4 and D4) in 10% of trials in different sessions (C and D sessions, respectively). Calcium activity of VIP cells in V1 layer 2/3 was recorded. b, Top: cell- and trial-averaged VIP calcium responses to expected B4 (black), unexpected C4 (red, block 1) and expected C4 (blue, late block 2). n = 291 VIP cells from 5 mice, P < 1 × 10⁻⁴, Hierarchical bootstrapping test. Bottom: cell- and trial-averaged VIP calcium responses to expected B4 (black), unexpected D4 (red) and expected D4 (blue). n = 298 VIP cells from 5 mice, P < 1 × 10⁻⁴, Hierarchical bootstrapping test. Lines and shading are mean and bootstrap 95% CI. c, Calcium responses of individual VIP neurons to unexpected D4 plotted against responses to unexpected C4. Pearson correlation: r = 0.29, P = 1.8 × 10⁻⁵, n = 290 from 5 mice. d, Difference of responses to unexpected and expected stimulus D4 plotted against the difference of unexpected and expected C4 responses (Pearson correlation: r = 0.13, P = 0.031, n = 290 from 5 mice. e, Pie chart with proportion of prediction-error responsive VIP cells for stimulus C, stimulus D, or both (see Methods). n = 199 from 5 mice. f, Distribution of stimulus response strength for VIP cells to unexpected C4 or D4 (n = 753, 14 sessions from 7 mice). g, Same as Fig. 3f, but only cells exhibiting a visual stimulus response of more than 3 z-scored ΔF/F were included in order to avoid inclusion of opsin-expressing and therefore directly silenced VIP cells, which cannot be visually identified in these experiments (n = 45 from 7 sessions; P < 1 × 10⁻⁴; Hierarchical bootstrapping test). Neurons indicated in black have responses > 3 z-scored ΔF/F. Inset: Responses to unexpected stimulus C4 or D4 of V1 layer 2/3 cells with (amber) or without (black) VIP silencing. Lines and shading are mean and bootstrap 95% CI. h, Experimental design. The calcium activity of axonal boutons of pulvinar projections in V1 L1 was recorded. i, Stimulus responses of individual pulvinar boutons to unexpected C4 or D4 plotted against responses to expected C4 or D4. n = 1,978 pulvinar boutons from 10 sessions, 7 mice. j, Left: difference in response strength between unexpected and expected C4 or D4 responses of individual neurons, plotted against their response selectivity to stimulus C or D vs. stimulus B in late block 2 (difference in response strength between expected C4 or D4 and B2 divided by the sum of responses to both stimuli) for all boutons responsive to at least one of the visual stimuli in late block 2. −1 indicates only responsive to B, +1 only responsive to C or D, and 0 equal responses to both. Right: same as on the left but for response selectivity to stimulus C or D vs. stimulus A in late block 2. k, Mean responses to expected (blue) and unexpected (red) stimuli C4 or D4, of boutons selective to A or B (left, n = 512 boutons; P < 1 × 10⁻⁴; Hierarchical bootstrapping test), and non-selective (selectivity towards C, compared to B < 0.6, middle, n = 200 boutons; P = 0.0049) and highly selective (selectivity towards C, compared to B > 0.8, right, n = 191 boutons; P = 0.0032) grating C4 responsive neurons in late block 2. Bars and error bars are mean and 95% bootstrap CI. l, Distribution of selectivity index (difference in response strength between expected C4 or D4 and B2 divided by the pooled standard deviation, see methods) for all pulvinar boutons. m, Distribution of stimulus response strength of non-selective (selectivity index C4/D4, compared to B2 < 0.6, left) and highly selective (selectivity index > 0.8, right) pulvinar boutons to unexpected C4 or D4 (red) and expected C4 or D4 (blue). n, Cell- and trial-averaged stimulus responses to expected C4 or D4 (blue) and unexpected C4 or D4 (red), of non-selective (left) and highly selective (right) pulvinar boutons. n = 1,790 and n = 99; P < 1 × 10⁻⁴, P = 0.0049; non-selective and highly selective boutons, hierarchical bootstrapping test. Bars and error bars are mean and 95% bootstrap CI.
Extended Data Fig. 8
Extended Data Fig. 8. Activity of VIP interneurons and pulvinar input is required for prediction error signals to familiar visual stimulus presented at unexpected location.
a, Schematic of the experimental design. For the experiments in this figure a shorter virtual corridor was employed as depicted. b, Calcium activity of VIP cells in V1 layer 2/3 was recorded during the experiment. c, Single-cell responses for all VIP cells (individual rows) in the A session (n = 289 cells from 5 mice) to expected B2 (left), unexpected A2 (middle) and expected A1 (right), sorted by response strength to unexpected A2. d, Cell- and trial-averaged calcium responses of all VIP cells (n = 289) to expected B2 (black), unexpected A2 (red) and expected A1 (blue). Lines and bars are mean, shading and error bars indicate bootstrap 95% CI. P < 1 × 10⁻⁴ for all comparisons between expected and unexpected stimuli; Hierarchical bootstrapping test with Bonferroni correction. e, Schematic of the experiment. Calcium activity of V1 layer 2/3 cells was recorded while VIP cells were optogenetically silenced. VIP cell silencing started at the onset of visual stimuli and lasted for 3 s. f, Top: cell- and trial-averaged responses of V1 neurons significantly responsive to the presented grating stimuli to expected grating B2 (left, P = 0.98, Hierarchical bootstrapping test, n = 69 cells, 5 mice), unexpected grating A2 (middle, P < 1 × 10⁻⁴, n = 179) and expected grating A1 (right, P = 0.11, n = 118) with (amber) or without (black) VIP silencing. Lines and shading are mean and bootstrap 95% CI. Bottom: responses of individual neurons to the grating stimulus indicated above during VIP silencing (LED on), plotted against responses to the same stimulus in control trials (LED off). g-i, Same as b-d, but for calcium responses of pulvinar axonal boutons in V1 (see Methods). g, Calcium activity of axonal boutons of pulvinar projections was recorded in V1 layer 1. h, Single-bouton responses for all pulvinar axonal boutons (individual rows) in the A session (n = 1,453 boutons, 6 mice) to expected B2 (left), unexpected A2 (middle) and expected A1 (right), sorted by response strength to unexpected A2. i, Bouton- and trial-averaged calcium responses of all pulvinar boutons (n = 1,453 boutons) to expected grating B2 (black), unexpected grating A2 (red) and expected grating A1 (blue). Lines and bars are mean, shading and error bars indicate bootstrap 95% CI. P < 1 × 10⁻⁴ for all comparisons between expected and unexpected stimuli; Hierarchical bootstrapping test with Bonferroni correction. j and k, Same as e and f, but with optogenetic silencing of pulvinar axons. j, The activity of V1 layer 2/3 cells was recorded while pulvinar axons in V1 were optogenetically silenced (see Methods). k, Top: cell- and trial-averaged responses of neurons significantly responsive to the presented grating stimuli to expected grating B2 (left, P = 0.39, Hierarchical bootstrapping test, n = 36 cells, 5 mice), unexpected grating A2 (middle, P = 0.033, n = 66) and expected grating A1 (right, P = 0.44, n = 57) with (amber) or without (black) silencing of pulvinar axons. Lines and shading are mean and bootstrap 95% CI. Bottom: responses of individual neurons to the grating stimulus indicated above during silencing of pulvinar axons (LED on), plotted against responses to the same stimulus in control trials (LED off).
Extended Data Fig. 9
Extended Data Fig. 9. Confirmation of optogenetic silencing and control experiment for LED light stimulation.
a, Schematic of the experimental design. Calcium activity of VIP cells in V1 was recorded while they were optogenetically silenced. b, Cell- and trial-averaged responses of VIP cells to unexpected stimulus A2 (familiar stimulus at unexpected position; left, n = 289 from 5 mice) and unexpected stimulus C2 (right, n = 213 from 5 mice) with (amber) or without (black) VIP silencing. Lines and shading are mean and bootstrap 95% CI. c, Responses to unexpected A2 (left, n = 289, P < 1 × 10⁻⁴) and unexpected C2 (right, n = 213, P < 1 × 10⁻⁴) stimuli with (amber) and without (grey) VIP silencing. Hierarchical bootstrapping test. Bars and error bars are mean and 95% bootstrap CI. d, Schematic of the experimental design. Calcium activity of pulvinar boutons was recorded while they were optogenetically silenced during presentation of differently oriented, drifting grating stimuli (see Methods). e, Cell- and trial-averaged responses of all pulvinar boutons to all grating directions (left, n = 1,135 from 5 sessions, 3 mice) and of visually responsive boutons to the preferred grating direction (right, n = 198 from 5 sessions, 3 mice) with (amber) or without (black) pulvinar axonal silencing. Lines and shading are mean and bootstrap 95% CI. f, Responses of grating responsive boutons to preferred direction with (amber) and without (grey) pulvinar axonal silencing (n = 198, P = 0.014). Hierarchical bootstrapping test. Bars and error bars are mean and 95% bootstrap CI. g, Schematic of the experimental design. Calcium activity of V1 layer 2/3 cells was recorded during light stimulation without expression of opsins. mCherry was expressed in pulvinar neurons. h, Top: cell- and trial-averaged responses to expected stimulus A3 or B4 (left), unexpected stimulus C4 or D4 (middle) and expected C4 or D4 (right) with or without light stimulation (amber and black, respectively). Lines and shading are mean and bootstrap 95% CI (n = 49, 195, 82, 3 mice; P = 0.14, P = 0.51, P = 0.15; for expected A3 or B4 responsive cells, unexpected C4 or D4 responsive cells, and expected C4 or D4 responsive cells; Hierarchical bootstrapping test). Bottom: Responses of individual V1 neurons to stimuli indicated above with and without LED light stimulation (LED on vs LED off).
Extended Data Fig. 10
Extended Data Fig. 10. Effect of optogenetic silencing of VIP interneurons or pulvinar input to V1 in C and D sessions.
Related to Fig. 3. a-e, Same as Fig. 3e–g, but C session (b and c) and D session (d and e) are plotted separately. a, Schematic of the experiment. Calcium activity of V1 layer 2/3 cells was recorded while VIP cells were optogenetically silenced in 50% of trials. VIP cell silencing started at the onset of visual stimuli and lasted for 3 s. b, Top: cell- and trial-averaged responses of neurons significantly responsive to the presented stimuli to expected grating A3 or B4 (left, P = 0.83, Hierarchical bootstrapping test, n = 32 cells, 4 mice), unexpected grating C4 (middle, P < 1 × 10⁻⁴, n = 123) and expected grating C4 (right, P = 0.0024, n = 42) with (amber) or without (black) VIP silencing. Lines and shading are mean and bootstrap 95% CI. Bottom: responses of individual V1 neurons to the grating stimulus indicated above during VIP silencing (LED on), plotted against responses to the same stimulus in control trials (LED off). c, Effect of VIP neuron silencing (LED on - LED off during unexpected grating C4) plotted against the strength of prediction error signals (response to unexpected C4 - response to expected C4). Pearson correlation: r = −0.85, P = 8.5 × 10⁻³⁵. d, Top: cell- and trial-averaged responses of neurons significantly responsive to the presented stimuli to expected A3 or B4 (left, P = 0.11, Hierarchical bootstrapping test, n = 55 cells, 3 mice), unexpected D4 (middle, P < 1 × 10⁻⁴, n = 446) and expected D4 (right, P < 1 × 10⁻⁴, n = 181) with (amber) or without (black) VIP silencing. Lines and shading are mean and bootstrap 95% CI. Bottom: responses of individual neurons to the visual stimulus indicated above during VIP silencing (LED on), plotted against responses to the same stimulus in control trials (LED off). e Effect of VIP neuron silencing (LED on - LED off during unexpected stimulus D4) plotted against the strength of prediction error signals (response to unexpected D4 - response to expected D4). Pearson correlation: r = −0.66, P = 1.3 × 10−57. f, Effect of VIP neuron silencing (LED on - LED off during unexpected C4 or D4) plotted against response to expected C4 or D4 for individual V1 neurons; n = 569. Pearson correlation: r = −0.27, P = 4.8 × 10⁻¹¹. g, Response to unexpected C4 or D4 with VIP silencing plotted against response to expected C4 or D4 without VIP silencing; n = 569. Pearson correlation: r = 0.81, P = 2.1 × 10−133. h, Strength of prediction error signal (response to unexpected C4 or D4 - response to expected C4 or D4) with VIP silencing plotted against strength of prediction error signal without VIP silencing; n = 569. Pearson correlation: r = 0.76, P = 8.5 × 10−109. i-p, Same as a-h but for optogenetic silencing of pulvinar inputs. i, Calcium activity of V1 layer 2/3 cells was recorded while pulvinar inputs were optogenetically silenced in 50% of trials. j, Expected grating A3 or B4 (left, P = 0.21, Hierarchical bootstrapping test, n = 120 cells, 7 mice), unexpected grating C4 (middle, P < 1 × 10⁻⁴, n = 301) and expected grating C4 (right, P = 0.77, n = 92) responses with (amber) or without (black) pulvinar axon silencing. k, n = 301 cells. Pearson correlation: r = −0.47, P = 1.1 × 10⁻¹⁷. l, Expected stimuli A3 or B4 (left, P = 0.17, Hierarchical bootstrapping test, n = 38 cells, 2 mice), unexpected D4 (middle, P < 1 × 10⁻⁴, n = 227) and expected D4 (right, P = 0.027, n = 94) responses with (amber) or without (black) VIP silencing. m, n = 227. Pearson correlation: r = −0.56, P = 6.3 × 10⁻²⁰. n, n = 528. Pearson correlation: r = −0.0052, P = 0.23. o, n = 528. Pearson correlation: r = 0.55, P = 7.7 × 10−43. p, n = 528. Pearson correlation: r = 0.91, P = 2.0 × 10−198.
Extended Data Fig. 11
Extended Data Fig. 11. Effect of optogenetic manipulation of pulvinar inputs, VIP cells and SOM cells on running speed and visual responses of V1 layer 2/3 cells (related to Fig. 4).
a-e, Running speed with (amber) or without (black) optogenetic manipulation for activation of pulvinar axons (a), activation of VIP neurons (b), co-activation of pulvinar axons and VIP neurons (c), activation of pulvinar axons and simultaneous silencing of SOM cells (d), and silencing of SOM cells (e). Top: Lines and shading are mean and bootstrap 95% CI. Orange shading indicates time of optogenetic stimulation. Bottom: Data from the individual animals are shown separately. Data from the same animals are connected by lines. Black horizontal bars represent mean across animals. P-values from two-sided signed-rank test. f-i, Same as Fig. 4d, but optogenetic stimulation was paired with the grating stimulus A3 instead of B2. f, Schematic of the experimental design. The activity of V1 layer 2/3 cells was recorded while pulvinar axons and VIP cells were optogenetically co-stimulated. Stimulation started 0.1 s after visual stimulus onset and lasted for 1 s (see methods). g, Response strength to grating stimulus A3 with and without co-stimulation of pulvinar inputs and VIP cells. n = 217 grating A or B responsive cells, 6 sessions from 6 mice. Inset: Cell-averaged calcium responses with (amber) or without (black) optogenetic stimulation. h, Effect of optogenetic stimulation (difference of response to grating A3 with and without laser stimulation) plotted against response selectivity (difference in response strength between stimulus A and B divided by the sum of responses) of individual V1 neurons. i, Calcium response strength to grating stimulus A3 of B selective cells (left, n = 6 mice, P = 0.84), and non-selective (selectivity A vs B < 0.6, middle, n = 6 mice, P = 0.44, two-sided signed-rank test) and highly selective (selectivity A vs B > 0.8, right, n = 6 mice, P = 0.031, two-sided signed-rank test) grating A3 responsive cells in V1 layer 2/3 with (amber) or without (grey) optogenetic stimulation. j-m, Same as f-i, but for optogenetic silencing of SOM cells during presentation of grating stimulus B2. j, Schematic of the experimental design. The activity of V1 layer 2/3 cells was recorded while SOM cells were optogenetically silenced for 3 s, starting at grating stimulus onset. k, Grating B2 responses with and without the silencing of SOM cells. n = 179 grating A or B responsive cells, 5 sessions from 3 mice, P < 1 × 10⁻⁴, Hierarchical bootstrapping test. l, Effect of optogenetic stimulation (difference of response to grating B2 with and without laser stimulation) plotted against response selectivity (difference in response strength between stimulus B and A divided by the sum of responses) of individual V1 neurons. m, Calcium response strength to grating stimulus B2 of A-selective neurons (left, n = 5 sessions from 3 mice, P = 0.19), and non-selective (selectivity B vs A < 0.6, middle, n = 5 sessions from 3 mice, P = 0.81, two-sided signed-rank test) and highly selective (selectivity B vs A > 0.8, right, n = 5 sessions from 3 mice, P = 0.25, two-sided signed-rank test) grating B2 responsive cells in V1 layer 2/3 with (amber) or without (grey) optogenetic stimulation.
Extended Data Fig. 12
Extended Data Fig. 12. Effect of optogenetic stimulation of pulvinar inputs on visual responses of VIP cells in V1 layer 2/3, and expression of ChrimsonR-tdTomato and LED effect of individual animals used in Fig. 5.
a, Schematic of the experimental design. The activity of VIP cells was recorded while pulvinar axons were optogenetically stimulated for 3 s, starting at the onset of the visual stimulus. b, Single-cell responses of pulvinar-recruited VIP cells (individual rows, n = 69 cells, 7 sessions from 5 mice) and other non-recruited VIP cells (individual rows, n = 310 cells, 7 sessions from 5 mice) to expected B4, unexpected C4 or D4 and expected C4 or D4 stimuli with (right) and without (left) optogenetic stimulation (see Methods). c, Cell-averaged calcium responses with (amber) or without (black) optogenetic stimulation of pulvinar-recruited and other non-recruited VIP cells. Lines and shaded regions are mean and bootstrap 95% CI. d, Visual stimulus responses of individual VIP neurons without optogenetic stimulation plotted against the effect of pulvinar stimulation (difference of visual responses with and without optogenetic stimulation). e, Strength of calcium response to expected B4 (black), unexpected C4 or D4 (red) and expected C4 or D4 (blue) stimuli of pulvinar-recruited VIP cells (left, n = 69, B4 vs unexpected C4/D4: P < 10−4; unexpected vs expected C4/D4: P < 10−4, Hierarchical bootstrapping test with Bonferroni correction) and other VIP cells (right, n = 310, B4 vs unexpected C4/D4: P < 10−4; unexpected vs expected C4/D4: P < 10−4, Hierarchical bootstrapping test with Bonferroni correction). 7 sessions from 5 mice. Bars and error bars indicate mean and 95% bootstrap CI. f, Responses to expected B4 (left), unexpected C4 or D4 (middle) and expected C4 or D4 (right) stimuli with (amber) and without (black) pulvinar stimulation. n = 379 cells from 7 sessions, 5 mice, LED on vs off during expected B4 stimulus: P < 1 × 10⁻⁴; LED on vs off during unexpected C4 or D4 stimulus, P = 4.0 × 10⁻⁴; LED on vs off during expected C4 or D4 stimulus, P = 0.48; Hierarchical bootstrapping test. Bars and error bars are mean and 95% bootstrap CI. g, Coronal slice through the pulvinar injection site (LP, right) and through the laterodorsal nucleus of thalamus (LD, left), showing specific expression of ChrimsonR-tdTomato (red) in LP, not in LD. Scale bars: 100 μm. h, Same as Fig. 5d, but plotted for individual mice. Visual stimulus responses of individual SOM neurons to expected B4 stimulus (left), unexpected C4 or D4 stimulus (middle, in block 1) and expected C4 or D4 stimulus (right, in late block 2) plotted against the effect of pulvinar stimulation (difference in strength of visual stimulus responses with and without optogenetic pulvinar axon stimulation) for recruited (brown) and other (black) SOM cells.

References

    1. Schultz, W. & Dickinson, A. Neuronal coding of prediction errors. Annu. Rev. Neurosci.23, 473–500 (2000). 10.1146/annurev.neuro.23.1.473 - DOI - PubMed
    1. Starkweather, C. K., Babayan, B. M., Uchida, N. & Gershman, S. J. Dopamine reward prediction errors reflect hidden-state inference across time. Nat. Neurosci.20, 581–589 (2017). 10.1038/nn.4520 - DOI - PMC - PubMed
    1. Lowet, A. S., Zheng, Q., Matias, S., Drugowitsch, J. & Uchida, N. Distributional reinforcement learning in the brain. Trends Neurosci.43, 980–997 (2020). 10.1016/j.tins.2020.09.004 - DOI - PMC - PubMed
    1. Wolpert, D. M., Miall, R. C. & Kawato, M. Internal models in the cerebellum. Trends Cogn. Sci.2, 338–347 (1998). 10.1016/S1364-6613(98)01221-2 - DOI - PubMed
    1. Mumford, D. On the computational architecture of the neocortex. II. The role of cortico-cortical loops. Biol. Cybern.66, 241–251 (1992). 10.1007/BF00198477 - DOI - PubMed

MeSH terms

LinkOut - more resources