Case Reports
. 2024 Sep;633(8029):417-425.
doi: 10.1038/s41586-024-07866-3. Epub 2024 Aug 28.

Tuberculosis in otherwise healthy adults with inherited TNF deficiency

Andrés A Arias #  1   2   3 Anna-Lena Neehus #  4   5 Masato Ogishi  3 Vincent Meynier  6   7 Adam Krebs  8   9 Tomi Lazarov  8   9 Angela M Lee  9   10 Carlos A Arango-Franco  1   6   7 Rui Yang  3 Julio Orrego  1 Melissa Corcini Berndt  6   7 Julian Rojas  1 Hailun Li  6   7 Darawan Rinchai  3 Lucia Erazo-Borrás  1   6   7 Ji Eun Han  3 Bethany Pillay  11   12 Khoren Ponsin  3 Matthieu Chaldebas  3   7 Quentin Philippot  6   7 Jonathan Bohlen  6   7 Jérémie Rosain  6   7   13 Tom Le Voyer  6   7   14 Till Janotte  6   7 Krishnajina Amarajeeva  6   7 Camille Soudée  6   7 Marion Brollo  15 Katja Wiegmann  16 Quentin Marquant  15 Yoann Seeleuthner  6   7 Danyel Lee  3   6   7 Candice Lainé  6   7 Doreen Kloos  17   18 Rasheed Bailey  3 Paul Bastard  3   6   7   19 Narelle Keating  3   20   21 Franck Rapaport  3 Taushif Khan  22 Marcela Moncada-Vélez  1   3 María Camila Carmona  1 Catalina Obando  1 Jesús Alvarez  1 Juan Carlos Cataño  23 Larry Luber Martínez-Rosado  24 Juan P Sanchez  1 Manuela Tejada-Giraldo  1 Anne-Sophie L'Honneur  25 María L Agudelo  1 Lizet J Perez-Zapata  1 Diana M Arboleda  1 Juan Fernando Alzate  26 Felipe Cabarcas  26   27 Alejandra Zuluaga  28 Simon J Pelham  3 Armin Ensser  29 Monika Schmidt  29 Margarita M Velásquez-Lopera  30   31 Emmanuelle Jouanguy  3   6   7 Anne Puel  3   6   7 Martin Krönke  16   32 Stefano Ghirardello  33 Alessandro Borghesi  33   34 Susanta Pahari  35 Bertrand Boisson  3   6   7 Stefania Pittaluga  36 Cindy S Ma  11   12 Jean-François Emile  37 Luigi D Notarangelo  38 Stuart G Tangye  11   12 Nico Marr  39   40 Nico Lachmann  17   18   41   42 Hélène Salvator  14   43   44 Larry S Schlesinger  35 Peng Zhang  3   6   7 Michael S Glickman  8   9 Carl F Nathan  9   10 Frédéric Geissmann  8   9 Laurent Abel  3   6   7 José Luis Franco  45 Jacinta Bustamante  3   6   7   13 Jean-Laurent Casanova  46   47   48   49   50 Stéphanie Boisson-Dupuis  3   6   7
Affiliations
Case Reports

Tuberculosis in otherwise healthy adults with inherited TNF deficiency

Andrés A Arias et al. Nature. 2024 Sep.

Abstract

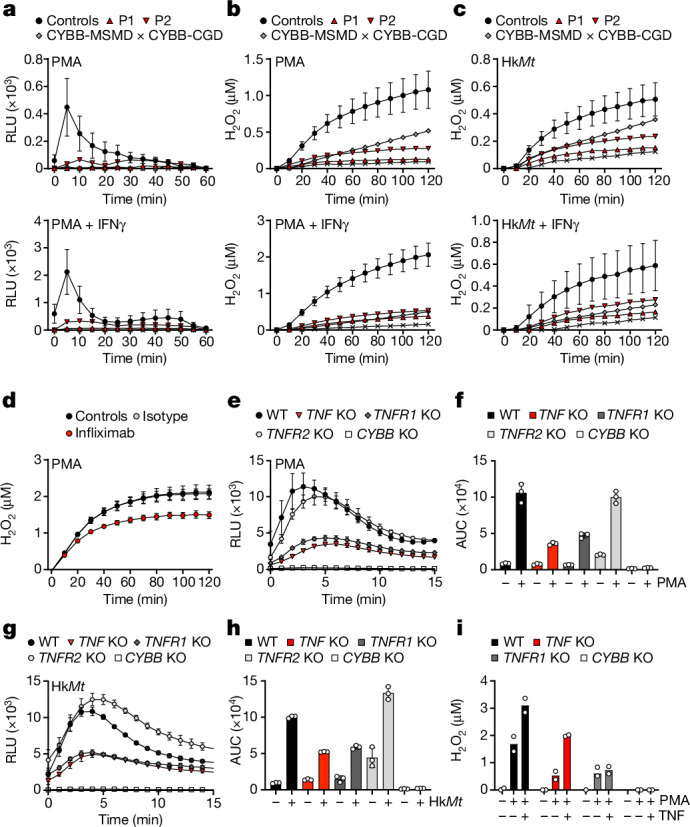
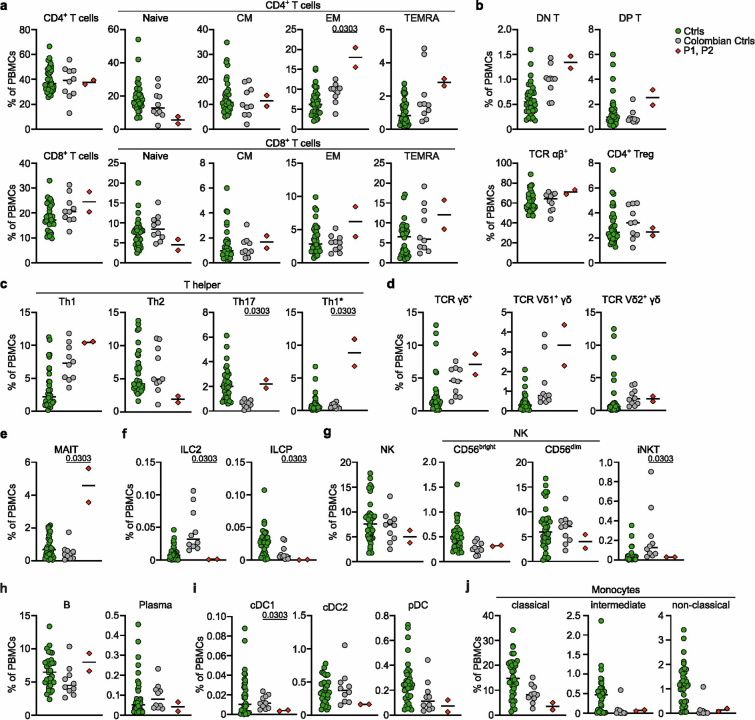
Severe defects in human IFNγ immunity predispose individuals to both Bacillus Calmette-Guérin disease and tuberculosis, whereas milder defects predispose only to tuberculosis1. Here we report two adults with recurrent pulmonary tuberculosis who are homozygous for a private loss-of-function TNF variant. Neither has any other clinical phenotype and both mount normal clinical and biological inflammatory responses. Their leukocytes, including monocytes and monocyte-derived macrophages (MDMs) do not produce TNF, even after stimulation with IFNγ. Blood leukocyte subset development is normal in these patients. However, an impairment in the respiratory burst was observed in granulocyte-macrophage colony-stimulating factor (GM-CSF)-matured MDMs and alveolar macrophage-like (AML) cells2 from both patients with TNF deficiency, TNF- or TNFR1-deficient induced pluripotent stem (iPS)-cell-derived GM-CSF-matured macrophages, and healthy control MDMs and AML cells differentiated with TNF blockers in vitro, and in lung macrophages treated with TNF blockers ex vivo. The stimulation of TNF-deficient iPS-cell-derived macrophages with TNF rescued the respiratory burst. These findings contrast with those for patients with inherited complete deficiency of the respiratory burst across all phagocytes, who are prone to multiple infections, including both Bacillus Calmette-Guérin disease and tuberculosis3. Human TNF is required for respiratory-burst-dependent immunity to Mycobacterium tuberculosis in macrophages but is surprisingly redundant otherwise, including for inflammation and immunity to weakly virulent mycobacteria and many other infectious agents.


Conflict of interest statement

The authors declare no competing interests.

Figures

Fig. 1
Fig. 1. Identification of a biallelic TNF variant in two patients with pulmonary TB.
a, Pedigree of two related kindreds showing familial segregation of the c.190_191ins20 (p.P64Lfs*13) TNF allele. Each generation is designated by a Roman numeral. Male and female individuals are represented by squares and circles, respectively. The filled boxes indicate individuals affected by TB and the crossed symbols indicate deceased individuals. ‘E?’ indicates an unknown TNF genotype. Red ‘M’ indicates the variant allele. The triangles indicate spontaneous abortion and the diamond indicates the death of an individual of unknown sex. b, Chest contrasted CT scan showing the pulmonary lesions of P1. c, Ziehl–Neelsen staining of a pulmonary biopsy specimen from P1 showing acid-fast bacilli (arrow). Data shown are representative of one independent experiment. d, Haematoxylin and eosin staining of a granuloma from P1 at different magnifications. Data shown are representative of one independent experiment. Scale bars, 2 mm, 200 µm and 50 µm (from left to right). e, Immunohistochemical staining for CD3, CD4 and CD8, indicating the presence of T cells within the granuloma of P1. Data shown are representative of one independent experiment. Scale bars, 200 µm. f, Schematic of the full-length and cleaved TNF proteins, with the intracellular (IC), transmembrane (TM) and extracellular (EC) domains indicated. The red part of the mutant TNF protein (P64Lfs*13) corresponds to the amino acids inserted due to the frameshift variant. aa, amino acids. N term. and C term., N-terminal and C-terminal fragments. g, The minor allele frequency (MAF; gnomAD, v.2.1.1) and combined annotation-dependent depletion (CADD; v.1.6) score for biallelic non-synonymous TNF variants reported in gnomAD v.2.1.1 or found in P1 and P2. The MSC is indicated by a dotted line.
Fig. 2
Fig. 2. The patients’ variant results in the loss of TNF production.
a, NF-κB-luciferase reporter activity in HEK293T cells stimulated with recombinant human TNF (rhTNF) or supernatants from HEK293T cells transfected with the patients’ TNF variant or variants present in the homozygous state in gnomAD v.2.1. Data are mean ± s.d. from three independent experiments. EV, empty vector; NT, not transfected; SN, supernatant. b, Western blot analysis of supernatants and whole-cell lysates (WCL) from EBV-B and HVS-T cells from healthy controls and P1 with and without PMA and ionomycin (P/I) stimulation. Representative image from three independent experiments. c, Detection of intracellular TNF by flow cytometry in EBV-B cells (n = 7) and HVS-T cells (n = 3) from healthy controls and P1 without (NS) or with PMA and ionomycin stimulation. Data are mean ± s.d. from two independent experiments. d, TNF production by EBV-B cells from a healthy control or P1 left untransduced (UT), or transduced with an EV or with plasmids encoding WT or variant TNF, with or without PMA and ionomycin stimulation. Data are mean ± s.d. from two independent experiments. e, NF-κB-luciferase reporter activity in HEK293T cells stimulated for 24 h with recombinant human TNF or supernatants of transduced EBV-B cells as in d. Data are mean ± s.d. from three independent experiments. f, The frequency of cells producing TNF and IL-1β in response to LPS, BCG or L. monocytogenes (Lm) for the indicated subsets from P1, her brother and healthy controls (n = 4). Data of healthy controls (n = 4) are mean ± s.d. mDCs, myeloid dendritic cells. g, Secretion of TNF and IL-1β by total PBMCs from P1, her brother and healthy controls (n = 5) after stimulation with LPS, BCG or L. monocytogenes. Significance was assessed using two-tailed Mann–Whitney U tests, comparing between the WT and the patients’ variant (a and e).
Fig. 3
Fig. 3. Reduced NADPH oxidase activity in TNF-deficient GM-CSF-matured macrophages.
a, The production of O2, in relative luminescence units (RLU), by MDMs matured in the presence of GM-CSF for healthy controls (n = 5), patients with TNF deficiency (P1, P2) and patients with variants in CYBB underlying MSMD (n = 1) or CGD (n = 1), after stimulation with PMA with or without IFNγ. Data of healthy controls (n = 5) are mean ± s.d. b,c, The extracellular production of H2O2 in GM-CSF-matured MDMs for healthy controls (n = 5), patients with TNF deficiency (P1 and P2) and patients with variants in CYBB underlying MSMD (n = 1) or CGD (n = 1), after stimulation with PMA (b) or in response to serum-opsonized heat-killed M. tuberculosis (hkMt) (c) with or without IFNγ. Data of healthy controls (n = 5) are mean ± s.d. d, H2O2 release by GM-CSF-matured MDMs from healthy controls differentiated in culture medium in the presence of infliximab or the corresponding isotype control. One representative experiment of two independent experiments with three biological replicates. Data are mean ± s.d. e, O2 production in response to PMA stimulation by iPS-cell-derived macrophages and iPS-cell-derived macrophages gene-edited to KO TNF, TNFR1, TNFR2 or CYBB expression. One representative experiment of three independent experiments with three biological replicates. Data are mean ± s.d. f, Area-under-the-curve (AUC) analysis of O2 production by iPS-cell-derived macrophages as in e with or without PMA stimulation. Data are mean ± s.d. of three independent experiments. g, O2 production by iPS-cell-derived macrophages in response to stimulation with heat-killed M. tuberculosis. One representative experiment of three independent experiments with three biological replicates. Data are mean ± s.d. h, AUC analysis of O2 production by iPS-cell-derived macrophages as in g with or without stimulation with heat-killed M. tuberculosis. Data are mean ± s.d. of three independent experiments. i, Extracellular H2O2 release by iPS-cell-derived macrophages in response to PMA with or without TNF. n = 2 independent experiments.
Fig. 4
Fig. 4. Loss of TNF signalling in AML cells and lung macrophages impairs NADPH oxidase activity.
a,b, Extracellular H2O2 release in AML cells from healthy controls (n = 3) or patients (n = 2) after stimulation with PMA alone (a) or in combination with IFNγ (b). Data are mean ± s.d. and are representative of two independent experiments. c, The production of O2 (RLU) by AML cells treated with infliximab or isotype control for 24 h before stimulation with PMA. Data representative of n = 3 biological replicates are shown. d, AUC analysis of O2 production by AML cells (n = 3) in response to PMA with or without stimulation with IFNγ or TNF. e, Extracellular H2O2 release by AML cells treated as in c. Data are mean ± s.d. and are representative of six independent experiments. f, H2O2 release by AML cells (n = 6) after 30 min of stimulation treated as in d. g, The production of O2 by lung macrophages treated as in c. Data representative of n = 3 biological replicates are shown. h, AUC analysis of O2 production by lung macrophages (n = 3) treated as in c in response to PMA with or without IFNγ stimulation. i, Extracellular H2O2 release by lung macrophages (n = 2–3) after 30 min of treatment as in c. Cells were stimulated with IFNγ for 24 h or with PMA at the indicated doses at the start of the experiment. Significance was assessed using paired two-tailed t-tests (d and f).
Fig. 5
Fig. 5. The role of TNF against L. monocytogenes and M. tuberculosis.
a, GM-CSF-matured MDMs from two healthy controls and P1 or P2 were stimulated with TNF for 24 h or left unstimulated and were then infected with L. monocytogenes. The floating bars depict the minimum and maximum values and the median is indicated. n = 4 technical replicates. b, GM-CSF-matured MDMs from healthy controls were derived in the presence of infliximab (IFX), or the corresponding isotype (iso) control, or were stimulated with TNF and then infected with L. monocytogenes as in a. The floating bars show the minimum and maximum values, and the median of three independent experiments is indicated. c, AML cells from healthy controls (n = 3), and the two patients with TNF deficiency were either left unstimulated or were stimulated with TNF and infected with live M. tuberculosis. Data are mean ± s.d. d, GSEA of resting AML cells from patients (n = 2) and controls (n = 3) with the 50 hallmark gene set. Results are shown for selected immune-related gene sets. NES, normalized enrichment score. P values were estimated using fgsea gene set enrichment based on an adaptive multilevel split Monte Carlo scheme. e, The log2-transformed fold change (FC) difference in expression for genes that are differentially expressed between the AML cells of patients and healthy controls in response to M. tuberculosis. NI, not infected. f, Cytokine concentrations in the supernatants from the AML cells of controls (n = 3) and patients (n = 2) either non-infected or infected with M. tuberculosis, with or without TNF. Data are mean ± s.d. g, The log2-transformed fold change difference in mRNA levels after stimulation with TNF in combination with M. tuberculosis infection for transcripts differentially expressed between infected and non-infected conditions. Significance was assessed using two-tailed paired t-tests (b).
Extended Data Fig. 1
Extended Data Fig. 1. Immunological and genetic features of human TNF deficiency.
a, Heatmap indicating scores equivalent to the count of peptides displaying significant enrichment for a given species in serum samples from healthy controls, P1, P2 and their relatives. IgG-depleted serum (IgGDepleted) and pooled plasma used for intravenous immunoglobulin (IVIG) therapy were used as negative and positive controls, respectively. b, Luciferase-based neutralization assay for the detection of auto-Abs neutralizing IFN-α2, IFN-ω and IFN-ß in plasma from healthy controls (HD; n = 18), P1 and P2, and individuals known to have neutralizing auto-Abs (C+; n = 3). The dashed line indicates the threshold for neutralizing activity. c, Detection of auto-Abs against IFN-γ in plasma from healthy controls (n = 9), P1, P2 and an individual known to have anti-IFN-γ auto-Abs (C+). d, Detection of auto-Abs against IL-12p70 and IL-23 in plasma from healthy controls (n = 9), P1and P2. Monoclonal antibodies (mAb) against IL-12p40 and IL-12p70 were used as positive controls. e, Detection of auto-Abs against TNF in plasma from healthy controls (n = 9), P1 and P2. f, Principal component (PC) analysis on WES data from P1, P2, our in-house database, and samples from the 1000 Genomes Project. g, WES analysis of P1 and P2, with homozygosity rates (HR) indicated. LOF, loss-of-function h, Linkage analysis. An arrow indicates the chromosome on which the TNF gene is located. i, Sanger sequencing of the region containing the TNF variant for a wild-type healthy control and P1.
Extended Data Fig. 2
Extended Data Fig. 2. The patients’ variant results in conserved mRNA production and a loss of soluble TNF.
a, Western blot of whole-cell lysates (WCL) from HEK293T cells transfected with plasmids encoding wild-type or variant TNF. NT, not transfected; EV, empty vector. The results shown are representative of three independent experiments. b, TNF detection by bead-based immunoassay on supernatants from HEK293T cells transfected as in (a). Data are mean ± s.d. from two independent experiments. c, TNF expression assessed by RT-qPCR on cDNA from EBV-B cells from P1 and healthy controls (n = 3) left non-stimulated (NS) or stimulated with PMA-ionomycin (P/I). Data are mean ± s.d. from three independent experiments. d, Agarose gel showing TNF amplification from cDNA from the EBV-B cells of a healthy control or P1 with or without stimulation. Data shown are representative of three independent experiments.
Extended Data Fig. 3
Extended Data Fig. 3. TNF production by the patients’ primary cells.
a, Gating strategy related to Fig. 2e for identification of the dendritic cell (DC) and monocyte subsets. b, TNF production by classical monocytes from a local control (Ctrl), P1 and P2 and the healthy brother of P1 without (NS) and with stimulation with LPS, BCG or L. monocytogenes (L.m). c, TNF secretion into whole blood after stimulation with BCG or IFN-γ for healthy controls (n = 22), P1 and P2. d, IL-6 secretion by total PBMCs from P1, her brother and healthy controls (n = 5) after stimulation with LPS, BCG or L.m. Error bars indicate the mean ± s.d. e, Frequency of TNFR1+ and TNFR2+ cells in the indicated subsets of PBMCs from healthy controls (n = 8), and TNF-deficient patients. Error bars indicate the mean ± s.d. f, Frequency of TNF+ cells in the indicated subsets of PBMCs with and without stimulation with BCG, for healthy controls (n = 22), P1 and P2. mDC, myeloid dendritic cells; MAIT, mucosal-associated invariant T cells; iNKT, invariant natural killer T cells.
Extended Data Fig. 4
Extended Data Fig. 4. Deep immunophenotyping by spectral flow cytometry for TNF-deficient patients.
Frequency of (a) CD4+ T cells and CD8+ T cells and their subsets, (b) double-negative (DN), double-positive (DP), T-cell receptor (TCR) αβ+ and regulatory T cells (Treg), (c) T helper (Th) cells and their subsets, (d) TCR γδ+ T cells, (e) mucosal-associated invariant T cells (MAIT), (f) innate lymphoid cells (ILC), (g) NK cells and their subsets, (h) B cells and plasma cells, (i) dendritic cell (DC) subsets, (j) and monocytes and their subsets in healthy adult controls (n = 36), healthy, age-matched controls from Colombia (n = 10), P1 and P2, as determined by spectral flow cytometry. CM, central memory; EM, effector memory; TEMRA, effector memory re-expressing CD45RA, ILCP, innate lymphoid cell precursor, iNKT, invariant natural killer T cells; mDC, myeloid dendritic cells; cDC, conventional dendritic cells; pDC, plasmacytoid dendritic cells. Significance was assessed using two-tailed Mann-Whitney U tests (a, c, e, f, g and i).
Extended Data Fig. 5
Extended Data Fig. 5. Production of and response to IFN-γ in PBMCs from TNF-deficient patients.
a, IFN-γ secretion into whole blood for healthy controls (n = 3), P1 and P2, with and without (NS) stimulation with IL-12, IL-23, BCG or PMA/ionomycin (P/I). Error bars indicate the mean ± s.d. b, IFN-γ secretion by PBMCs from healthy controls (n = 3), P1 and P2, after stimulation with IL-1β, IL-12, IL-23, BCG or P/I. Error bars indicate the mean ± s.d. c, UMAP clustering of PBMCs from two healthy controls, P1, P2 and an IL-12Rβ1-deficient patient profiled by flow cytometry after stimulation with BCG or BCG + IL-12. Cell populations are annotated, as are cells expressing T-bet and IFN-γ. d, Frequency of IFN-γ+ cells in the indicated subsets of PBMCs with and without stimulation with BCG or BCG + IL-12, for healthy controls (n = 22), P1 and P2. Error bars indicate the mean ± s.d. e, IL-23 secretion into whole blood for healthy controls (n = 3), P1 and P2 after stimulation with IFN-γ, IL-12 and BCG, or P/I. Error bars indicate the mean ± s.d. f, IL-12p70 secretion into whole blood after stimulation with IFN-γ, IL-23 and BCG, or P/I, for healthy controls (n = 3), P1 and P2. g, IL-12p70 production by PBMCs from healthy controls (n = 22), P1, P2 and an IL-12Rβ1-deficient patient, after stimulation with BCG, IFN-γ and IL-12.
Extended Data Fig. 6
Extended Data Fig. 6. Single-cell transcriptomic analysis of TNF-deficient leukocytes.
Cryopreserved PBMCs from P1 and P2 were analysed with cells from healthy adult controls (n = 11), one healthy Colombian control, two patients with CYBB variants (underlying MSMD or CGD) and two patients with IRF1 deficiency. a, Clustering analysis. After batch correction with Harmony, clusters were identified manually with the aid of the SingleR pipeline informed by the MonacoImmuneDataset. b, Expression levels of representative marker genes for myeloid lineage subsets. c, Cell abundance from healthy adult controls (n = 11), one Colombian control, TNF-deficient (n = 2), IRF1-deficient (n = 2) and CYBB-deficient (n = 2) patients. d, Pseudobulk principal component analysis from healthy adult controls (n = 11), one Colombian control, TNF-deficient (n = 2), IRF1-deficient (n = 2) and CYBB-deficient (n = 2) patients. e, Heat map showing the levels of expression of genes from the NPM1-target geneset in non-classical monocytes, as determined by scRNA-sequencing. Three healthy adult controls (*C1-*C3) were used for batch correction. f, Intercellular communication analysis with CellChat from healthy adult controls (n = 11), one Colombian control, TNF-deficient (n = 2), IRF1-deficient (n = 2) and CYBB-deficient (n = 2) patients. In (c, d and f), bars represent the mean and s.e.m. Data shown are representative of one independent experiment.
Extended Data Fig. 7
Extended Data Fig. 7. NADPH oxidase expression and activity in TNF-deficient phagocytes.
a, Production of O2, in relative luminescence units (RLU), by MDMs matured in the presence of M-CSF and IL-4, for healthy controls (n = 5), TNF-deficient patients, and patients with variants in CYBB underlying MSMD (n = 1) or CGD (n = 1) after stimulation with PMA with or without IFN-γ. For healthy controls (n = 5) the data are mean ± s.d. b, Extracellular production of H2O2 in M-CSF/IL-4-matured MDMs as in (a) after stimulation with PMA with or without IFN-γ. Data are mean ± s.d. c, H2O2 release by M-CSF/IL-4-matured MDMs as in (a) in response to serum-opsonized heat-killed Mtb (HkMtb) stimulation with or without IFN-γ. Data are mean ± s.d. d, Western blot of whole-cell lysates of MDMs matured by incubation with GM-CSF or M-CSF/IL-4, for healthy controls, P1, P2 and a patient with a CYBB variant underlying MSMD (CYBB-MSMD), for NADPH oxidase subunits. Data shown are representative of one independent experiment. e, Western blot for NADPH oxidase subunits on whole-cell lysates of neutrophils and monocytes from patients and controls. Data shown are representative of one independent experiment. f, Intracellular ROS production by neutrophils and monocytes, measured by DHR, after stimulation with PMA in two healthy controls, TNF-deficient patients and patients with variants in CYBB underlying MSMD (n = 1) or CGD (n = 1). Representative data from two independent experiments are shown.
Extended Data Fig. 8
Extended Data Fig. 8. Loss of TNF signalling in AML cells impairs NADPH oxidase activity in response to physiological stimuli.
a, Extracellular production of H2O2 by GM-CSF-matured MDMs from healthy controls treated with infliximab or isotype control after stimulation with (top) heat-killed Mtb (HkMtb) or (middle) live BCG. Data are mean ± s.d. and representative of three independent experiments. Bottom: H2O2 release by GM-CSF-matured MDMs (n = 3) after 30 min of stimulation. b, Production of O2, in relative luminescence units (RLU), by GM-CSF-matured MDMs from healthy controls treated with adalimumab or isotype control, stimulated as in (a). Representative data from n = 3 independent experiments are shown. Bottom: AUC analysis of O2 production by human GM-CSF-matured MDMs (n = 3) in response to HkMtb, live BCG or PMA, with IFN-γ stimulation for 24 h. c, Production of H2O2 by GM-CSF-matured MDMs from healthy controls treated as in (b) and stimulated as in (a). Data are mean ± s.d. and representative of three independent experiments. (d-e) Mitochondrial ROS levels were assessed with MitoSOX indicators in healthy control (d) GM-CSF-matured MDMs or (e) AML cells treated with infliximab or isotype control. The images shown are representative of three independent experiments. NS, not stimulated. Scale bar 20 µm. Significance was assessed by two-tailed paired (c) t-test; *p < 0.05.

References

    1. Casanova, J.-L., MacMicking, J. D. & Nathan, C. F. Interferon-γ and infectious diseases: Lessons and prospects. Science384, eadl2016 (2024). 10.1126/science.adl2016 - DOI - PubMed
    1. Pahari, S. et al. Protocol to develop human alveolar macrophage-like cells from mononuclear cells or purified monocytes for use in respiratory biology research. STAR Protoc.5, 103061 (2024). 10.1016/j.xpro.2024.103061 - DOI - PMC - PubMed
    1. Nathan, C. & Cunningham-Bussel, A. Beyond oxidative stress: an immunologist’s guide to reactive oxygen species. Nat. Rev. Immunol.13, 349–361 (2013). 10.1038/nri3423 - DOI - PMC - PubMed
    1. Casanova, J.-L. & Abel, L. From rare disorders of immunity to common determinants of infection: following the mechanistic thread. Cell185, 3086–3103 (2022). 10.1016/j.cell.2022.07.004 - DOI - PMC - PubMed
    1. Boisson-Dupuis, S. & Bustamante, J. Mycobacterial diseases in patients with inborn errors of immunity. Curr. Opin. Immunol.72, 262–271 (2021). 10.1016/j.coi.2021.07.001 - DOI - PMC - PubMed

Publication types

MeSH terms

Substances

LinkOut - more resources