. 2024 Sep;633(8028):83-89.
doi: 10.1038/s41586-024-07872-5. Epub 2024 Aug 28.

Photoredox phase engineering of transition metal dichalcogenides

Affiliations

Photoredox phase engineering of transition metal dichalcogenides

Juhwan Lim et al. Nature. 2024 Sep.

Abstract

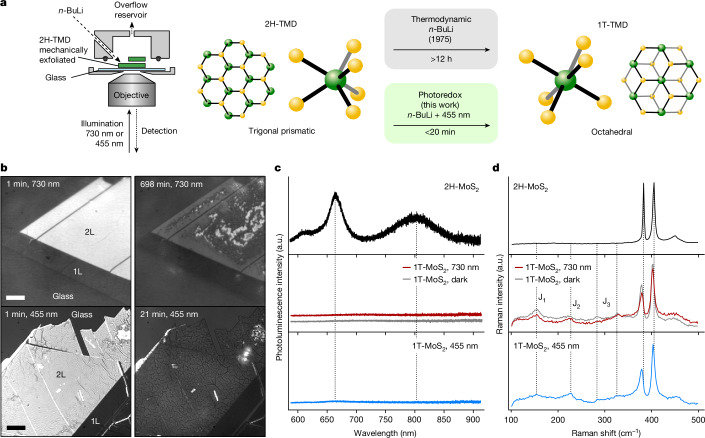
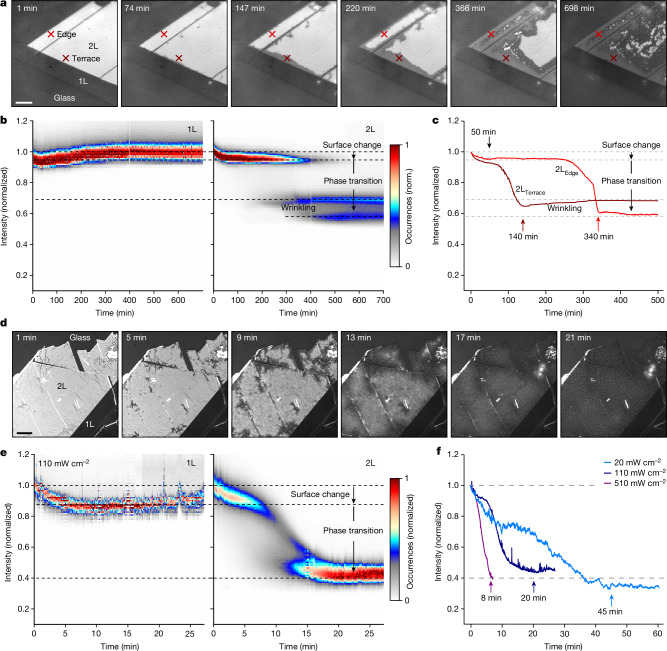
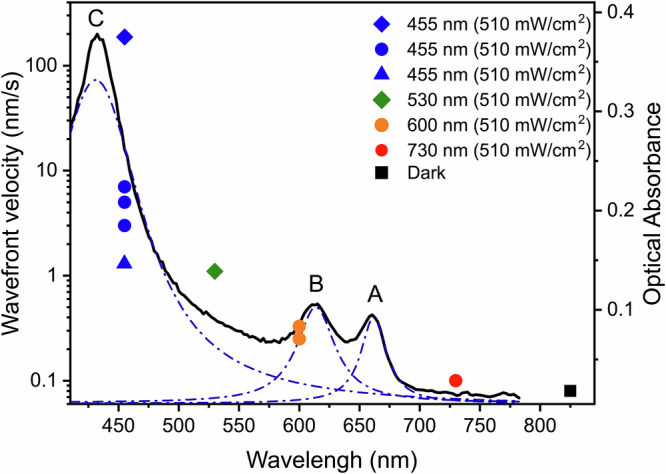
Crystallographic phase engineering plays an important part in the precise control of the physical and electronic properties of materials. In two-dimensional transition metal dichalcogenides (2D TMDs), phase engineering using chemical lithiation with the organometallization agent n-butyllithium (n-BuLi), to convert the semiconducting 2H (trigonal) to the metallic 1T (octahedral) phase, has been widely explored for applications in areas such as transistors, catalysis and batteries1-15. Although this chemical phase engineering can be performed at ambient temperatures and pressures, the underlying mechanisms are poorly understood, and the use of n-BuLi raises notable safety concerns. Here we optically visualize the archetypical phase transition from the 2H to the 1T phase in mono- and bilayer 2D TMDs and discover that this reaction can be accelerated by up to six orders of magnitude using low-power illumination at 455 nm. We identify that the above-gap illumination improves the rate-limiting charge-transfer kinetics through a photoredox process. We use this method to achieve rapid and high-quality phase engineering of TMDs and demonstrate that this methodology can be harnessed to inscribe arbitrary phase patterns with diffraction-limited edge resolution into few-layer TMDs. Finally, we replace pyrophoric n-BuLi with safer polycyclic aromatic organolithiation agents and show that their performance exceeds that of n-BuLi as a phase transition agent. Our work opens opportunities for exploring the in situ characterization of electrochemical processes and paves the way for sustainably scaling up materials and devices by photoredox phase engineering.


Conflict of interest statement

J.L., C.S. and A.R. have filed a patent application based on some aspects of this work.

Figures

Fig. 1
Fig. 1. Light-driven phase change of MoS2 during chemical lithiation.
a, Optical setup for this study and the schematic for light-driven 2H to 1T phase transition of TMD. Illumination with 455 nm accelerates the phase transition by up to two orders of magnitude. The bottom side of the flake is observed through a glass substrate, whereas the top side is in contact with the solution. b, Image of mono- (1L) and bilayer (2L) 2H-MoS2 and 1T-LixMoS2 under different illumination wavelengths. The 2H phase (left images) changed to 1T(1T/1T′) phase (right) in 698 min under illumination with 730 nm (red, top row), and 21 min with 455 nm (blue, bottom row). c,d, Photoluminescence and Raman spectra of 2L 2H-MoS2 (as exfoliated) and 1T-MoS2 produced using three different methods: 48 h n-BuLi immersion in the dark (grey), 24 h of 730 nm (below band gap) illumination (red) and 25 min of 455 nm (above band gap) illumination (blue). The higher optical resolution achieved at 455 nm shows more fine structure in the flake (see Supplementary Fig. 10 for a comparison of the same flake under 455 nm and 730 nm). Scale bar, 5 μm (b).
Fig. 2
Fig. 2. Mechanistic explanation of light-driven phase transition of MoS2 during chemical lithiation.
a, Snapshots of the phase transition visualized at 730 nm. b, Histogram analysis of the 1L (left) and 2L (right) regions. c, Selected reaction dynamics from two different points of the 2L indicated in a. Both spots are located at a similar distance (1 μm) from the edge. d, Snapshots of the phase transition visualized at 455 nm. e, Histogram analysis of the 1L (left) and 2L (right) regions. f, Power dependence of the reaction dynamics under 455 nm laser illumination for three different flakes. Each curve was obtained 1 μm away from the 2L/glass edge of the studied sample. Histograms are normalized to the mean of the intensity distribution 1 min after n-BuLi was added. Scale bar, 5 μm (a,d).
Fig. 3
Fig. 3. Photoredox phase patterning on MoS2.
a, Schematic of the photoredox phase patterning of a 1T phase pattern on 1L- and 2L-MoS2 (left). The image of the patterned flake (right) and the average across the red rectangle show the profile of the patterned 1T phase. b, Response comparison of non-patterned (2H) and photoredox-phase-patterned (1T/2H/1T) 1L-MoS2 photodetector. The bottom panel shows the ohmic-like transport behaviour by photoredox phase patterning. Scale bar, 5 μm (a).
Fig. 4
Fig. 4. Correlation of phase transition by chemical and electrochemical lithiation.
a, Chemically induced phase transition of MoS2 and WS2 observed in RICM. b, Reaction dynamics at selected points indicated in a for MoS2 and WS2 during chemical lithiation. No data were recorded for WS2 between about 220 min and 250 min. c, Electrochemical discharge/charge voltage profiles of MoS2 and WS2 versus Li/Li+. d, Energy landscape proposed for the phase transition and conversion reaction of MoS2 and WS2. The blue line shows the light-activated pathways. Arrows at the conversion barriers indicate the thermodynamic preference of the system. Scale bar, 5 μm (a).
Fig. 5
Fig. 5. Photoredox phase transition using PAH-Li system.
a, Raman spectra of PAH-Li treated MoS2 with the chemical structure of PAHs. Blue-shaded region denotes redox-matched chemicals. Anthracene-Li (green) and pyrene-Li (purple) show the 1T Raman signature identical to the n-BuLi-treated sample (blue). b, Optical image of phase transition of thick MoS2 by anthracene-Li treatment for 600 s in the dark. c, Optical image of phase transition of thick MoS2 by anthracene-Li treatment for 10 s with 445 nm illumination. Scale bar, 10 μm (b,c).
Extended Data Fig. 1
Extended Data Fig. 1. Chemical phase transition speed with respect to the illumination wavelength and power, evaluated by wavefront velocity of bilayer.
The wavefront velocity of each illumination follows left y-axis (nm/s) and black line is optical absorbance (right y-axis) (more information in Supplementary Information 5).
Extended Data Fig. 2
Extended Data Fig. 2. PL imaging of photo-redox phase patterned MoS2.
MoS2 flake in Fig. 4a, Scale bar, 5 μm.

References

    1. Voiry, D., Mohite, A. & Chhowalla, M. Phase engineering of transition metal dichalcogenides. Chem. Soc. Rev.44, 2702–2712 (2015). - PubMed
    1. Yin, X. et al. Recent developments in 2D transition metal dichalcogenides: phase transition and applications of the (quasi-)metallic phases. Chem. Soc. Rev.50, 10087–10115 (2021). - PubMed
    1. Kappera, R. et al. Phase-engineered low-resistance contacts for ultrathin MoS2 transistors. Nat. Mater.13, 1128–1134 (2014). - PubMed
    1. Yang, Y. et al. Performance improvement in p-Type WS2 field-effect transistors with 1T phase contacts. Nanotechnology32, 34 (2021). - PubMed
    1. Gupta, U. et al. Characterization of few-layer 1T-MoSe2 and its superior performance in the visible-light induced hydrogen evolution reaction. APL Mater.2, 092802 (2014).

LinkOut - more resources