. 2024 Sep;56(9):1925-1937.
doi: 10.1038/s41588-024-01873-w. Epub 2024 Aug 28.

An integrated single-cell reference atlas of the human endometrium

Affiliations

An integrated single-cell reference atlas of the human endometrium

Magda Marečková et al. Nat Genet. 2024 Sep.

Abstract

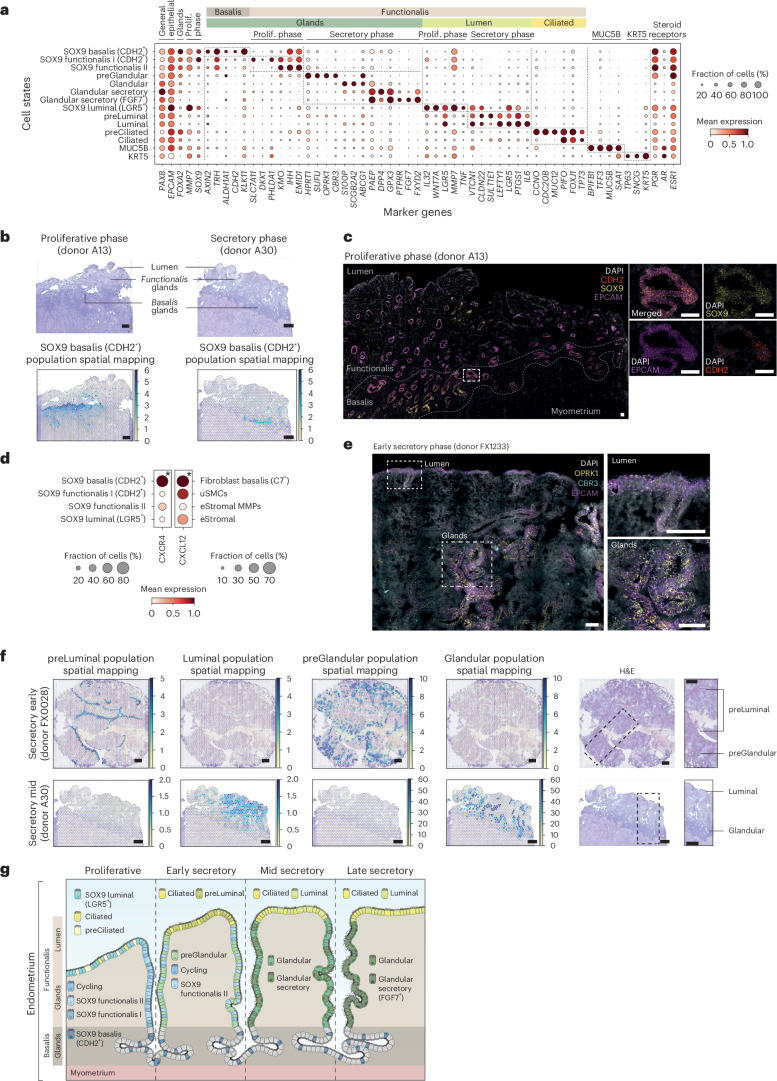
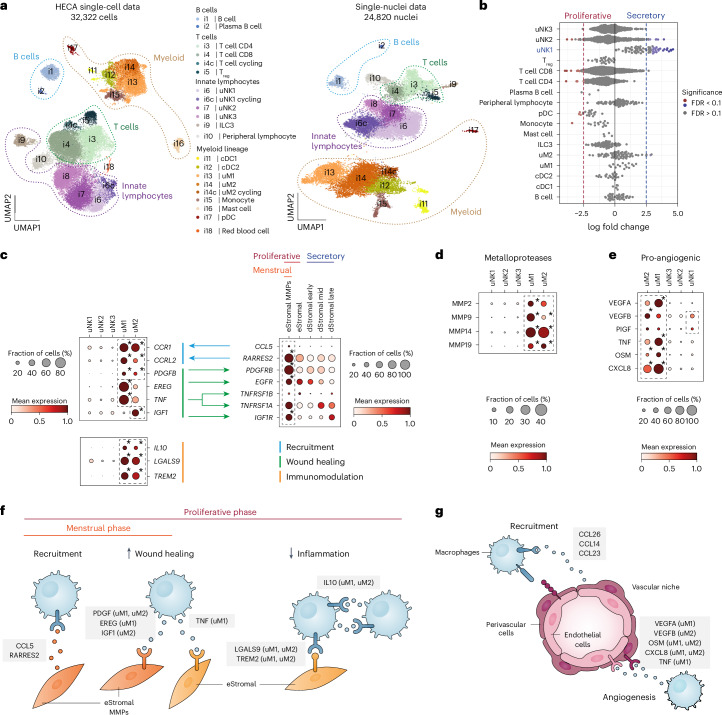
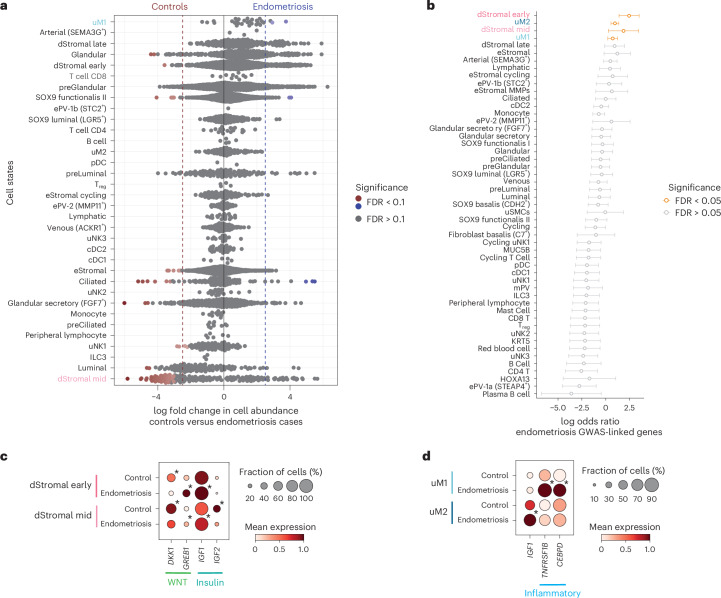
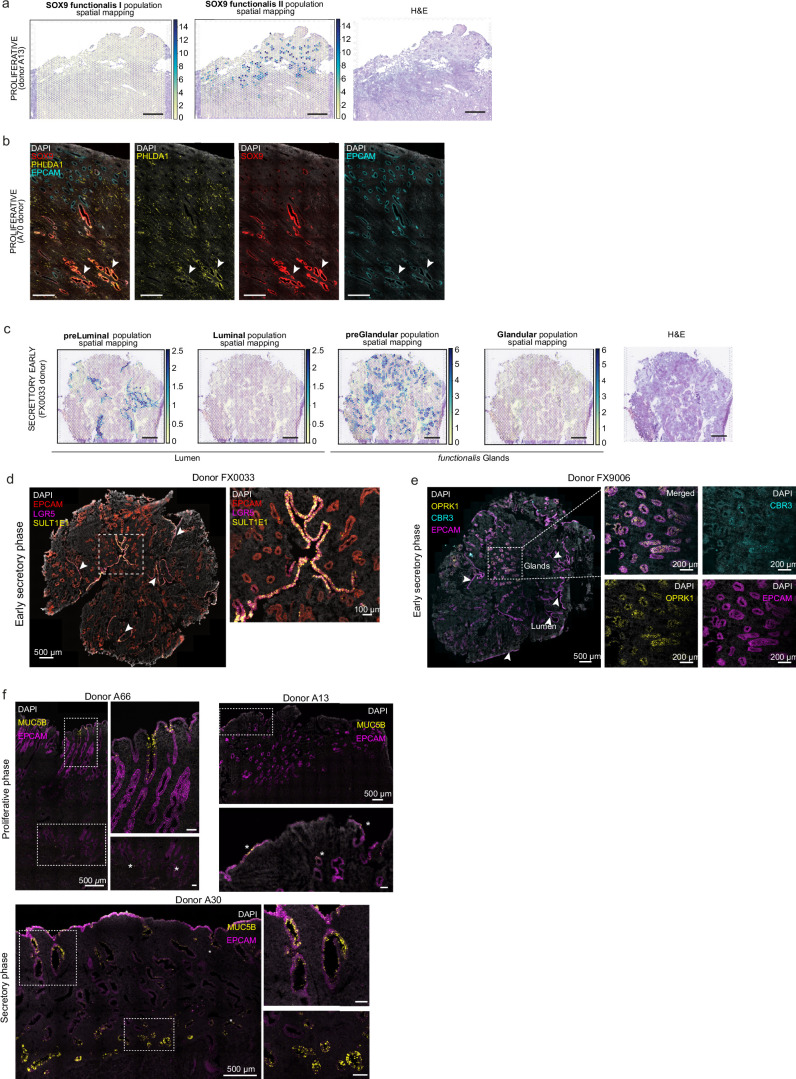
The complex and dynamic cellular composition of the human endometrium remains poorly understood. Previous endometrial single-cell atlases profiled few donors and lacked consensus in defining cell types. We introduce the Human Endometrial Cell Atlas (HECA), a high-resolution single-cell reference atlas (313,527 cells) combining published and new endometrial single-cell transcriptomics datasets of 63 women with and without endometriosis. HECA assigns consensus and identifies previously unreported cell types, mapped in situ using spatial transcriptomics and validated using a new independent single-nuclei dataset (312,246 nuclei, 63 donors). In the functionalis, we identify intricate stromal-epithelial cell coordination via transforming growth factor beta (TGFβ) signaling. In the basalis, we define signaling between fibroblasts and an epithelial population expressing progenitor markers. Integration of HECA with large-scale endometriosis genome-wide association study data pinpoints decidualized stromal cells and macrophages as most likely dysregulated in endometriosis. The HECA is a valuable resource for studying endometrial physiology and disorders, and for guiding microphysiological in vitro systems development.


Conflict of interest statement

K.T.Z. and C.M.B. have received grant funding from Bayer AG, AbbVie Inc., Roche Diagnostics Inc., Volition Rx, MDNA Life Sciences and Precision Life, unrelated to the work presented in this paper. K.T.Z. is also a Board member of the World Endometriosis Research Foundation. M.L. consults for Santa Anna Bio, owns interests in Relation Therapeutics and is a scientific cofounder and part-time employee at AIVIVO. The remaining authors declare no competing interests.

Figures

Fig. 1
Fig. 1. Harmonized cellular map of the human endometrium.
a, Schematic illustration of the human uterus and cellular composition of the endometrium as it undergoes morphological changes across the menstrual cycle. b, List of datasets analyzed and contribution of the number of donors, cells/nuclei, endometrial histology and endometriosis status of all samples profiled per dataset. c, UMAP projections of the HECA scRNA-seq data from a total of 63 individuals and 313,527 cells colored by cell state. d, UMAP projections of snRNA-seq data from a total of 63 individuals and 312,246 nuclei colored by cell state. Dot colour corresponds to cell states described in c. e, Bar plot showing the contribution of each of the scRNA-seq datasets to the main cellular lineages (endothelial, epithelial, immune and mesenchymal lineages) as shown in c. f, Bar plot showing the cellular composition of a total of 47 endometrial biopsies from the menstrual (n = 2), proliferative (n = 25), early secretory (n = 6), early/mid secretory (n = 7), mid secretory (n = 6) and late secretory (n = 1) phases of the menstrual cycle for the scRNA-seq data presented in c. Biopsies from donors on hormones (n = 14) and samples assigned as secretory phase without available subcategorisation into early/mid/late secretory (n = 2) are shown in Extended Data Fig. 1d. Bar colour corresponds to cell states described in c. aFive donors are shared between Mareckova scRNA-seq and snRNA-seq datasets. ePV, endometrial PV cells; mPV, myometrial PV cells; prolif., proliferative; secret., secretory.
Fig. 2
Fig. 2. Spatiotemporal complexity of epithelial cells.
a, Dot plot showing normalized, log-transformed and variance-scaled expression of genes (x axis) for epithelial cell states (y axis) in scRNA-seq data. b, Visium spatial transcriptomics data and an H&E image of the same tissue section. Spot color indicates cell2location-estimated cell density for the SOX9 basalis (CDH2+) population in sections of whole-uterus biopsies (n = 2 biologically independent samples) from donors A13 (proliferative phase) and A30 (secretory phase). c, High-resolution multiplexed smFISH of a section of a whole-uterus biopsy from donor A13 stained for DAPI (white, nuclei), EPCAM (magenta, epithelium), SOX9 (yellow, epithelium) and CDH2 (red, basalis epithelium) (n = 2 biologically independent samples). The dotted line highlights the basalis endometrium where signals for all markers co-localize within the basalis glands. The inset shows a representative magnified area. Scale bars, 100 µm. d, Dot plot showing normalized, log-transformed and variance-scaled expression of CXCR4 and CXCL12 (x axis) in a selection of epithelial and mesenchymal cells (y axis) in scRNA-seq data. Asterisk denotes a significant cell–cell interaction identified through CellPhoneDB analyses. e, Left, high-resolution multiplexed smFISH of a section of a superficial biopsy from donor FX1233 showing the expression of DAPI (white, nuclei), EPCAM (magenta, epithelium), CBR3 (cyan, preGlandular cells) and OPRK1 (yellow, preGlandular cells) (n = 2 biologically independent samples). Top right, a magnified image of the luminal region with low OPRK1 and CBR3 signal. Bottom right, a magnified image of the glandular region with high and co-localized OPRK1 and CBR3 signal. Scale bars, 100 µm. f, Visium spatial transcriptomics data and an H&E image of the same tissue section. Spot color indicates cell2location-estimated cell density for the preLuminal, Luminal, preGlandular and Glandular populations in a section of a superficial biopsy from donor FX0028 (early secretory phase; n = 2 biologically independent samples) and a section of a whole-uterus biopsy from donor A30 (mid secretory phase; n = 1). Scale bars, 1 mm. g, Schematic illustration of the spatiotemporal complexity of the endometrial epithelium across the proliferative and secretory phases.
Fig. 3
Fig. 3. Endometrial stromal cell heterogeneity and stromal–epithelial cell crosstalk across the menstrual cycle.
a, Dot plot showing normalized, log-transformed and variance-scaled expression of genes (x axis) characteristic of the identified stromal cell states (y axis) in scRNA-seq data. b, Visium spatial transcriptomics data and an H&E image of the same tissue section are shown. Spot color indicates estimated cell state density for a specific cell population in each Visium spot as computed by cell2location. Spatial mapping of the eStromal, dStromal early and dStromal mid cell populations is shown in a section of a whole-uterus biopsy from donor A13 (top panel, proliferative phase; a representative image of n = 2 independent samples from the same donor), a section of a superficial biopsy from donor FX0033 (middle panel, early secretory phase; a representative image of n = 2 biologically independent samples) and a section of a whole-uterus biopsy from donor A30 (bottom panel, mid secretory phase; a representative image of n = 2 independent samples from the same donor). Mapping of menstrual cycle phase-relevant epithelial cell populations is also shown in the niche composition panel. Scale bars, 1 mm. c, Dot plot showing normalized, log-transformed and variance-scaled expression of genes coding for ligands involved in TGFβ, insulin, retinoic acid and WNT signaling (x axis) in epithelial and mesenchymal cell states (y axis) in scRNA-seq data. d, Schematic illustration of the temporal complexity of endometrial stromal cells and signaling pathways across the proliferative and secretory phases. RA, retinoic acid.
Fig. 4
Fig. 4. Predicted ligand–receptor interactions and role of macrophages in endometrial repair and regeneration.
a, Left, UMAP projections of scRNA-seq data for 32,322 immune cells colored by cell type. Right, UMAP projections of snRNA-seq data for 24,820 immune cells/nuclei colored by cell type. b, Beeswarm plot of the distribution of log fold change between the proliferative and secretory phases in neighborhoods containing immune cells from different cell types in scRNA-seq data. Differentially abundant neighborhoods at log fold change > 2.5 and spatial FDR < 0.1 are colored. c, Dot plot showing normalized, log-transformed and variance-scaled expression of genes (y axis) in uNK and uM cell states (x axis) in scRNA-seq data. Asterisk denotes significantly upregulated expression at FDR < 0.05. d, Dot plots showing normalized, log-transformed and variance-scaled expression of signaling molecules and receptors (y axes) upregulated in uNK, uM and stromal cell states (x axes) in scRNA-seq data. Asterisk denotes significantly upregulated expression at FDR < 0.05. The predicted cell–cell communication between uNK, uM and stromal cell states, including its likely role, is shown by differently colored arrows. e, Dot plot showing normalized, log-transformed and variance-scaled expression of pro-angiogenic signaling molecules (y axis) upregulated in uNK and uM cell states (x axis) in scRNA-seq data. Asterisk denotes significantly upregulated expression at FDR < 0.05. f, Schematic illustration of macrophage and stromal cell signaling during the menstrual and proliferative phases, likely involved in macrophage cell recruitment, increasing wound healing abilities and dampening inflammation in stromal cells. g, Schematic illustration of macrophage, endothelial cell and PV cell signaling likely involved in macrophage recruitment and angiogenesis. Cells from donors on hormones and donors with endometriosis were excluded from analyses shown in be of this figure. Asterisk denotes significantly upregulated expression FDR < 0.05. cDC, conventional dendritic cells; FDR, false discovery rate; ILC3, innate lymphoid cell type 3; pDC, plasmacytoid dendritic cell; Treg, regulatory T cells.
Fig. 5
Fig. 5. Endometrial stromal–immune cell niche in endometriosis.
a, Beeswarm plot of cellular composition changes between controls and endometriosis cases detected by RMilo’s differential cell abundance test in the snRNA-seq dataset. Donors taking exogenous hormones were excluded from the analysis. Each dot represents the log fold change between conditions (that is, controls versus endometriosis cases) of a cell type neighborhood. Cell neighborhoods at log fold change > 2.5 and spatial FDR < 0.1 are colored. b, Forest plot of each endometrial cell type (y axis) representing the enrichment for expression of genes (log odds ratio (x axis)) associated with endometriosis, estimated from the fGWAS test. Data are presented as log odds ratio ± 95% CI. Cell types in orange have FDR < 0.05. c, Dot plot showing normalized, log-transformed and variance-scaled expression of differentially expressed genes (x axis) in dStromal cell states of controls and endometriosis cases (y axis) in the scRNA-seq data. d, Dot plot showing normalized, log-transformed and variance-scaled expression of differentially expressed genes (x axis) upregulated in uM cell states (y axis) in the scRNA-seq data. Cells from donors on hormones were excluded from all analyses shown in this figure. Asterisks denote differentially expressed genes between controls and cases at FDR < 0.1. 95% CI, confidence interval.
Extended Data Fig. 1
Extended Data Fig. 1. Single-cell RNA-sequencing datasets of the Human Endometrial Cell Atlas (HECA) and the cervix.
a, UMAP projections of scRNA-seq data for HECA coloured by cell lineage, dataset, menstrual cycle, cell cycle phase and biopsy type. b, Dot plot showing normalised, log-transformed and variance-scaled expression of genes (x-axis) characteristic of the main cell lineages (y-axis) in the HECA. c, Dot plot showing normalised, log-transformed and variance-scaled expression of genes (x-axis) characteristic of mesenchymal and endothelial cells (y-axis) in the HECA. d, Bar plot showing the cellular composition of endometrial biopsies in the different menstrual cycle groups (y-axis). e, UMAP projection of a scANVI representation of the HECA coloured by the cell states identified. Red dotted-lined shapes outline the MUC5B, KRT5 and HOXA13 populations. f, UMAP projection of the Liu et al. scRNA-seq dataset of human cervix coloured by Liu’s clusters and the four main cell lineages. g, Dot plot showing normalised, log-transformed and variance-scaled expression of genes (x-axis) characteristic of the cell clusters identified in the Liu et al. cervix dataset by the authors (y-axis). Purple rectangles highlight the epithelial and mesenchymal clusters that expressed markers characteristic of the MUC5B, KRT5 and HOXA13 populations defined in the HECA. h, UMAP projection of the mapping of the Liu et al. cervix dataset onto the scANVI representation of the HECA coloured by either the endometrial cell states identified in the HECA or the cervix cell states Liu et al. (grey). Red dotted-lined shapes outline the MUC5B, KRT5 and HOXA13 populations of the HECA. i, UMAP projection of the mapping of the Liu et al. cervix dataset onto the scANVI representation of the HECA coloured by the matched cervix cell clusters identified by Liu et al.. Red dotted-lines outline the MUC5B, KRT5 and HOXA13 populations of the HECA. dStromal, decidualised stromal cells; ePV, endometrial perivascular cells; eStromal, endometrial stromal cells specific to proliferative phase; HECA, human endometrial cell atlas; MMPs, matrix metalloproteinases; NK, natural killer cells; scRNA-seq, single-cell RNA-sequencing; scANVI, single-cell ANnotation using Variational Inference; T, T cells; UMAP, uniform manifold approximation and projection; uSMCs, uterine smooth muscle cells.
Extended Data Fig. 2
Extended Data Fig. 2. Distribution of cell types across samples in cells and nuclei.
a, Bar plot showing the proportion of cell types in each sample. Each row corresponds to a donor, grouped by study and coloured by cell type. b, Bar plot representing the number of cells of each cell type in each dataset. Each row represents a dataset, coloured by cell type. c, Bar plot showing the proportion of cell types in each donor from the nuclei dataset. Each row represents a donor, coloured by cell type.
Extended Data Fig. 3
Extended Data Fig. 3. Comparison of cell type labels from original publications and HECA.
Sankey plot showing the correspondence between cell type labels from original publications (left) and HECA (right) from the Tan (a), Wang (b) and Garcia-Alonso (c) datasets respectively. In each plot, the width of each line is proportional to number of cells.
Extended Data Fig. 4
Extended Data Fig. 4. Single-nucleus RNA-sequencing cell state identification and marker gene expression.
a, UMAP projections of the snRNA-seq data coloured by cell lineage, cell cycle phase, menstrual cycle group, and endometriosis status. b, UMAP projections of the epithelial cell lineage of the snRNA-seq dataset coloured by the identified epithelial cell states of the HECA as assigned by label transfer. c, UMAP projections of the mesenchymal cell lineage of the snRNA-seq dataset coloured by the identified mesenchymal cell states of the HECA as assigned by label transfer. d, Dot plot showing normalised, log-transformed and variance-scaled expression of genes (x-axis) characteristic of the endothelial and immune nuclei (y-axis). e, Bar plot showing the cellular composition of endometrial biopsies belonging to the different menstrual cycle groups (y-axis). f, Dot plot showing normalised, log-transformed and variance-scaled expression of genes (x-axis) characteristic of the identified epithelial cell states (y-axis) in snRNA-seq data. g, Dot plot showing normalised, log-transformed and variance-scaled expression of genes (x-axis) characteristic of the identified mesenchymal cell states (y-axis) in snRNA-seq data. dStromal, decidualised stromal cells; ePV, endometrial perivascular cells; eStromal, endometrial stromal cells specific to proliferative phase; HECA, human endometrial cell atlas; MMPs, matrix metalloproteinases; mPV, myometrial perivascular cells; Prolif., proliferative; secret., secretory; snRNA-seq, single-nucleus RNA-sequencing; UMAP, uniform manifold approximation and projection; uSMCs, uterine smooth muscle cells.
Extended Data Fig. 5
Extended Data Fig. 5. Cellular heterogeneity of samples from donors taking exogenous hormones in scRNA-seq and snRNA-seq data.
a, UMAP projections of the scRNA-seq data coloured by hormonal treatment taken. b, Overview of the number of donors and cells per hormonal treatment taken in each dataset profiled by scRNA-seq. c, Bar plot showing the cellular composition of endometrial biopsies from donors taking the different hormonal treatment (y-axis) in the scRNA-seq data. d, UMAP projections of the snRNA-seq data coloured by hormonal treatment taken. e, Overview of the number of donors and cells per hormonal treatment taken profiled by snRNA-seq. f, Bar plot showing the cellular composition of endometrial biopsies from donors taking the different hormonal treatment (y-axis) in the snRNA-seq dataset. dStromal, decidualised stromal cells; ePV, endometrial perivascular cells; eStromal, endometrial stromal cells specific to proliferative phase; MMPs, matrix metalloproteinases; mPV, myometrial perivascular cells; Prolif., proliferative; scRNA-seq; single-cell RNA-sequencing; secret., secretory; snRNA-seq, single-nucleus RNA-sequencing; UMAP, uniform manifold approximation and projection; uSMCs, uterine smooth muscle cells.
Extended Data Fig. 6
Extended Data Fig. 6. Expression of ligands and receptors involved in epithelial- stromal cell communication.
a, Dotplot plot reporting the variance-scaled mean expression of CXCL12 (ligand of CXCR4). Red circles indicate that at least one of the interacting partners is differentially expressed in one of the cell types in the pair. b, High-resolution multiplexed smFISH of endometrium section (donor A70; n = 2 biologically independent samples) showing the expression of DAPI (white), SOX9 (red), CXCR4 (yellow), CXCL12 (magenta), C7 (cyan). White arrows indicate regions where all signals can be detected in high proximity. Scale bars = 100 µm. c, Dotplot plot reporting the variance-scaled mean expression of the two or more (if heteromeric complexes) transcripts coding for the interacting proteins in pairs of cell types. Red circles indicate that at least one of the interacting partners is differentially expressed in one of the cell types in the pair. d, Dot plot showing normalised, log-transformed and variance-scaled expression of genes coding for TGFβ, insulin, retinoic acid and WNT signalling receptors (x-axis) in the epithelial and mesenchymal cell states identified (y-axis) in the scRNA-seq data. eStromal, endometrial stromal cells specific to proliferative phase; dStromal, decidualised stromal cells; MMPs, matrix metalloproteinases; scRNA-seq, single-cell RNA-sequencing; TGFβ, transforming growth factor beta; uSMCs, uterine smooth muscle cells; smFISH, single molecule fluorescence in situ hybridisation.
Extended Data Fig. 7
Extended Data Fig. 7. Spatial mapping of epithelial cell populations.
a, Visium spatial transcriptomics data and an H&E image of a full thickness uterine section (donor A13, n = 2 independent samples from the same donor). Spot colour indicates cell2location-estimated cell density for SOX9 functionalis I and II populations. Scale bars = 1 mm. b, High-resolution multiplexed smFISH of full thickness endometrium sections (donor A70; n = 3 biologically independent samples) showing the expression of DAPI (white, nuclei), PHLDA1 (yellow, SOX9 Functionalis I cells), SOX9 (red, SOX9+ epithelium), and EPCAM (cyan, epithelium). White arrows indicate PHLDA1-expressing SOX9 Functionalis I cells. Scale bars = 500 µm. c, Visium spatial transcriptomics data and an H&E image of the same superficial biopsy section (donor FX0033, early secretory phase; n = 2 biologically independent samples). Spot colour indicates cell2location-estimated cell density for the preLuminal, Luminal, preGlandular and Glandular populations. Scale bars = 1 mm. d, High-resolution multiplexed smFISH of a superficial biopsy section (donor FX0033, early secretory phase; n = 3 biologically independent samples) showing the expression of DAPI (white, nuclei), EPCAM (red, epithelium), LGR5 (magenta, luminal cell), and SULT1E1 (yellow, preLuminal cells). White arrows indicate luminal regions with high LGR5 and SULT1E1 signals. The dashed outline indicates the magnified area of the luminal region with high and co-localised LGR5 and SULT1E1 signals. e, High-resolution multiplexed smFISH of a superficial biopsy section (donor FX9006, early secretory phase; n = 2 biologically independent samples) showing the expression of DAPI (white, nuclei), EPCAM (magenta, epithelium), CBR3 (cyan, preGlandular cells), and OPRK1 (yellow, preGlandular cells). The dashed outline indicates a magnified area of the glands with high and co-localised OPRK1 and CBR3 signals. White arrows indicate luminal regions with low OPRK1 and CBR3 signals. f, High-resolution multiplexed smFISH of full thickness endometrium sections from the proliferative phase (donors A66 and A13) and secretory phase (donor A30) showing the expression of DAPI (white, nuclei), EPCAM (magenta, epithelium), and MUC5B (yellow, MUC5B cells) (n = 3 biologically independent samples). The dashed outline indicates the magnified areas. Asterisks indicate representative regions where the MUC5B signal was detected and varied across samples. Scale bars = 100 µm, unless differently specified. smFISH, single molecule fluorescence in situ hybridisation.
Extended Data Fig. 8
Extended Data Fig. 8. Immune cells in scRNA-seq and snRNA-seq data.
a, UMAP projections of scRNA-seq data for immune cells coloured by dataset, menstrual cycle group, cell cycle phase and biopsy type. b, UMAP projections of snRNA-seq data for immune cells coloured by menstrual cycle group and cell cycle phase. c, UMAP projection of snRNA-seq data for immune cells coloured by the probability of assigning the immune cell types identified in the scRNA-seq data. Support Vector Machine (SVM) classifier was trained using the immune cell scRNA-seq data and the predicted cell type annotations were then projected onto the snRNA-seq data with the probability shown. d, Dot plot showing normalised, log-transformed and variance-scaled expression of genes (x-axis) characteristic of the identified immune cell states (y-axis) in the scRNA-seq data. e, Dot plot showing normalised, log-transformed and variance-scaled expression of genes (x-axis) characteristic of the identified immune cell states (y-axis) in the snRNA-seq data. f, Beeswarm plot of the distribution of log fold change across the menstrual cycle (proliferative and secretory phases) in neighbourhoods containing immune cells from different cell type clusters in snRNA-seq data. Differentially abundant neighbourhoods at log fold change > 2.5 and spatial FDR < 0.1 are coloured. g, Visium spatial transcriptomics data for donors A13 (proliferative phase) and A30 (secretory phase) (n = 2 biologically independent samples) are shown. Spot colour indicates estimated cell state density for a specific population of perivascular cells (mPV, ePV-1a, ePV-1b and ePV-2) in each Visium spot, as computed by cell2location. h, Dot plot showing normalised, log-transformed and variance-scaled expression of genes (x-axis) characteristic of the identified endothelial, perivascular and stromal cells (y-axis) in the scRNA-seq data. cDC, conventional dendritic cells; eStromal, endometrial stromal cells specific to proliferative phase; ePV, endometrial perivascular cells; FDR, false discovery rate; ILC3, innate lymphoid cell type 3; mPV, myometrial perivascular cells; pDC, plasmacytoid dendritic cells; RBC, red blood cells; scRNA-seq, single-cell RNA-sequencing; snRNA-seq, single-nucleus RNA-sequencing; SVM, support vector machine; T Reg, T regulatory cells; uM, uterine macrophages; UMAP, uniform manifold approximation and projection; uNK, uterine natural killer cells.
Extended Data Fig. 9
Extended Data Fig. 9. Predicted cell-cell interactions underpinning endometrial regeneration and angiogenesis.
a, Dotplot plot reporting the variance-scaled mean expression of the two or more (if heteromeric complexes) transcripts coding for the interacting proteins in pairs of cell types. Red circles indicate that at least one of the interacting partners is differentially expressed in one of the cell types in the pair. Interactions are classified based on whether they are predicted to play a role in recruitment, wound healing or immunomodulation during endometrial regeneration. b, High-resolution multiplexed smFISH of full thickness endometrium sections (donor A70; n = 3; independent samples from the same donor) showing the expression of DAPI (white, nuclei), CD14 (yellow, macrophages), PDGFB (red), MME (magenta, eStromal MMPs), PDGFRB (cyan, PDGFB receptor). The dashed outline indicates the area shown magnified to the right. White arrows indicate regions of interaction between macrophages and eStromal MMPs by means of signal colocalization and/or proximity. Scale bars = 100 µm. c, Dotplot plot reporting the variance-scaled mean expression of the two or more (if heteromeric complexes) transcripts coding for the interacting proteins in pairs of cell types. Red circles indicate that at least one of the interacting partners is differentially expressed in one of the cell types in the pair. Interactions are classified based on whether they are predicted to play a role in cell recruitment or pro-angiogenic processes within the vascular niche. d, High-resolution multiplexed smFISH of full thickness endometrium sections (donor A13; n = 3; independent samples from the same donor) showing the expression of DAPI (white, nuclei), CD14 (yellow, macrophages), OSM (red), CDH5 (magenta, endothelial cells), OSMR (cyan, OSM receptor). The dashed outline indicates the area shown magnified underneath. White arrows indicate regions of interaction between macrophages and endothelial cells by means of signal colocalization or proximity. Scale bars = 100 µm. smFISH, single molecule fluorescence in situ hybridisation.

References

    1. Critchley, H. O. D., Maybin, J. A., Armstrong, G. M. & Williams, A. R. W. Physiology of the endometrium and regulation of menstruation. Physiol. Rev. 10.1152/physrev.00031.2019 (2020). - PubMed
    1. Salamonsen, L. A., Hutchison, J. C. & Gargett, C. E. Cyclical endometrial repair and regeneration. Development148, dev199577 (2021). - PubMed
    1. Tempest, N. et al. Histological 3D reconstruction and in vivo lineage tracing of the human endometrium. J. Pathol.251, 440–451 (2020). - PubMed
    1. Yamaguchi, M. et al. Three-dimensional understanding of the morphological complexity of the human uterine endometrium. iScience24, 102258 (2021). - PMC - PubMed
    1. Tempest, N. et al. Novel microarchitecture of human endometrial glands: implications in endometrial regeneration and pathologies. Hum. Reprod. Update28, 153–171 (2022). - PMC - PubMed

Substances

LinkOut - more resources