. 2024 Aug 28;7(1):1059.
doi: 10.1038/s42003-024-06752-y.

Polymodal K+ channel modulation contributes to dual analgesic and anti-inflammatory actions of traditional botanical medicines

Affiliations

Polymodal K+ channel modulation contributes to dual analgesic and anti-inflammatory actions of traditional botanical medicines

Rían W Manville et al. Commun Biol. .

Abstract

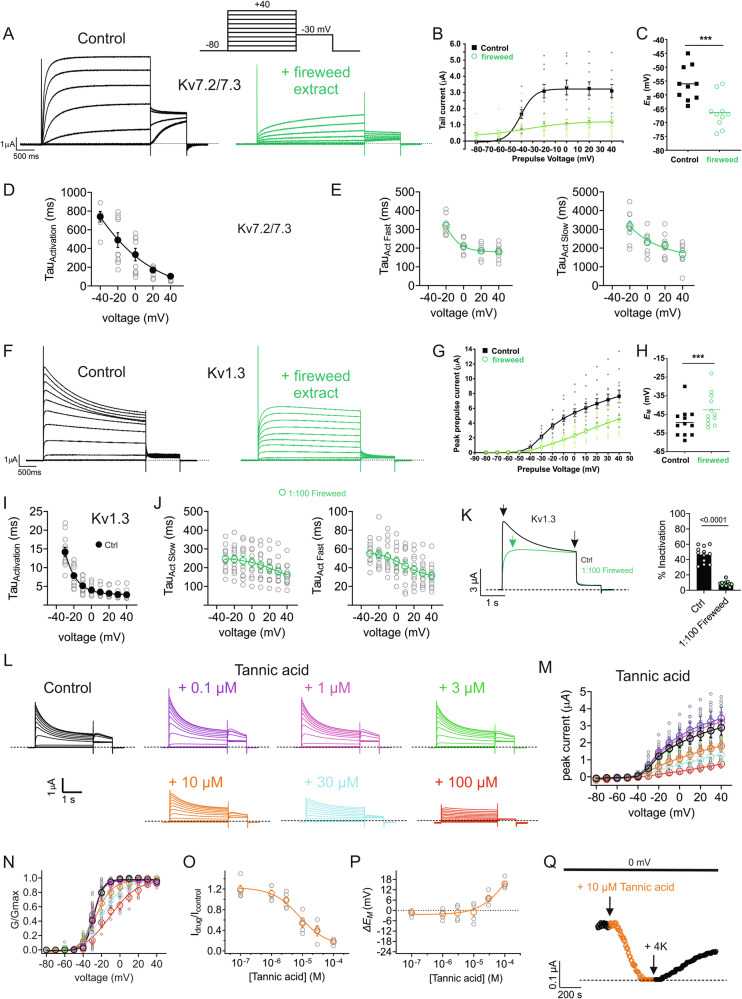
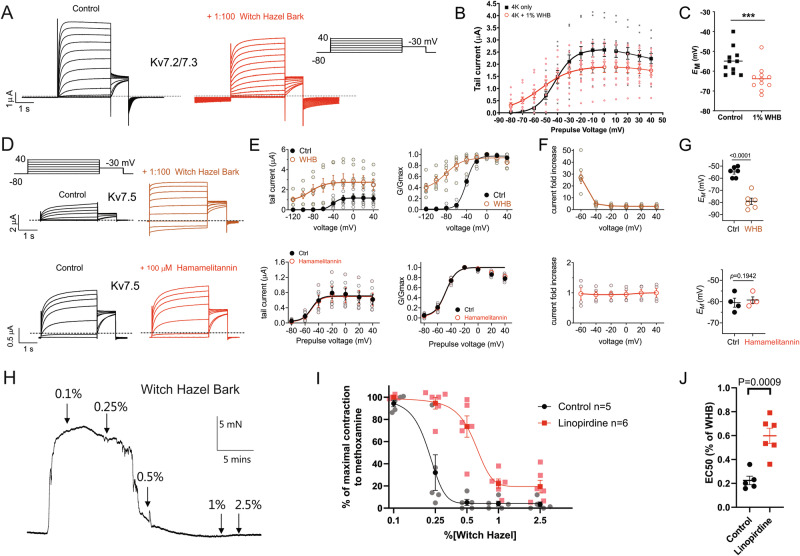
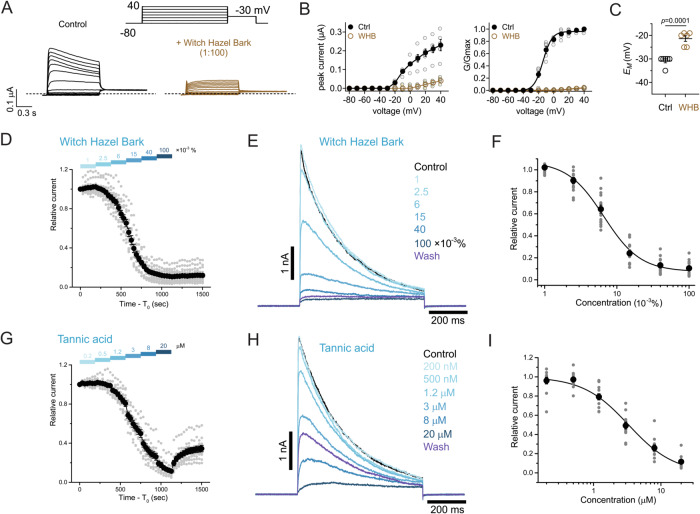
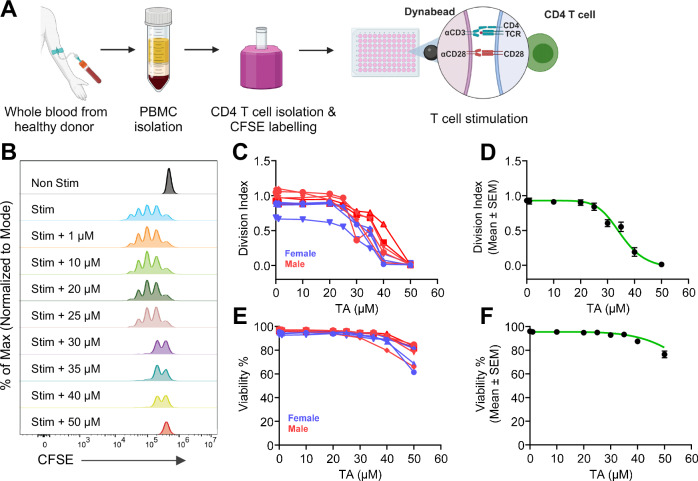
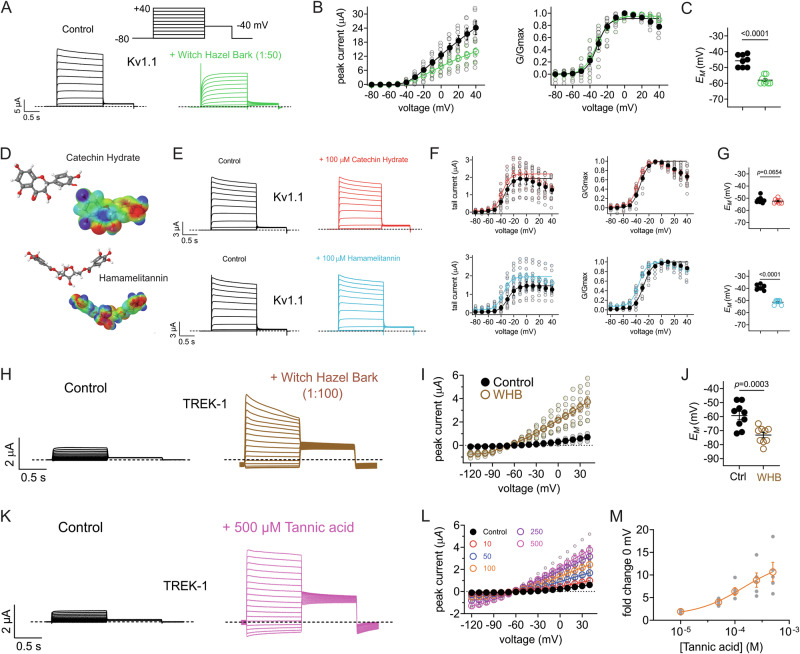
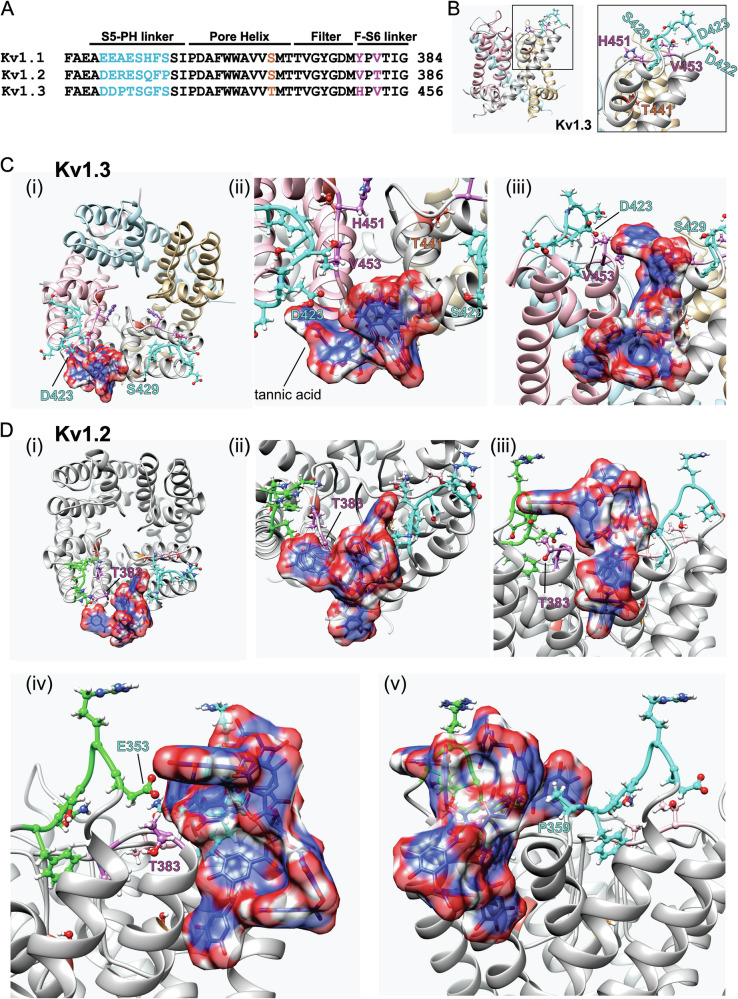
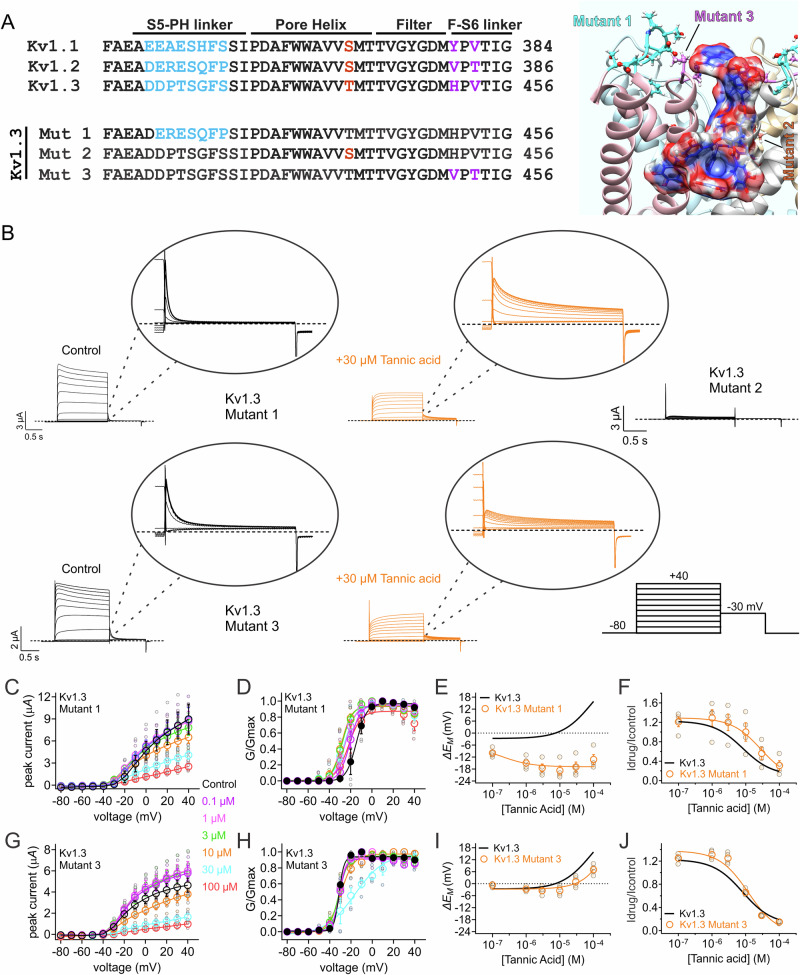
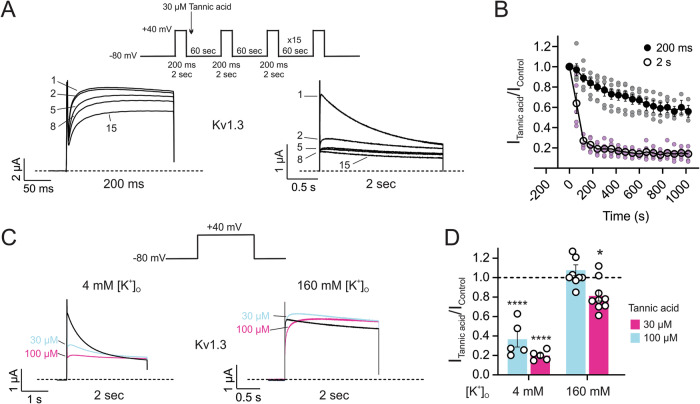
Pain and inflammation contribute immeasurably to reduced quality of life, yet modern analgesic and anti-inflammatory therapeutics can cause dependence and side effects. Here, we screened 1444 plant extracts, prepared primarily from native species in California and the United States Virgin Islands, against two voltage-gated K+ channels - T-cell expressed Kv1.3 and nociceptive-neuron expressed Kv7.2/7.3. A subset of extracts both inhibits Kv1.3 and activates Kv7.2/7.3 at hyperpolarized potentials, effects predicted to be anti-inflammatory and analgesic, respectively. Among the top dual hits are witch hazel and fireweed; polymodal modulation of multiple K+ channel types by hydrolysable tannins contributes to their dual anti-inflammatory, analgesic actions. In silico docking and mutagenesis data suggest pore-proximal extracellular linker sequence divergence underlies opposite effects of hydrolysable tannins on different Kv1 isoforms. The findings provide molecular insights into the enduring, widespread medicinal use of witch hazel and fireweed and demonstrate a screening strategy for discovering dual anti-inflammatory, analgesic small molecules.


Conflict of interest statement

The authors declare no competing interests.

Figures

Fig. 1
Fig. 1. High-throughput screening of plant extracts for activity upon Kv1.3 and Kv7.2/7.3 reveals a subset with desirable dual effects.
A Results of 1444-extract screen of plant extract activity against Kv1.3 and Kv7.2/3. Each point indicates screening result as the mean of a technical triplicate for an individual plant extract (1:50 extract dilution). B Closeup of dashed box region from (A) showing identities of plant extracts.
Fig. 2
Fig. 2. Kv channel subfamily divergent effects of fireweed extract and tannic acid.
A Representative traces for Kv7.2/7.3 in the absence (Control) or presence of 1% fireweed extract. Scale bars lower left for each trace; voltage protocol upper inset; n = 10. B Mean tail current for Kv7.2/7.3 traces as in (A); n = 10. C Mean unclamped oocyte membrane potential for oocytes as in (A); n = 6–10. ***P < 0.001. D Mean tau of activation for Kv7.2/3 Control traces as in (A) (n = 9). E Mean tau of activation (fast and slow components) for Kv7.2/3 + fireweed traces as in (A) (n = 10). F Mean traces for Kv1.3 in the absence (Control) or presence of 1% fireweed extract. Scale bars lower left for each trace; n = 12. G Mean peak prepulse current for Kv1.3 traces as in (D); n = 12. H Mean unclamped oocyte membrane potential for oocytes as in (F); n = 12. ***P < 0.001. I Mean tau of activation for Kv1.3 Control traces as in (F) (n = 11–12). J Mean tau of activation (fast and slow components) for Kv1.3 + fireweed traces as in (F) (n = 11–12). K Left, mean Kv1.3 traces at +40 mV right, % inactivation in the absence and presence of fireweed (n = 12) L Mean traces for Kv1.3 in the absence (Control) or presence of various concentrations of tannic acid as indicated; scale bars lower left; voltage protocol as in (A); n = 4–5. M Mean peak prepulse current for Kv1.3 traces as in (L); n = 4–5. N Mean normalized tail current (G/Gmax) for Kv1.3 traces as in (L); n = 4–5. O Tannic acid dose response for Kv1.3 prepulse current inhibition from oocytes as in (L), n = 4–5. P Mean unclamped oocyte ΔEM dose response for oocytes as in (L); n = 4–5. Q Representative 0 mV Kv1.3 current during tannic acid wash-in, and washout using 4 mM K+ bath solution (4 K). For all panels, error bars indicate SEM. n indicates number of oocytes. Statistical comparisons by paired t-test.
Fig. 3
Fig. 3. Fireweed is analgesic in the late (inflammatory) phase of the response to formalin injection in mice.
A Time spent licking the injected paw in the early phase (acute pain response) after formalin injection with different dilutions of fireweed extract versus vehicle; n = 8–10. B Time spent licking the injected paw in the late (inflammatory) phase after formalin injection with different dilutions of fireweed extract versus vehicle. **P < 0.01; n = 8–10. C Comparison of pain response (time spent licking injected paw) after formalin injection with different dilutions of fireweed extract versus vehicle across the entire experiment duration separated into 5-min time bins. **P < 0.01; ***P < 0.001; n = 8–10. For all panels, error bars indicate SEM. n indicates number of mice. Statistical comparisons by one-way or two-way ANOVA, as appropriate.
Fig. 4
Fig. 4. Witch hazel bark extract activates Kv7 channels and Kv7-dependently relaxes rat mesenteric arteries.
A Exemplar traces for Kv7.2/7.3 in the absence (Control) or presence of 1% witch hazel bark extract. Scale bars lower left; voltage protocol upper right inset; n = 11. B Mean tail current for Kv7.2/7.3 traces as in (A); n = 11. C Mean unclamped oocyte membrane potential for oocytes as in (A); n = 11. ***P < 0.001. D Mean traces for Kv7.5 in the absence (Control) or presence of 1% witch hazel bark extract and hamamelitannin as indicated. Scale bars lower left; voltage protocol upper left inset; n = 4–6. E Mean raw (left) and normalized (right) tail current for Kv7.5 traces as in (D); n = 4–6. F Mean current fold increase versus voltage for traces as in (D); n = 4–6. G Mean unclamped oocyte membrane potential for oocytes as in (D); n = 4–6. H Representative myographic trace of witch hazel bark extract-mediated relaxation of pre-contracted tone (10 µM methoxamine) in a mesenteric artery from a male adult Wistar rat. I Mean data and J scatter plot with mean ± SEM of EC50 values generated from raw data (as in H; n = 5–6) for witch hazel bark extract-mediated relaxation in the presence or absence (Control) of Kv7 inhibitor linopirdine (10 µM) in arteries from male adult Wistar rats. For all panels, error bars indicate SEM. n indicates number of oocytes (AG) or animals (HJ). Statistical comparisons by one-way ANOVA.
Fig. 5
Fig. 5. Witch hazel bark extract and tannic acid inhibit heterologously expressed Kv1.3 and native Kv1.3 current in activated human T-cells.
A Mean traces for oocytes expressing Kv1.3 in the absence (Control) or presence of 1% witch hazel bark extract. Scale bars lower left; voltage protocol upper right inset; n = 6. B Mean peak (left) and normalized tail (right) current for Kv1.3 traces as in (A); n = 6. C Mean unclamped oocyte membrane potential for oocytes as in (A); n = 6. D Activated human T-cell Kv1.3 currents recorded in response to 600 ms test pulses to +40 mV from a holding potential of −80 mV applied every 30 s. Time course of the peak Kv1.3 current recorded upon witch hazel bark extract application (n = 14). For every cell the time scale was modified by subtracting T0 from time, current was normalized to the current value before witch hazel bark extract application, and the data for all cells was averaged; data presented as Mean ± SEM. Bars above the time course indicate time of witch hazel bark extract application at corresponding concentrations indicated above the bars. E Representative traces of activated human T-cell Kv1.3 currents at different witch hazel bark extract concentrations recorded in the same cell. After application of 0.1% extract, the extract was washed out with Ringer solution for 6 min (trace “Wash”). F Witch hazel bark extract dose response estimate for activated human T-cell Kv1.3 current, from traces as in (E), n = 15 cells. The curve was fitted by a modified Hill equation as indicated; IR = A0 + IC50n/(IC50n + Cn). G Activated human T-cell Kv1.3 currents recorded as in (D), but with inhibition by tannic acid, doses as indicated above bars (n = 11). H Representative traces of Kv1.3 currents at tannic acid concentrations recorded in the same cell. After application of 20 µM tannic acid, the compound was washed out with Ringer solution for 6 min (trace “Wash”). I Tannic acid dose response estimate for activated human T-cell Kv1.3 current, from traces as in (H), n = 12. The curve was fitted by a modified Hill equation as indicated; IR = IC50n/(IC50n + Cn). For all panels, error bars indicate SEM. n indicates number of oocytes (AC) or T-cells (DI). Statistical comparisons by one-way ANOVA.
Fig. 6
Fig. 6. Tannic acid limits helper T cell activation and proliferation.
A Experimental design for purification of human CD4 T (helper) cells and stimulation using CD3/28 dynabeads. B Representative histograms (from 3–6 technical replicates of 1–2 experimental replicates from 9 individual donors) showing dilution of CFSE in CD4 T cells (gated on live) after 96 h of stimulation (Stim) in the presence of various concentrations of Tannic acid (TA). C Division indices of CD4+ T cells at 96 h, each line represents an individual donor, and symbols represent TA concentration (red for male donors, n = 5; blue for female donors, n = 4). D Symbols represent mean division indices from all donors in (C), (black); n = 9. Green line represents the dose–response curve, IC50 = 35.03 µM. E Viability of CD4 T cells at various TA concentrations as in (C). Each line represents individual donor, and symbols represent TA concentration (red for male donors, n = 5; blue for female donors, n = 4). F Symbols represent the mean viability of cells from all donors in (D), (black); n = 9. Green line represents the dose–response curve, LD50 = 87 µM.
Fig. 7
Fig. 7. Witch hazel bark extract and hydrolysable tannins activate Kv1.1 and TREK-1.
A Exemplar traces for Kv1.1 in the absence (Control) or presence of 1% witch hazel bark extract. Scale bars lower left; voltage protocol upper inset; n = 8. B Mean raw (left) and normalized (right) tail currents for Kv1.1 traces as in (A); n = 8. C Mean unclamped oocyte membrane potential for oocytes as in (A); n = 8. D Molecular structures (upper) and surface electrostatic plots (lower) for compounds indicated. E Exemplar traces for Kv1.1 in the absence (Control) or presence of witch hazel bark components indicated. Scale bars lower left; voltage protocol as in (A); n = 5–6. F Mean raw (left) and normalized (right) tail currents for Kv1.1 traces as in (E); n = 5–6. G Mean unclamped oocyte membrane potential for oocytes as in (E); n = 5–6. CH catechin hydrate, HAM hamamelitannin. H Exemplar traces for TREK-1 in the absence (Control) or presence of 1% witch hazel bark extract. Scale bars lower left; voltage protocol as in (A) but starting at −120 mV for prepulses; n = 9. I Mean peak prepulse currents for TREK-1 traces as in (H); n = 9. WHB witch hazel bark. J Mean unclamped oocyte membrane potential for oocytes as in (H); n = 9. WHB witch hazel bark. K Exemplar traces for TREK-1 in the absence (Control) or presence of tannic acid (500 µM). Scale bars lower left; voltage protocol as in (A) but starting at −120 mV for prepulses; n = 5. L Mean peak prepulse currents at various tannic acid concentrations for TREK-1 traces as in (K); n = 5. M Mean tannic acid dose response for TREK-1 current fold increase at 0 mV for traces as in (K); n = 5. For all panels, error bars indicate SEM. n indicates number of oocytes. Statistical comparisons by one-way ANOVA.
Fig. 8
Fig. 8. In silico docking predicts tannic acid binding to Kv1 pore-proximal extracellular loops.
A Amino acid sequence alignment for human Kv1 isoform pore-proximal regions with divergent residues highlighted. B Left, Kv1.3 pore module structure with each of the four α subunits a different color; right, closeup of boxed region from left with divergent residues showing side chains and colored as in (A). C Kv1.3 pore module structure with tannic acid (red, white and blue) docked using SwissDock; divergent residues from two adjoining α subunits are colored as in (A): (i) top view; (ii) top view closeup; (iii) side view. Enlarged view shown in Supplementary Fig. 2. D Kv1.2 pore module structure with tannic acid docked by SwissDock and divergent residues from two adjoining subunits colored: (i) top view; (ii) top view closeup; (iii) side view showing T383 sidechain swung away from tannic acid; (iv) side view showing tannic acid proximity to E353; (v) side view showing tannic acid proximity to P359.
Fig. 9
Fig. 9. Mutagenesis to investigate tannic acid binding to Kv1 pore-proximal extracellular linkers.
A Upper left, amino acid sequence alignment for human Kv1 isoform pore-proximal regions with divergent residues highlighted; lower left, Kv1.3 mutant sequences; right, mutant clusters colored as on left, shown on Kv1.3 structure with tannic acid docked (as in Fig. 8). B Mean traces for Kv1.1 mutants indicated in the absence (Control) or presence of tannic acid (30 µM); bubbles are blowups of tail currents as indicated. Scale bars lower left for each pair of traces; voltage protocol lower right inset; Mutant 2 was nonfunctional and therefore not tested with tannic acid; n = 4. C Mean peak currents for Kv1.3 Mutant 1 in tannic acid concentrations indicated (left) for traces as in (B); n = 4. D Mean normalized tail currents for Kv1.3 Mutant 1 currents as in (C); n = 4. E Mean unclamped oocyte membrane potential for oocytes as in (C) compared to wild-type Kv1.3 (dashed black line, from Fig. 2P); n = 4. F Mean tannic acid inhibition dose response for Kv1.3 Mutant 1 currents as in (C) compared to wild-type Kv1.3 (dashed black line, from Fig. 2O); n = 4. G Mean peak currents for Kv1.3 Mutant 3 in tannic acid concentrations indicated (left) for traces as in (B); n = 4. H Mean normalized tail currents for Kv1.3 Mutant 3 currents as in (G); n = 4. I Mean unclamped oocyte membrane potential for oocytes as in (G) compared to wild-type Kv1.3 (dashed black line, from Fig. 2P); n = 4. J Mean tannic acid inhibition dose response for Kv1.3 Mutant 3 currents as in (G) compared to wild-type Kv1.3 (dashed black line, from Fig. 2O); n = 4. For all electrophysiology panels, error bars indicate SEM. n indicates number of oocytes. Statistical comparisons by one-way ANOVA.
Fig. 10
Fig. 10. Tannic acid binds preferentially to the C-type inactivated state of Kv1.3.
A Mean traces for the inhibition of Kv1.3 by 30 µM tannic acid during consecutive 200-ms (left) or 2-s (right) pulses. The numbers 1, 2, 5, 8 and 15 refer to pulses. Kv1.3 currents were elicited by a 200-ms or 2-s depolarizing pulse to +40 mV every 60 s for a total of 18 pulses (inset; center). B Inhibition of Kv1.3 by 30 µM tannic acid as in (A). Kv1.3 currents for all pulses were normalized to the control pulse pre-drug; n = 3–6. C Mean traces for the inhibition of Kv1.3 by 30 and 100 µM tannic acid in 4 mM (left) and 160 mM (right) extracellular potassium. Kv1.3 currents were elicited by a 2-s depolarizing pulse to +40 mV from a holding potential of −80 mV (inset; center). D Inhibition of Kv1.3 currents as in (C). Current amplitudes for Kv1.3 in 30 and 100 µM tannic acid were normalized to the control pulse pre-drug; n = 5–9. For all panels, error bars indicate SEM. n indicates number of oocytes. Statistical comparisons by one-way ANOVA.

References

    1. Algren, D. A. et al. Fentanyl-associated fatalities among illicit drug users in Wayne County, Michigan (July 2005-May 2006). J. Med. Toxicol.9, 106–115 (2013). 10.1007/s13181-012-0285-4 - DOI - PMC - PubMed
    1. CDC. Wide-ranging Online Data for Epidemiologic Research(WONDER) (CDC, 2020).
    1. Spencer, M. R., Garnett, M. F., Miniño, A. M. Drug Overdose Deaths in the United States, 2022-2022. NCHS Data Brief No. 491 https://www.cdc.gov/nchs/data/databriefs/db491.pdf (2024). - PubMed
    1. NCCIH. Chronic Pain: What You Need to Know (NCCIH, 2023).
    1. Collom, A. B. Tears of the poppy; a review of the history of opium. J. Kans. Med. Soc.58, 614 (1957). - PubMed

Publication types