. 2024 Dec;30(12):3568-3577.
doi: 10.1038/s41591-024-03232-y. Epub 2024 Aug 28.

Health and economic impacts of Lassa vaccination campaigns in West Africa

Affiliations

Health and economic impacts of Lassa vaccination campaigns in West Africa

David R M Smith et al. Nat Med. 2024 Dec.

Abstract

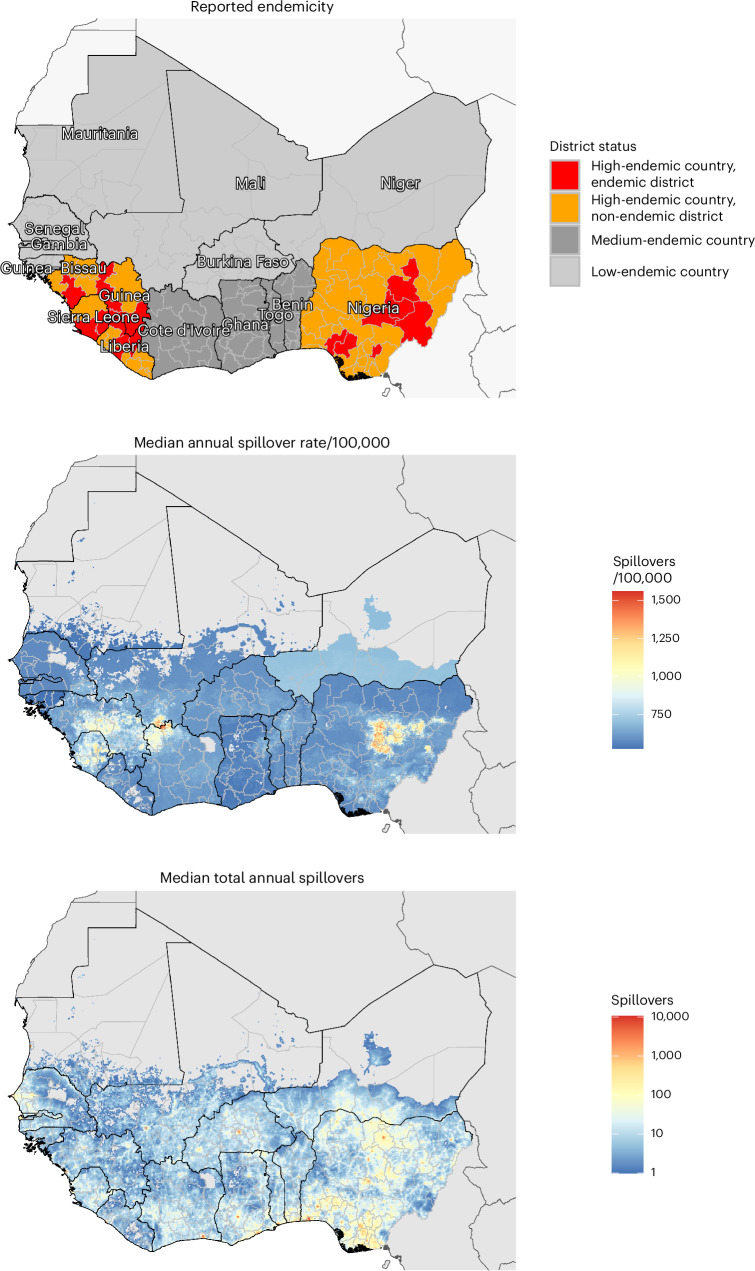
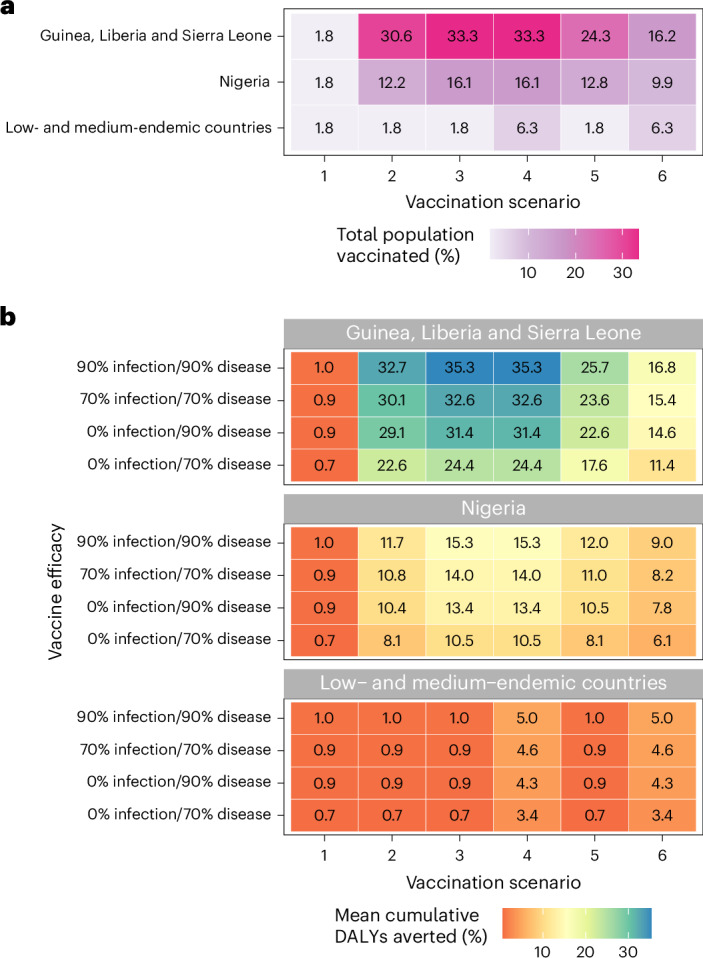
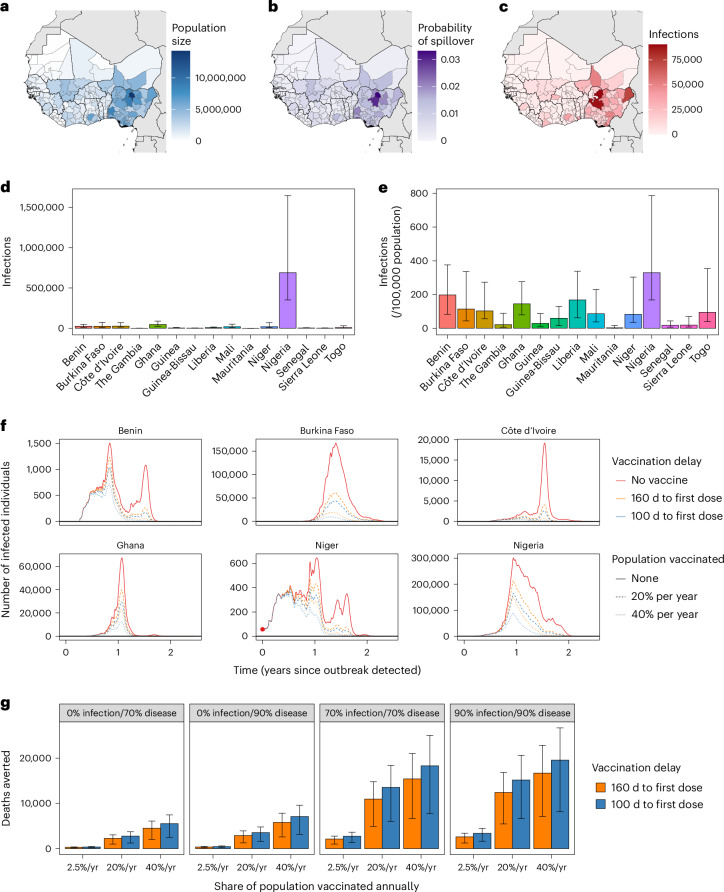
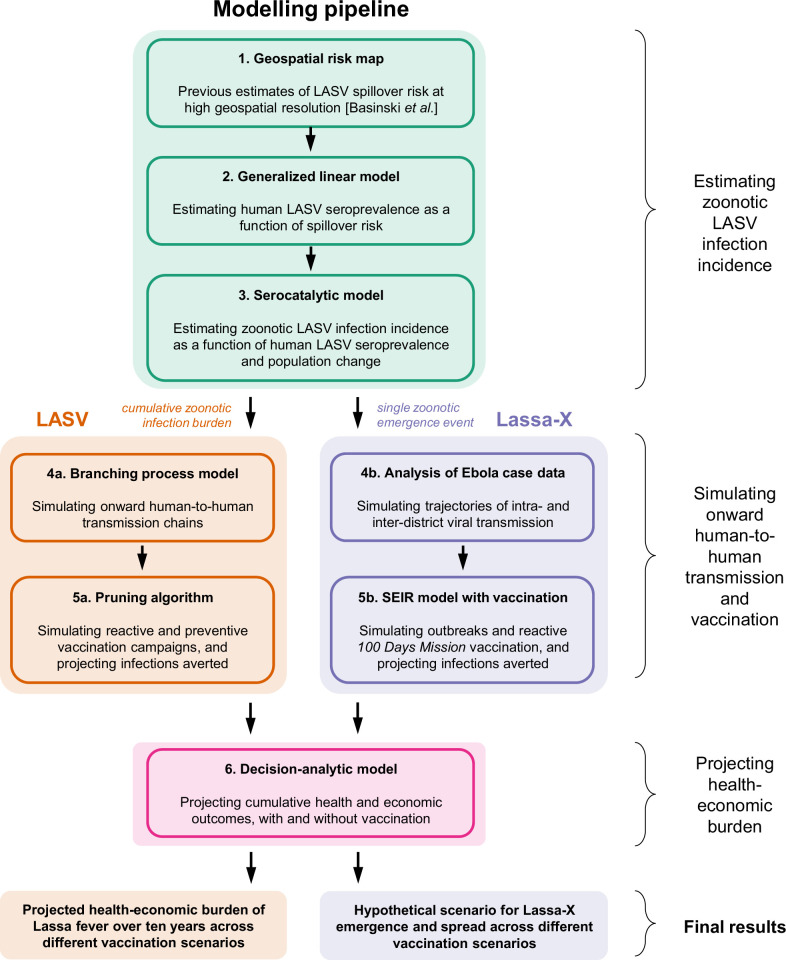
Lassa fever is a zoonotic disease identified by the World Health Organization (WHO) as having pandemic potential. This study estimates the health-economic burden of Lassa fever throughout West Africa and projects impacts of a series of vaccination campaigns. We also model the emergence of 'Lassa-X'-a hypothetical pandemic Lassa virus variant-and project impacts of achieving 100 Days Mission vaccination targets. Our model predicted 2.7 million (95% uncertainty interval: 2.1-3.4 million) Lassa virus infections annually, resulting over 10 years in 2.0 million (793,800-3.9 million) disability-adjusted life years (DALYs). The most effective vaccination strategy was a population-wide preventive campaign primarily targeting WHO-classified 'endemic' districts. Under conservative vaccine efficacy assumptions, this campaign averted $20.1 million ($8.2-$39.0 million) in lost DALY value and $128.2 million ($67.2-$231.9 million) in societal costs (2021 international dollars ($)). Reactive vaccination in response to local outbreaks averted just one-tenth the health-economic burden of preventive campaigns. In the event of Lassa-X emerging, spreading throughout West Africa and causing approximately 1.2 million DALYs within 2 years, 100 Days Mission vaccination averted 22% of DALYs given a vaccine 70% effective against disease and 74% of DALYs given a vaccine 70% effective against both infection and disease. These findings suggest how vaccination could alleviate Lassa fever's burden and assist in pandemic preparedness.


Conflict of interest statement

Competing interests: The authors declare no competing interests.

Figures

Fig. 1
Fig. 1. Maps of West Africa showing reported Lassa fever endemicity and estimated LASV spillover incidence.
Top, map showing the classification of Lassa fever endemicity for different countries and ‘districts’, as defined by the US CDC and the WHO (Supplementary Appendix C.2). Middle, the median annual incidence of zoonotic LASV infection per 100,000 population as estimated by our model at the level of 5-km grid cells. Bottom, the median total annual number of zoonotic LASV infections as estimated by our model at the level of 5-km grid cells.
Fig. 2
Fig. 2. Vaccination coverage and corresponding reductions in Lassa fever burden vary greatly across countries.
a, Share of the total population vaccinated by 10 years in each vaccination scenario (x axis) and aggregated across three geographic levels (y axis). b, Share of cumulative DALYs due to Lassa fever averted over 10 years by vaccination. Impacts vary greatly depending on the vaccination scenario (x axis), the assumed vaccine efficacy (y axis) and the geographic location (panels).
Fig. 3
Fig. 3. Projected burden of Lassa-X infection and impacts of vaccination.
ac, Maps of West Africa showing, for each district: the population size (a), the probability of Lassa-X spillover (b) and the mean cumulative number of Lassa-X infections over the entire outbreak (approximately 2 years) (c). d,e, The second row depicts the median cumulative incidence of Lassa-X infection over the entire outbreak (d) and the median cumulative incidence over the entire outbreak per 100,000 population in the absence of vaccination (e). Interquartile ranges are indicated by error bars (n = 10,000). f, The total number of Lassa-X infections over time in six selected countries in one randomly selected outbreak simulation in which the initial Lassa-X spillover event occurred in Niger (the red dot highlights the initial detection of the epidemic at time 0). Lines show how a vaccine with 70% efficacy against infection and disease influences infection dynamics, where line color represents the delay to vaccine rollout, and line dashing represents the rate of vaccination (the proportion of the population vaccinated over a 1-year period). g, The mean cumulative number of deaths averted due to vaccination over the entire outbreak and across all countries, depending on vaccine efficacy (panels), the rate of vaccination (x axis) and the delay to vaccine rollout (colors). Interquartile ranges are indicated by error bars (n = 10,000). yr, year.
Extended Data Fig. 1
Extended Data Fig. 1. Model schematic.
See Methods for details and Supplementary figure D.1 for a schematic of the decision-analytic model describing disease progression. Pruning in step 5a refers to retrospectively removing infections averted due to vaccination from simulated transmission chains. LASV = Lassa virus.
Extended Data Fig. 2
Extended Data Fig. 2. Impacts of a Lassa vaccine effective against infection and disease.
(A) The mean cumulative number of LASV infections averted due to vaccination across the 15 countries included in the model, comparing vaccine efficacy against infection and disease of 70% (blue) versus 90% (red) across the six considered vaccination scenarios (panels). 95% uncertainty intervals are indicated by shading. (B) The mean cumulative number of infections averted over ten years under each vaccination scenario in the four countries classified as high-endemic (Guinea, Liberia, Nigeria and Sierra Leone). 95% uncertainty intervals are indicated by error bars (n = 9,900). (C) The mean cumulative incidence of infections averted over ten years per 100,000 population under each vaccination scenario in the same four countries. 95% uncertainty intervals are indicated by error bars (n = 9,900). (D) The mean daily number of infections averted by a vaccine with 70% efficacy against infection and disease over the first three years of vaccine rollout, in three distinct districts under four selected vaccination scenarios. 95% uncertainty intervals are indicated by shading.

Update of

Similar articles

Cited by

References

    1. Andersen, K. G. et al. Clinical sequencing uncovers origins and evolution of Lassa virus. Cell162, 738–750 (2015). - PMC - PubMed
    1. Kafetzopoulou, L. E. et al. Metagenomic sequencing at the epicenter of the Nigeria 2018 Lassa fever outbreak. Science363, 74–77 (2019). - PMC - PubMed
    1. Garry, R. F. Lassa fever—the road ahead. Nat. Rev. Microbiol.21, 87–96 (2023). - PMC - PubMed
    1. World Health Organization. Lassa fever. https://www.who.int/health-topics/lassa-fever#tab=tab_1 (2023).
    1. Simons, D. Lassa fever cases suffer from severe underreporting based on reported fatalities. Int. Health15, 608–610 (2023). - PMC - PubMed

MeSH terms

LinkOut - more resources