. 2024 Oct;16(10):2560-2582.
doi: 10.1038/s44321-024-00118-x. Epub 2024 Aug 28.

The evolving genetic landscape of telomere biology disorder dyskeratosis congenita

Affiliations

The evolving genetic landscape of telomere biology disorder dyskeratosis congenita

Hemanth Tummala et al. EMBO Mol Med. 2024 Oct.

Abstract

Dyskeratosis congenita (DC) is a rare inherited bone marrow failure syndrome, caused by genetic mutations that principally affect telomere biology. Approximately 35% of cases remain uncharacterised at the genetic level. To explore the genetic landscape, we conducted genetic studies on a large collection of clinically diagnosed cases of DC as well as cases exhibiting features resembling DC, referred to as 'DC-like' (DCL). This led us to identify several novel pathogenic variants within known genetic loci and in the novel X-linked gene, POLA1. In addition, we have also identified several novel variants in POT1 and ZCCHC8 in multiple cases from different families expanding the allelic series of DC and DCL phenotypes. Functional characterisation of novel POLA1 and POT1 variants, revealed pathogenic effects on protein-protein interactions with primase, CTC1-STN1-TEN1 (CST) and shelterin subunit complexes, that are critical for telomere maintenance. ZCCHC8 variants demonstrated ZCCHC8 deficiency and signs of pervasive transcription, triggering inflammation in patients' blood. In conclusion, our studies expand the current genetic architecture and broaden our understanding of disease mechanisms underlying DC and DCL disorders.

Keywords: POLA1; Dyskeratosis Congenita; Telomeres; ncRNAs.


Conflict of interest statement

The authors declare no competing interests.

Figures

Figure 1
Figure 1. Genetic landscape of dyskeratosis congenita (DC; DC-Like, DCL).
(A) Patient samples were initially categorized based on haematological abnormality, bone marrow (BM) failure-cytopenia/MDS-AML (myelodysplasia-acute myeloid leukaemia). Patients in DC registry include: (i) those with all muco-cutaneous features/triad. (ii) Those with at least two of the four (BM failure, abnormal skin pigmentation, leucoplakia, nail dystrophy,) major features together with at least two “other features”. (iii) Those with at least four out of the six features of Hoyeraal Hreidarsson (HH) syndrome. Patients in DCL registry include those with BM failure and at least one of the “other features” or one muco-cutaneous feature. HH refers to ‘Hoyeraal Hreidarsson’. (B, C) The genetic architecture reveals characterized cases with gene variants that overlap in clinically classified cases of DC and DCL phenotypes. (Dataset EV1, Table 1). (D) Types of variants observed across all affected individuals in known DC genes and in the new loci POLA1. The variant profile includes 336 missense, 58 LoF, 26 deletions, and 3 insertions. In total, 13 variants fell into other category, where predicted protein coding was either duplication or uncertain, were identified across the affected individuals. (E) Structure of the telomerase and telomere regulating complexes highlighting the known genes and 1 new gene POLA1 bound to CST complex that are mutated in the DC and DCL cohort. Dotted lines indicated interactions of protein subunits across these complexes. (F) Telomere lengths measured by either mm-QPCR, southern blotting or HT-STELA in DC and DCL cases.
Figure 2
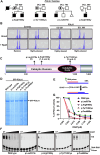
Figure 2. POLA1 variants impact POLA1 catalytic efficiency.
(A) Family pedigrees for individual cases displaying novel variants in a hemizygous state in POLA1. Circle with dot—carrier. (B) Analysis of maternal X-Chromosome inactivation pattern (XCIP). HpaII treatment digests the active allele, allowing amplification exclusively from the inactive allele. (C) Schematic diagram illustrating the presence of variants in the catalytic domain of POLA1. (D) Coomassie staining reveals proteomes of GFP-POLA1 wild-type and variant proteins enriched through GFP-TRAP purification from 293T protein lysates expressing the respective proteins. (E) RNA-DNA duplexes utilized in the in vitro primer extension assay. (F) In vitro POLA1 primer extension activity conducted in the presence of the specific POLA1 inhibitor CD437 toxin. The primer extension activity is visibly inhibited with increasing concentrations of CD437 toxin (0.003 μM, 0.01 μM, 0.05 μM, 0.15 μM and 0.45 μM). (G) POLA1 activity determination based on intensity values of extended species (ES) in each lane, relative to the untreated lane, which is set as 100% POLA activity in each group. Error bars represent SE of mean intensities from n = 3 independent replicate experiments. Source data are available online for this figure.
Figure 3
Figure 3. POT1 variants disrupt POT1 binding to single-strand telomere DNA.
(A) Family pedigrees for individual cases displaying novel variants in heterozygous (+/−) state in POT1. Light grey square/circle—parent with mild phenotype. (BD) Clinical photographs of POT1 patients displaying leucoplakia on the tongue and nail dystrophy in patient 11, as well as abnormal skin pigmentation in patient 12 from family DC 441. (E) A schematic diagram illustrating the location of variants within the conserved domains of POT1. (F) Immunoblot of in vitro translated products demonstrating stable expression of missense mutant POT1 at comparable levels to wild type, with specificity confirmed by the POT1 antibody. (G) Electrophoretic mobility shift assay (EMSA) for wild type and mutant POT1, assessing its binding capacity to a telomere oligonucleotide. (H) Mean intensity of telomere oligonucleotide binding for POT1 variants relative to wild type was determined by measuring the intensity optical density of both ‘specific’ indicated bands on the gel. The data presented with error bars representing standard deviation from n = 3 independent EMSA experiments conducted with in vitro translation reactions. ‘P’ values are calculated by using ordinary one-way ANOVA test. Source data are available online for this figure.
Figure 4
Figure 4. POLA1 and POT1 variants disrupt telomere integrity and induce genome instability.
(A) HT-STELA data, used to characterize telomere length variation in DNA extracted from peripheral blood samples of the patient cohort, revealed truncated telomeres (marked by a dotted line at 2 kb) as well as less amplified higher-sized telomeric products in some POT1 and POLA1 patients. (B, C) HT-STELA data from POLA1 and POT1 patients, plotted alongside predicted percentiles of unaffected individuals (n = 4730) based on age. (D) Western blot analysis of protein lysates demonstrating increased levels of DNA damage response proteins in POT1 patient cells compared to the control, with α-tubulin serving as a loading control. *Indicates lower molecular weight POT1 protein (possibly cleaved or degraded) product specifically observed in patient cells. (E, F) In-cell confocal analysis of proximity ligation assay (PLA) dots in control and POT1 patient cells, confirming interactions between the 53BP1 and RPA70 proteins with the telomere protein TRF2. Data represent means ± standard deviation, n = 2 independent experiments capturing 800 cells in each condition, with ‘P’ values determined by two-tailed unpaired ‘t’ test as reported in the graphs. (G, H) Western blot analysis of proteins in the input and pull-down of cell lysates expressing corresponding proteins using agarose GFP-TRAP and MYC-TRAP beads. Source data are available online for this figure.
Figure 5
Figure 5. Germline ZCCHC8 deficiency does not affect TERC.
(A) Family pedigrees for individual cases displaying novel variants in a heterozygous (+/−) state in ZCCHC8. Light grey square/circle –children with mild phenotype in family DCR 411. (B) HT-STELA data from ZCCHC8 patients, plotted alongside predicted percentiles of unaffected individuals based on age. (C) ZCCHC8 variants mapped onto the Cryo-EM structure (PDB id: 7Z4Y) of the NEXT complex, which includes ZCCHC8, MTR4, and RBM7 subunits. (D) Schematic diagram illustrating the location of variants within the conserved dimerization domain of ZCCHC8. (E) Immunoblotting of HeLa cell lysates expressing MYC-tagged wild-type and variant forms of ZCCHC8. (F) Whole blood RNA samples from ZCCHC8 cases demonstrate increased levels of ZCCHC8 expression compared to unrelated controls. All gene expression levels are normalized to GAPDH or TFRC. Data represent means ± standard deviation, n = 3, with P values determined by one-way ANOVA were reported on the graph. (G) Oligo-dT(20)-primed mature TERC RNA transcripts are distinguished from random hexamer-primed cDNA obtained from RNA samples from ZCCHC8 and PARN patients’ blood (the box represents the mean, and the whiskers represent the standard deviation). Data represent means ± standard deviation, n = 2, with P values determined by one-way ANOVA as reported on the graph. (H) Expression levels of ZCCHC8 and PARN transcripts after transfection with the corresponding siRNA in HeLa cells. Expression is relative to the non-target control in each group. Data represent means ± standard deviation, n = 2, with P values determined by one-way ANOVA as reported on the graph. (I) Oligo-dT(20)-primed mature TERC RNA transcripts are distinguished from random hexamer-primed cDNA obtained from RNA samples treated with siRNA targeting ZCCHC8 and PARN genes. Data represent means ± standard deviation, n = 2, with P values determined by one-way ANOVA as reported on the graph. (J) Genome browser read coverage plots from IGV viewer of RNA-seq reads encompassing ZCCHC8 and TERC loci in ZCCHC8 cases and controls. (K) Percentage of mature (451 bp) and immature (> 451 bp) TERC transcripts in both controls and ZCCHC8 cases obtained from Deseq2 filtered reads. Source data are available online for this figure.
Figure 6
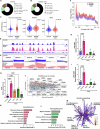
Figure 6. Global transcriptome analysis reveals non-coding RNA dysregulation and inflammation in ZCCHC8 patients’ blood.
(A, B) Transcriptome analysis illustrating the RNA read coverage of various RNA species throughout the genome in both Control and ZCCHC8 patients’ whole blood RNA samples. (C) Alterations in the regulation of small non-coding RNAs, PROMPTs, and enhancer RNAs in control subjects compared to ZCCHC8 patients. p values for all the violin/box plots were calculated using the pairwise two-sided multi-comparison Dunn test, a post hoc test. The box represents interquartile range of RPKM values of the expression of individual elements compared between control (n = 3) and ZCCHC8 cases (n = 3). Violin-box plots indicate the median, bounds indicate the 25th and 75th percentiles, and whiskers limit show 1.5× interquartile range. (D) Genome browser read coverage plots from the IGV viewer displaying RNA-seq read distributions encompassing GAS5 in controls and ZCCHC8 patients (E) Genome browser read coverage plots from the IGV viewer displaying RNA-seq read distributions encompassing snoRD genes in GAS5 locus. (F) Meta-plot showing full-length (>/=5 kb) Long Interspersed Nuclear Element (LINE1 or L1) expression in Controls (blue) and ZCCHC8 cases (salmon) with standard error compared across scaled length of 5.5 kb and 1 kb flanks. (G–I) QPCR analysis of GAS5, L1ORF1 and L1ORF2 RNA transcripts from patient RNA samples of different DC genetic subtypes. Data represent means ± standard deviation, n = 3, with P values determined by one-way ANOVA were reported on graph (J) Gene ontology analysis for dysregulated gene signatures reveal genes involved in myeloid activation, ribosome biogenesis non-coding RNA processing and DNA metabolic process. (KM) Dysregulated gene signatures and upregulation of inflammatory signalling pathways in ZCCHC8 patients as analysed by metascape tool (FDR < 0.05). The size of the circle correlates to number of genes involved in the process. Source data are available online for this figure.
Figure EV1
Figure EV1. Germline variants in POLA1, POT1 and ZCCHC8.
(AC) Alignments were generated using Clustal omega, comparing the amino acid sequences around the sites of the variants identified in this study to other species. The high degree of conservation is evident, and the colour scheme indicates individual amino acid residue type assigned on basis of their profile by default parameters in Clustal omega. ‘*’ indicates highly conserved ‘:’ indicates semi conserved. (D) In HeLa cells expressing, confocal imaging of GFP-tagged POLA1 revealed predominantly nuclear and some cytoplasmic expression of POLA1. Scale bar, 20 μm. (E) This localisation is also confirmed by nuclear and cytoplasmic cell fractionation and subsequent western blotting. TATA-binding protein (TBP) antibody is used nuclear loading control. Source data are available online for this figure.
Figure EV2
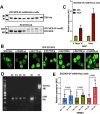
Figure EV2. ZCCHC8 depletion increases TERC and TERRA transcripts in HeLa cells.
(A) Immunoblot showing the reduction of ZCCHC8 protein levels after treatment with indole-3-acetic acid (IAA) at 750 μM for the indicated time points in HeLa-Tir1 cells and ZCCHC8-3F-mAID HeLa cells. TATA-binding protein (TBP) is used as a loading control. (B) Confocal images of GFP-tagged ZCCHC8 in HeLa cells. Panels are representative of images taken from different fields of view in three separate experiments. Scale bar, 20 μm. (C) Oligo-dT(20)-primed mature (3’Oligo ‘A’) TERC RNA transcripts are distinguished from random hexamer-primed (Total) cDNA obtained from RNA samples from both untreated and treated ZCCHC8-3F-mAID HeLa cells with IAA. Data represent standard deviation calculated from means from upper and lower limits derived from n = 2 experiments run in triplicates for each condition. (D) Confirmation of RNA samples devoid of genomic DNA contamination as revealed by ABL primed transcript from cDNAs derived from untreated (0 h) and IAA treated (3 h and 24 h) ZCCHC8-3F-mAID HeLa cells. PC indicates genomic positive control. Data represent means ± standard deviation, from n = 2 experiments, with P values determined by one-way ANOVA as reported on the graph. (E) Telomeric repeat containing RNA transcripts (TERRA) transcripts at indicated chromosomal locations were detected in cDNA samples from untreated (0 h) and IAA treated ZCCHC8-3F-mAID HeLa cells. Data represent means ± standard deviation, from n = 2 experiments, with p values determined by one-way ANOVA as reported on the graph. Source data are available online for this figure.
Figure EV3
Figure EV3. Transposable elements (TE’s) dysregulation in ZCCHC8 patient blood.
(A) Differentially expressed TE subfamilies (log2-fold change > 1 and the P-adjusted value  <  0.05 after Benjamini–Hochberg multiple testing correction of Wald test P value of ZCCHC8 cases vs Controls; log2-fold change on y-axis and mean normalized counts on x-axis) showing either upregulated (black) or downregulated (blue). (B) Plots compare the expression of LTR (Long terminal repeats) subfamilies ERV24, ERVL, HERVH, HERVK and HERVL between Controls (n = 3; blue) and ZCCHC8 cases (n = 3; salmon). P values for all the violin/box plots were calculated using the pairwise two-sided multi-comparison Dunn test, a post hoc test, following Kruskal–Wallis test with Bonferroni correction. Violin-box plots indicate the median, bounds indicate the 25th and 75th percentiles, and whiskers limit show 1.5× interquartile range (C) Circos plot depicting expression of full-length L1 across chromosomal ideogram of younger L1s (L1HS, L1PA2, L1PA3 and L1PA4) and older L1s (L1PA5-L1PA16, L1M1-L1M4, L1P1-L1P4) as RPKM levels for Controls (n = 3; blue) and ZCCHC8 cases (n = 3; salmon). (D, E) Box plot represents differentially expressed (FDR < 0.05) inflammatory responsive genes across three independent samples of controls (n = 3) and ZCCHC8 cases (n = 3). X-axis represent genes and Y-axis represents log10 normalised count. Violin-box plots indicate the median, bounds indicate the 25th and 75th percentiles, and whiskers limit show 1.5× interquartile range.

References

    1. Anderson BH, Kasher PR, Mayer J, Szynkiewicz M, Jenkinson EM, Bhaskar SS, Urquhart JE, Daly SB, Dickerson JE, O’Sullivan J et al (2012) Mutations in CTC1, encoding conserved telomere maintenance component 1, cause Coats plus. Nat Genet 44:338–342. 10.1038/ng.1084 - PubMed
    1. Baranovskiy AG, Babayeva ND, Zhang Y, Gu J, Suwa Y, Pavlov YI, Tahirov TH (2016a) Mechanism of concerted RNA-DNA primer synthesis by the human primosome. J Biol Chem 291(19):10006–20 - PMC - PubMed
    1. Baranovskiy AG, Duong VN, Babayeva ND, Zhang Y, Pavlov YI, Anderson KS, Tahirov TH (2018) Activity and fidelity of human DNA polymerase α depend on primer structure. J Biol Chem 293(18):6824–6843 - PMC - PubMed
    1. Baranovskiy AG, Zhang Y, Suwa Y, Gu J, Babayeva ND, Pavlov YI, Tahirov TH (2016b) Insight into the human DNA primase interaction with template-primer. J Biol Chem 291(9):4793–802 - PMC - PubMed
    1. Boyraz B, Moon DH, Segal M, Muosieyiri MZ, Aykanat A, Tai AK, Cahan P, Agarwal S (2016) Posttranscriptional manipulation of TERC reverses molecular hallmarks of telomere disease. J Clin Investig 126:3377–3382. 10.1172/JCI87547 - PMC - PubMed