. 2024 Jul 23;13(8):886.
doi: 10.3390/antiox13080886.

The Impairment of Endothelial Autophagy Accelerates Renal Senescence by Ferroptosis and NLRP3 Inflammasome Signaling Pathways with the Disruption of Endothelial Barrier

Affiliations

The Impairment of Endothelial Autophagy Accelerates Renal Senescence by Ferroptosis and NLRP3 Inflammasome Signaling Pathways with the Disruption of Endothelial Barrier

Jin Won Kim et al. Antioxidants (Basel). .

Abstract

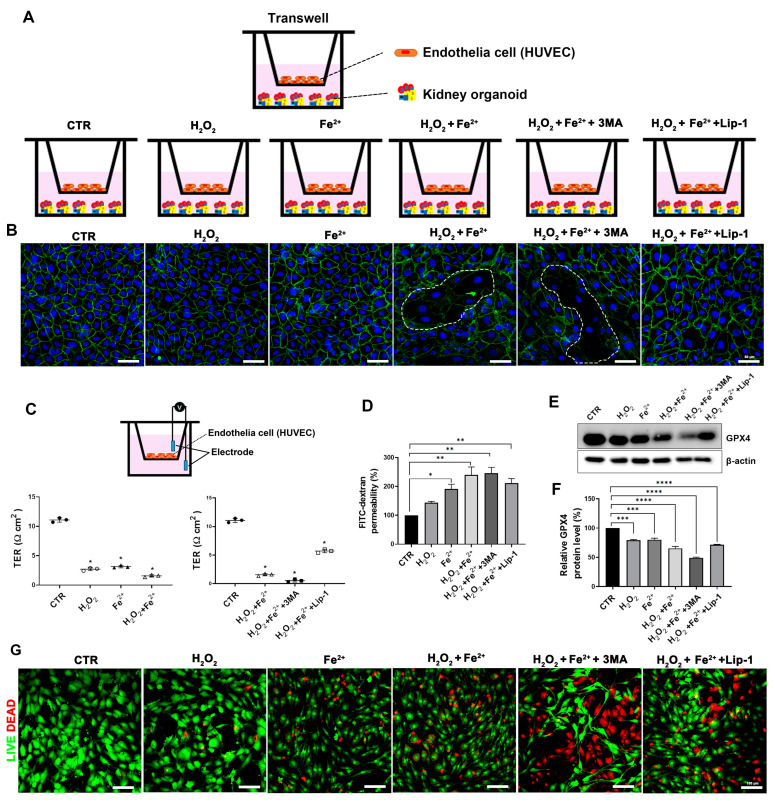
Autophagy is a cellular process that degrades damaged cytoplasmic components and regulates cell death. The homeostasis of endothelial cells (ECs) is crucial for the preservation of glomerular structure and function in aging. Here, we investigated the precise mechanisms of endothelial autophagy in renal aging. The genetic deletion of Atg7 in the ECs of Atg7flox/flox;Tie2-Cre mice accelerated aging-related glomerulopathy and tubulointerstitial fibrosis. The EC-specific Atg7 deletion in aging mice induced the detachment of EC with the disruption of glomerular basement membrane (GBM) assembly and increased podocyte loss resulting in microalbuminuria. A Transwell co-culture system of ECs and kidney organoids showed that the iron and oxidative stress induce the disruption of the endothelial barrier and increase vascular permeability, which was accelerated by the inhibition of autophagy. This resulted in the leakage of iron through the endothelial barrier into kidney organoids and increased oxidative stress, which led to ferroptotic cell death. The ferritin accumulation was increased in the kidneys of the EC-specific Atg7-deficient aging mice and upregulated the NLRP3 inflammasome signaling pathway. The pharmacologic inhibition of ferroptosis with liproxstatin-1 recovered the disrupted endothelial barrier and reversed the decreased expression of GPX4, as well as NLRP3 and IL-1β, in endothelial autophagy-deficient aged mice, which attenuated aging-related renal injury including the apoptosis of renal cells, abnormal structures of GBM, and tubulointerstitial fibrosis. Our data showed that endothelial autophagy is essential for the maintenance of the endothelial barrier during renal aging and the impairment of endothelial autophagy accelerates renal senescence by ferroptosis and NLRP3 inflammasome signaling pathways. These processes may be attractive therapeutic targets to reduce cellular injury from renal aging.

Keywords: aging; autophagy; kidney; liproxstatin-1.


Conflict of interest statement

The authors declare no conflicts of interest.

Figures

Figure 1
Figure 1
Increase in renal fibrosis in aging kidneys of Atg7flox/flox;Tie2-Cre+ mice. (A) Representative immunoblots and densitometry for the expression of Atg7. (B) Relative protein level of Atg7 (%). (C) Representative images of H&E staining from wild-type and Atg7flox/flox;Tie2-Cre+ mice. Scale bars, 100 μm. (D) Quantification of glomeruli diameters (µm). (E) Representative 3,3′-diaminobenzidine (DAB) staining for CD31. Scale bars, 50 μm. (F) Quantification of capillary lumen diameters (µm). (G) Representative immunoblots and densitometry for the expression of CD31. (H) Relative protein levels of CD31 (%). (I) Masson’s trichrome staining from wild-type and Atg7flox/flox;Tie2-Cre mice, showing the cortex and medulla with increased extracellular matrix deposition in the aging Atg7flox/flox;Tie2-Cre+ mouse. (J) Quantification of tubulointerstitial fibrosis (%). (K) Representative DAB staining for TGF-β. (L) Quantification of TGF-β positive areas (%). (M) Representative immunoblots and densitometry for expression of TGF-β. (N) Relative protein level of TGF-β (%). (O) Representative DAB staining for α-SMA. (P) Quantification of α-SMA-positive areas (%). (Q) Representative immunoblots and densitometry for expression of α-SMA. (R) Relative protein levels of α-SMA (%). Scale bars, 50 μm for cortex and 100 μm for medulla. Values are means ± SEM. *, p < 0.05; **, p < 0.01; ***, p < 0.001; ****, p < 0.0001, ns: not significant.
Figure 2
Figure 2
Loss of podocytes, the deterioration of slit diaphragms, and the accumulation of ferritin by EC-specific autophagy deletion in the renal aging of Atg7flox/flox;Tie2-Cre+ mice. (A) Representative TEM images showing the structural integrity of slit diaphragms in an aging WT mouse kidney (a’, red arrowhead) and the lamina rara interna detached from the lamina densa in some portions of the GBM (b’, red arrow) and apoptotic podocytes (c’, red asterisk) in the aging kidneys of Atg7flox/flox;Tie2-Cre+ mice. (B) Representative 3,3′-diaminobenzidine (DAB) staining for WT1. Scale bars, 50 μm. (C) Quantification of WT1-positive areas (%). (D) Representative immunofluorescent staining for WT1 (red) and CD31 (green). Scale bars, 20 μm. (E) Measurement of microalbuminuria in urine for 24 h from aging wild-type and aging Atg7f/f;Tie2-Cre+ mice. Values are means ± SEM. **, p < 0.01; ****, p < 0.0001, ns: not significant.
Figure 3
Figure 3
Liproxstatin-1 treatment increases the glutathione peroxidase (GPX4) and decreases the ferritin accumulation in the renal aging of Atg7flox/flox;Tie2-Cre+ mice. (A) Representative 3,3′-diaminobenzidine (DAB) staining for ferritin light chain. Scale bars, 100 μm. (B) Quantification of ferritin light chain-positive areas (%). (C) Representative immunoblots and densitometry for the expression of ferritin light chain. (D) Relative protein levels of ferritin light chain (%). (E,F) Representative immunoblots and densitometry for the expression and relative protein levels of GPX4 (%). (G) Representative immunofluorescent staining for 4HNE (red) and CD31 (green). Scale bars, 50 μm. (H) Quantification of 4HNE positive areas (%). (I,J) Representative immunoblots and densitometry for the expression and relative protein levels of GPX4 (%). (KN) Representative immunoblots and densitometry for the expression of ferritin light and heavy chain sand relative protein levels of ferritin light and heavy chains (%). (O) Representative 3,3′-diaminobenzidine (DAB) staining for ferritin light chain. Scale bars, 100 μm. (P) Quantification of ferritin light chain-positive areas (%). Values are means ± SEM. *, p < 0.05; **, p < 0.01, ***; p < 0.001, ****; p < 0.0001.
Figure 4
Figure 4
Attenuated renal aging in endothelial autophagy-deficient aging kidneys by liproxstatin-1. (A) Representative 3,3′-diaminobenzidine (DAB) staining for α-SMA and Masson’s trichrome staining. Scale bars, 100 μm. (B) Quantification of α-SMA positive areas (%). (C) Quantification of tubulointerstitial fibrosis (%). (D) Representative TEM images showing the apoptotic podocytes and structural integrity of slit diaphragms. The thickness of the glomerular basement membrane increased in aging Atg7flox/flox;Tie2-Cre+ mouse kidneys (b’) compared to aging WT kidneys (a’). Liproxstatin-1 treatment attenuated the increased thickness of the glomerular basement membrane in aging Atg7flox/flox; Tie2-Cre+ mouse kidneys (c’). (E) Quantification of glomerular basement membrane thickness (nm). (F) Immunostaining for the expression and (G) quantification of TUNEL-positive cells. Scale bars, 50 μm. Values are means ± SEM. *, p < 0.05; **, p < 0.01; ***, p < 0.001; ****, p < 0.0001.
Figure 5
Figure 5
The liproxstatin-1 regulation of ferroptosis in endothelial cells in vitro. (A) Schematic diagram of ferroptosis model using kidney organoids in vitro. (B) Immunofluorescent tight junction staining in HUVECs. Distribution of the tight junction (VE-cadherin) and DAPI showing the distribution of HUVEC nuclei. The White dashes indicate damaged tight junction. Scale bars, 50 μm. (C) Transwell assay; TEER measurement of endothelial cells. (D) FITC-dextran permeated in the medium was evaluated to assay the permeability of HUVECs in each group. (E) Representative immunoblots and densitometry of the expression of GPX4. (F) Relative protein levels of GPX4 (%). (G) Representative images of live/dead staining. Scale bars: 100 μm. Values are means ± SEM. *, p < 0.05; **, p < 0.01; ***, p < 0.001; ****, p < 0.0001.
Figure 6
Figure 6
The liproxstatin-1 regulation of ferroptosis in kidney organoid–endothelial cells in vitro using the Transwell system. (AD) The iron level (total and iron III) in media of the lower compartment and kidney organoids was detected using an iron assay kit. (E) Measurement of fluorescence intensity by DCFDA/H2DCFDA. (F) Representative images of live/dead staining. Scale bars: 50 μm. (G) Kidney organoid viability according to the CellTiter-Glo 3D Reagent Cell Viability Assay. (H,I) qRT-PCR analysis of Airm2 and SLC7A11 gene (n = 3). Values are means ± SEM. *, p < 0.05; **, p < 0.01; ***, p < 0.001; ****, p < 0.0001.
Figure 7
Figure 7
Increase in oxidative stress and the activation of the inflammasome pathway in renal aging of Atg7flox/flox;Tie2-Cre+ mice. (A) Representative 3,3′-diaminobenzidine (DAB) staining for 8-OHdG. Scale bars, 50 μm. (B) Quantification of 8-OHdG positive areas (%). (C) Representative immunofluorescent staining for IL-1β (red) and CD31 (green). Scale bars, 50 μm. (D) Representative DAB staining for IL-1β. Scale bars, 50 μm. (E) Quantification of IL-1β positive areas (%). (F) Representative immunoblots and densitometry for the expression of NLRP3. (G) Representative immunoblots and densitometry for the expression of IL-1β. (H,I) Relative protein levels of NPRP3 and IL-1β (%). (J) Representative immunoblots and densitometry for the expression of caspase-1. (K) Representative immunoblots and densitometry for the expression of c-Myc. (L,M) Relative protein levels of Caspase-1 and c-Myc (%). (N,O) Representative immunoblots and densitometry for the expression and relative protein levels of NPRP3. (P,Q) Representative immunoblots and densitometry for the expression and relative protein levels IL-1β. (R) Representative 3,3′-diaminobenzidine (DAB) staining for 8-OHdG. Scale bars, 50 μm. Values are means ± SEM. *, p < 0.05; **, p < 0.01, ***; p < 0.001, ****; p < 0.0001, ns: not significant.
Figure 8
Figure 8
Schematic overview.

Similar articles

Cited by

References

    1. Bolignano D., Mattace-Raso F., Sijbrands E.J., Zoccali C. The aging kidney revisited: A systematic review. Ageing Res. Rev. 2014;14:65–80. doi: 10.1016/j.arr.2014.02.003. - DOI - PubMed
    1. Schmitt R., Melk A. Molecular mechanisms of renal aging. Kidney Int. 2017;92:569–579. doi: 10.1016/j.kint.2017.02.036. - DOI - PubMed
    1. Hong Y.A., Ban T.H., Kang C.-Y., Hwang S.D., Choi S.R., Lee H., Jung H.-Y., Kim K., Kwon Y.E., Kim S.H. Trends in epidemiologic characteristics of end-stage renal disease from 2019 Korean Renal Data System (KORDS) Kidney Res. Clin. Pract. 2021;40:52. doi: 10.23876/j.krcp.20.202. - DOI - PMC - PubMed
    1. Merchant R.A., Vathsala A. Healthy aging and chronic kidney disease. Kidney Res. Clin. Pract. 2022;41:644. doi: 10.23876/j.krcp.22.112. - DOI - PMC - PubMed
    1. Kim H., Jeong S.A., Kim K.M., Hwang S.D., Choi S.R., Lee H., Kim J.H., Kim S.H., Kim T.H., Koo H.-S. Trends in clinical outcomes of older hemodialysis patients: Data from the 2023 Korean Renal Data System (KORDS) Kidney Res. Clin. Pract. 2024;43:263. doi: 10.23876/j.krcp.23.267. - DOI - PMC - PubMed

LinkOut - more resources