. 2024 Jul 25;13(8):901.
doi: 10.3390/antiox13080901.

Targeting Circadian Protein Rev-erbα to Alleviate Inflammation, Oxidative Stress, and Enhance Functional Recovery Following Brain Trauma

Affiliations

Targeting Circadian Protein Rev-erbα to Alleviate Inflammation, Oxidative Stress, and Enhance Functional Recovery Following Brain Trauma

Arief Gunawan Darmanto et al. Antioxidants (Basel). .

Abstract

Traumatic brain injury (TBI) is a significant cause of morbidity and mortality worldwide, and its pathophysiology is characterized by oxidative stress and inflammation. Despite extensive research, effective treatments for TBI remain elusive. Recent studies highlighted the critical interplay between TBI and circadian rhythms, but the detailed regulation remains largely unknown. Motivated by the observed sustained decrease in Rev-erbα after TBI, we aimed to understand the critical role of Rev-erbα in the pathophysiology of TBI and determine its feasibility as a therapeutic target. Using a mouse model of TBI, we observed that TBI significantly downregulates Rev-erbα levels, exacerbating inflammatory and oxidative stress pathways. The regulation of Rev-erbα with either the pharmacological activator or inhibitor bidirectionally modulated inflammatory and oxidative events, which in turn influenced neurobehavioral outcomes, highlighting the protein's protective role. Mechanistically, Rev-erbα influences the expression of key oxidative stress and inflammatory regulatory genes. A reduction in Rev-erbα following TBI likely contributes to increased oxidative damage and inflammation, creating a detrimental environment for neuronal survival and recovery which could be reversed via the pharmacological activation of Rev-erbα. Our findings highlight the therapeutic potential of targeting Rev-erbα to mitigate TBI-induced damage and improve outcomes, especially in TBI-susceptible populations with disrupted circadian regulation.

Keywords: NR1D1; SR8278; SR9009; inflammation; neuronal cell death; oxidative stress; traumatic brain injury.


Conflict of interest statement

The authors declare no conflicts of interest.

Figures
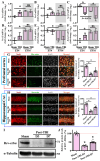
Figure 1
Figure 1
Alteration in the levels of circadian genes following TBI. (AF) Quantification of the fold changes in gene expression levels of Per1, Per2, Nr1d1, Nr1d2, Clock, and Bmal1 between different experimental groups at ZT4 and ZT16. n = 5 mice. ZT4 (Zeitgeber time) refers to the time 4 h after lights are turned on, and ZT16 represents the time 4 h after lights off. (G) Representative images and quantitative analyses for the expression of Rev-erbα-positive (green), neuron (NeuN, red) and DAPI (grey) in the prefrontal cortex between different experimental groups (scale = 20 μm). n = 10 images from 4 mice. (H) Representative images and quantitative analyses for the expression of Rev-erbα-positive (green), neuron (NeuN, red) and DAPI (grey) in the hippocampal CA1 regions between different experimental groups (scale = 20 μm). n = 10 images from 4 mice. (I,J) Representative Western blots and quantitative analyses for the relative protein expression levels of Rev-erbα between different experimental groups. All the results were presented as mean ± SEM and analyzed by a one-way ANOVA followed by Bonferroni’s post hoc analysis. * p < 0.05; ns represents not significant.
Figure 2
Figure 2
Correlation of the levels of circadian genes with TBI-related phenotypes. (A) The illustrating image demonstrates the experimental procedures for the correlation analyses to examine the relationship between individual expression levels of circadian genes with their behavioral outcomes post-TBI. (B) Pearson’s correlation plots for the relative Nr1d1 levels with individual motor or cognitive function after TBI. (C) Pearson’s correlation plots for the relative Nr1d2 levels with individual motor or cognitive function after TBI. (D) Pearson’s correlation plots for the relative Per1 levels with individual motor or cognitive function after TBI. n = 15 mice.
Figure 3
Figure 3
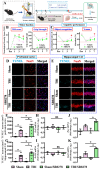
Pharmacological inhibition of Rev-erbα slows down recovery from TBI. (A) The illustrating image demonstrates the procedures for the experimental designs. (B) Behavioral performance for the evaluation of motor function based on neurological severity scores and grip strength at different time points after TBI challenge. Data are presented as mean ± SEM. n = 10 mice. (C) Cognitive performance was evaluated based on the object recognition and Y-maze task at different time points after TBI challenge. Data are presented as mean ± SEM. n = 10 mice. (D) Representative images for the TUNEL-positive (cyan), neuron (NeuN, red) and DAPI (blue) signals in the prefrontal cortex from different experimental groups (scale = 20 μm). (E) Representative images for the TUNEL-positive (cyan), neuron (NeuN, red) and DAPI (blue) in the hippocampal CA1 regions from different experimental groups (scale = 20 μm). (F) Quantification of the number of TUNEL-positive neuronal cells in the prefrontal cortex. n = 10 images from 4 mice. (G) Quantification of the number of TUNEL-positive neuronal cells in the hippocampal CA1 regions from different experimental groups. n = 10 images from 4 mice. (HK) Quantification of the fold changes in gene expression levels of Bcl2, Bcl2l1, Bax and Bak1 in the hippocampus between different experimental groups. n = 5 mice. Data are presented as mean ± SEM and then analyzed by the one-way ANOVA test followed by Bonferroni’s post hoc analysis. * p < 0.05; ns represents not significant.
Figure 4
Figure 4
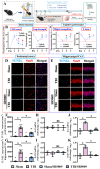
Pharmacological activation of Rev-erbα promotes functional recovery from TBI. (A) The illustrating image demonstrates the procedures for the experimental designs with SR9009. (B) Behavioral performance for the evaluation of motor function based on neurological severity scores and grip strength at different time points after TBI challenge. Data are presented as mean ± SEM. n = 10 mice. (C) Behavioral performance for the evaluation of cognitive function was evaluated based on object recognition and the Y-maze task at different time points after TBI challenge. Data are presented as mean ± SEM. n = 10 mice. (D) Representative images for the TUNEL-positive (cyan), neuron (NeuN, red) and DAPI (blue) assays in the prefrontal cortex from different experimental groups (scale = 20 μm). (E) Representative images for the TUNEL-positive (cyan), neuron (NeuN, red) and DAPI (blue) in the hippocampal CA1 regions from different experimental groups (scale = 20 μm). (F) Quantification of the number of TUNEL-positive neuronal cells in the prefrontal cortex. n = 10 images from 4 mice. (G) Quantification of the number of TUNEL-positive neuronal cells in the hippocampal CA1 regions from different experimental groups. n = 10 images from 4 mice. (HK) Quantification of the fold changes in gene expression levels of Bcl2, Bcl2l1, Bax and Bak1 in the hippocampus at three days post-CCI surgery. n = 5 mice. Data are presented as mean ± SEM and then analyzed by the one-way ANOVA test followed by Bonferroni’s post hoc analysis. * p < 0.05; ns represents not significant.
Figure 5
Figure 5
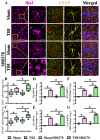
Exaggeration of TBI-induced inflammatory responses by SR8278. (A) Representative images showing the IBA1-positive microglial cells (magenta) with the GFAP-positive astrocytes (yellow) from different experimental groups. DAPI (blue) is used for the nuclear stain (scale = 20 μm). (B) Quantitative analyses of the percentage in the area of IBA1-positive cell coverage between different experimental groups. n = 10 images from 4 mice. (C) Quantitative analyses of the percentage in the area of GFAP-positive cell coverage between different experimental groups. n = 10 images from 4 mice. (DG) Quantification of the fold changes in gene expression levels of Tnf, Il-6, Il-1β, and Cxcl1 between different experimental groups of animals. n = 5 mice. Data are presented as mean ± SEM and then analyzed by the one-way ANOVA test followed by Bonferroni’s post hoc analysis. * p < 0.05.
Figure 6
Figure 6
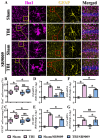
Amelioration of TBI-induced inflammatory responses by SR9009. (A) Representative images showing the IBA1-positive microglial cells (magenta) with the GFAP-positive astrocytes (yellow) in the hippocampal CA1 regions from different experimental groups. DAPI (blue) is used for the nuclear stain (scale = 20 μm). (B) Quantitative analyses of the percentage in the area of IBA1-positive cell coverage between different experimental groups. n = 10 images from 4 mice. (C) Quantitative analyses of the percentage in the area of GFAP-positive cell coverage between different experimental groups. n = 10 images from 4 mice. (DG) Quantification of the fold changes in gene expression levels of different cytokines and chemokines such as Tnf, Il-6, Il-1β, and Cxcl1 between different experimental groups of animals. n = 5 mice. Data are presented as mean ± SEM and then analyzed by the one-way ANOVA test followed by Bonferroni’s post hoc analysis. * p < 0.05; ns represents not significant.
Figure 7
Figure 7
Exaggeration of TBI-induced excessive oxidative stress by SR8278. (A) Representative images showing the 4HNE-positive (green) neurons (NeuN, red) in the hippocampal CA1 regions from different experimental groups. DAPI (blue) is used for the nuclear stain (scale = 20 μm). (B) Representative images showing the 8-oxo-dG-positive (green) neurons (NeuN, red) in the hippocampal CA1 regions from different experimental groups. DAPI (blue) is used for the nuclear stain (scale = 20 μm). (C) Quantitative analyses of the percentage in 4HNE-positive neuronal cells between different experimental groups. n = 10 images from 4 mice. (D) Quantitative analyses of the number of 8-oxo-dG-positive neuronal cells between different experimental groups. n = 10 images from 4 mice. Data are presented as mean ± SEM and then analyzed by the one-way ANOVA test followed by Bonferroni’s post hoc analysis. * p < 0.05.
Figure 8
Figure 8
Amelioration of TBI-induced oxidative stress overload by SR9009. (A) Representative images showing the 4HNE-positive (green) neurons (NeuN, red) in the hippocampal CA1 regions from different experimental groups. DAPI (blue) is used for the nuclear stain (scale = 20 μm). (B) Representative images showing the 8-oxo-dG-positive (green) neurons (NeuN, red) from different experimental groups. DAPI (blue) is used for the nuclear stain (scale = 20 μm). (C) Quantitative analyses of the percentage of 4HNE-positive neuronal cells between different experimental groups. n = 10 images from 4 mice. (D) Quantitative analyses of the number of 8-oxo-dG-positive neuronal cells between different experimental groups. n = 10 images from 4 mice. Data are presented as mean ± SEM and then analyzed by the one-way ANOVA test followed by Bonferroni’s post hoc analysis. * p < 0.05.
Figure 9
Figure 9
Bidirectional modulation of the molecules related to oxidative stress by Rev-erbα. (A) Quantitative analyses of the fold changes in gene expression levels of Nfe2l2, Sod1, Sod2, and Cat for the experiments with SR8278 application between different experimental groups. n = 5 mice. (B) Quantitative analyses of the fold changes in gene expression levels of Nfe2l2, Sod1, Sod2, and Cat for the experiments with SR9009 application between different experimental groups. n = 5 mice. (C) Representative images showing the SOD1-positive (cyan) neurons (NeuN, red) in the hippocampal CA1 regions from different experimental groups. DAPI (blue) is used for the nuclear stain (scale = 20 μm). (D) Quantitative analyses of the relative signal intensity of SOD1-positive neuronal cells between different experimental groups. n = 10 images from 4 mice. Data are presented as mean ± SEM and then analyzed by the one-way ANOVA test followed by Bonferroni’s post hoc analysis. * p < 0.05; ns represents not significant.
Figure 10
Figure 10
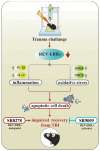
A working model summarizing the key findings of our current study. Following the challenge of traumatic brain damage, there is a significant reduction in Rev-erbα levels, a protein essential for modulating inflammatory responses and oxidative stress. The sustained dysregulation in Rev-erbα function pathologically leads to exaggerated inflammatory events and oxidative stress overload and eventually contributes to increased apoptotic cell death and affects functional recovery of the brain. Mechanistically, changes in activity of Rev-erbα modulates the expression of key oxidative stress regulatory genes such as NRF2 and SOD1, as well as the production of inflammatory mediators like TNF-α, IL-6, and IL-1β. These processes can be bidirectionally modulated by the pharmacological activator SR9009 or the inhibitor SR8278 targeting Rev-erbα. This research highlights the crucial role of circadian genes, particularly Rev-erbα, in the recovery process following brain trauma, suggesting new potential therapeutic approaches for treating brain injuries.

References

    1. Maas A.I.R., Menon D.K., Adelson P.D., Andelic N., Bell M.J., Belli A., Bragge P., Brazinova A., Büki A., Chesnut R.M., et al. Traumatic brain injury: Integrated approaches to improve prevention, clinical care, and research. Lancet Neurol. 2017;16:987–1048. doi: 10.1016/S1474-4422(17)30371-X. - DOI - PubMed
    1. Dewan M.C., Rattani A., Gupta S., Baticulon R.E., Hung Y.C., Punchak M., Agrawal A., Adeleye A.O., Shrime M.G., Rubiano A.M., et al. Estimating the global incidence of traumatic brain injury. J. Neurosurg. 2018;130:1080–1097. doi: 10.3171/2017.10.JNS17352. - DOI - PubMed
    1. Corrigan J.D., Selassie A.W., Orman J.A. The Epidemiology of Traumatic Brain Injury. J. Head Trauma Rehabil. 2010;25:72–80. doi: 10.1097/HTR.0b013e3181ccc8b4. - DOI - PubMed
    1. Whiteneck G.G., Cuthbert J.P., Corrigan J.D., Bogner J.A. Risk of Negative Outcomes after Traumatic Brain Injury: A Statewide Population-Based Survey. J. Head Trauma Rehabil. 2016;31:E43–E54. doi: 10.1097/HTR.0000000000000141. - DOI - PubMed
    1. Howe E.I., Andelic N., Fure S.C.R., Røe C., Søberg H.L., Hellstrøm T., Spjelkavik Ø., Enehaug H., Lu J., Ugelstad H., et al. Cost-effectiveness analysis of combined cognitive and vocational rehabilitation in patients with mild-to-moderate TBI: Results from a randomized controlled trial. BMC Health Serv. Res. 2022;22:185. doi: 10.1186/s12913-022-07585-3. - DOI - PMC - PubMed

LinkOut - more resources