. 2024 Aug 19;13(8):1003.
doi: 10.3390/antiox13081003.

Photobiomodulation Mitigates PM2.5-Exacerbated Pathologies in a Mouse Model of Allergic Asthma

Affiliations

Photobiomodulation Mitigates PM2.5-Exacerbated Pathologies in a Mouse Model of Allergic Asthma

Jisu Park et al. Antioxidants (Basel). .

Abstract

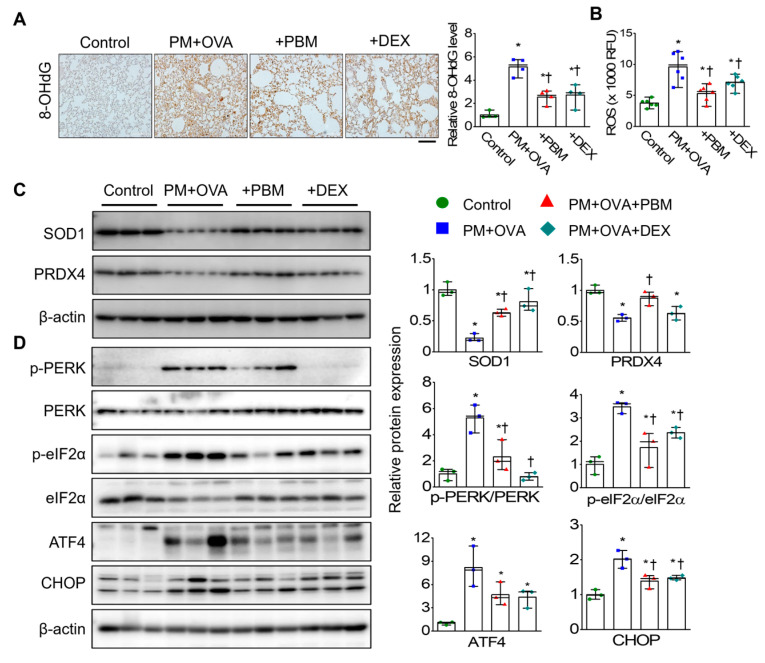
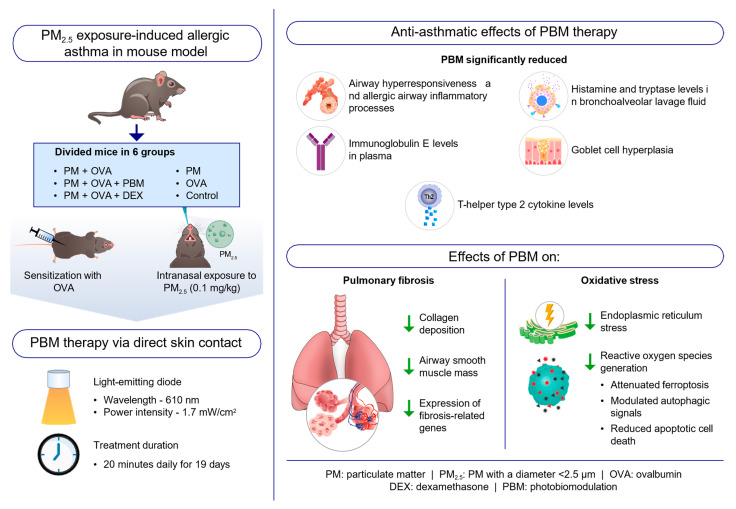
Exposure to particulate matter (PM), especially PM2.5, is known to exacerbate asthma, posing a significant public health risk. This study investigated the asthma-reducing effects of photobiomodulation (PBM) in a mice model mimicking allergic airway inflammation exacerbated by PM2.5 exposure. The mice received sensitization with ovalbumin (OVA) and were subsequently treated with PM2.5 at a dose of 0.1 mg/kg every 3 days, for 9 times over 3 weeks during the challenge. PBM, using a 610 nm wavelength LED, was applied at 1.7 mW/cm2 to the respiratory tract via direct skin contact for 20 min daily for 19 days. Results showed that PBM significantly reduced airway hyperresponsiveness, plasma immunoglobulin E (IgE) and OVA-specific IgE, airway inflammation, T-helper type 2 cytokine, histamine and tryptase in bronchoalveolar lavage fluid (BALF), and goblet cell hyperplasia in PM2.5-exposed asthmatic mice. Moreover, PBM alleviated subepithelial fibrosis by reducing collagen deposition, airway smooth muscle mass, and expression of fibrosis-related genes. It mitigated reactive oxygen species generation, oxidative stress, endoplasmic reticulum stress, apoptotic cell death, ferroptosis, and modulated autophagic signals in the asthmatic mice exposed to PM2.5. These findings suggest that PBM could be a promising intervention for PM2.5-induced respiratory complications in patients with allergic asthma.

Keywords: asthma; ferroptosis; oxidative stress; particulate matter (PM2.5); photobiomodulation.


Conflict of interest statement

The authors declare no conflicts of interest.

Figures

Figure 1
Figure 1
Inhibitory effects of PBM on the induction of airway hyperresponsiveness (AHR) and plasma IgE in a PM2.5-exposed asthma exacerbation model. (A) Establishment of an allergic asthma exacerbation mouse model induced by PM2.5 exposure. A timeline describing the asthma exacerbation model induction and PBM treatment. (B) Measurement of body weight, thymus-to-body-weight ratio, and spleen-to-body-weight ratio on the final day of the experiment. (C) Assessment of AHR to methacholine (MCh) at concentrations of 25 and 50 mg/mL. (D) Measurement of total immunoglobulin E (IgE) and ovalbumin (OVA)-specific IgE in plasma. Data are shown as the mean ± SEM (n = 8). * p < 0.05 compared with control.  p < 0.05 compared with PM + OVA. i.n., intranasal injection; i.p., intraperitoneal injection; BW, body weight; PM, particulate matter; OVA, ovalbumin; PBM, photobiomodulation; DEX, dexamethasone.
Figure 2
Figure 2
Inhibitory effects of PBM on the elevation of allergic airway inflammation and goblet cell metaplasia in a PM2.5-exposed asthma exacerbation model. (A) Measurement of total and differential inflammatory cell counts (macrophage, neutrophils, lymphocytes, and eosinophils) in bronchoalveolar lavage fluid (BALF). (B) Evaluation of Th2 cytokines including interleukin (IL)-4, IL-5, and IL-13 in BALF. (C) Assessment of histamine and mast cell tryptase in BALF. (D) Representative images of H&E staining revealed the infiltration of inflammatory cells in lung tissues. Scale bar represents 200 µm (up) and 100 µm (down). The bar graphs represent the summarized score of inflammation. (E) Goblet cells secreting mucus in lung tissues were identified using PAS staining. The bar graphs represent the number of PAS-reactive airway epithelial cells. Scale bar represents 50 µm. The bar graphs represent the summarized scores of PAS-positive mucus-producing cells. Data are shown as the mean ± SEM (n = 8). * p < 0.05 compared with control.  p < 0.05 compared with PM + OVA.  p < 0.05 compared with PM + OVA + PBM.
Figure 3
Figure 3
Inhibitory effects of PBM on the elevation of subepithelial fibrosis in a PM2.5-exposed asthma exacerbation model. Representative histological images showing (A) lung collagen fiber (Masson’s trichrome staining) and (B) collagen deposition (Sirius Red staining) in the lung tissues. Scale bar represents 100 µm. The bar graphs represent the summarized scores of collagen fiber deposition (n = 8). (C) Representative images of α-smooth muscle actin (α-SMA) and FITC expression, as determined by immunohistochemistry, in bronchioles of similar size. Scale bar represents 20 µm. The bar graphs represent the area of α-SMA staining per micrometer length of the bronchiolar basement membrane (µm2/µm; n = 6). (D) Detection of the mRNA levels of Acta2, Tgfb1, Col1a1, and Col3a1 in lung tissues using qRT-PCR (n = 4). Data are shown as the mean ± SEM. * p < 0.05 compared with control.  p < 0.05 compared with PM + OVA.
Figure 4
Figure 4
Inhibitory effects of PBM on the ROS-mediated ER stress in a PM2.5-exposed asthma exacerbation model. (A) Representative lung sections were stained with antibody specific for 8-hydroxy-2′-deoxyguanosine (8-OHdG). Bar graphs represent the quantification of positive areas of 8-OHdG in each experimental group (n = 4). Scale bar represents 100 µm. (B) ROS levels in lung tissue were measured in relative fluorescence units (RFU). (C) Protein expression of superoxide dismutase 1 (SOD1) and peroxiredoxin 4 (PRDX4). (D) ER stress markers (PERK, eIF2α, ATF4, and CHOP) in lung tissues by Western blotting. β-actin was used as a loading control. Bar graphs represent the quantification protein expression (n = 3). Data are shown as the mean ± SEM. * p < 0.05 compared with control.  p < 0.05 compared with PM + OVA.
Figure 5
Figure 5
Inhibitory effects of PBM on the cell death in a PM2.5-exposed asthma exacerbation model. (A) Representative immunofluorescence for TUNEL (green) and DAPI (blue) staining. Scale bar represents 50 µm. Bar graphs represent TUNEL (+)/DAPI (+) cells in the lung tissues (n = 3). (B) Apoptotic markers in lung tissues. Bar graphs represent the quantification protein expression (n = 3). Bar graphs represent the quantification protein expression (n = 3). Data are shown as the mean ± SEM. * p < 0.05 compared with control.  p < 0.05 compared with PM + OVA.
Figure 6
Figure 6
Inhibitory effects of PBM on the ferroptosis and autophagic signals in a PM2.5-exposed asthma exacerbation model. (A) Deposition of iron in lung tissue using Perls Prussian blue staining in lung tissues (n = 6). Scale bar represents 20 µm. (B) Malondialdehyde (MDA) concentration in lung tissue (n = 6). (C) Glutathione (GSH) concentration in lung tissue (n = 6). (D) Ca2+ levels in lung tissue (n = 5). (E) 4-Hydroxynonenal (4-HNE) levels in lung tissue (n = 6). (F) Ferroptosis markers in lung tissue (n = 3). (G) Autophagy markers in lung tissues. Bar graphs represent the quantification protein expression (n = 3). Data are shown as the mean ± SEM. * p < 0.05 compared to control.  p < 0.05 compared to PM + OVA.
Figure 7
Figure 7
Schematic representation of the anti-asthmatic effects of photobiomodulation (PBM) therapy on PM2.5 exposure-induced allergic asthma in a mouse model. PBM therapy reduces AHR, inflammation, Th2 cytokines, goblet cell hyperplasia, and subepithelial fibrosis in a PM2.5-exacerbated allergic asthma mouse model. PBM therapy also decreases oxidative and ER stress, apoptosis, and ferroptosis, while modulating autophagy in asthmatic mice exposed to PM2.5. These findings suggest PBM’s potential as an adjunct to asthma treatment in patients exposed to environmental pollutants. Abbreviations: DEX, dexamethasone; OVA, ovalbumin; PBM, photobiomodulation; PM, particulate matter, PM2.5, PM with a diameter < 2.5 μm.

References

    1. Brusselle G.G., Koppelman G.H. Biologic therapies for severe asthma. N. Engl. J. Med. 2022;386:157–171. doi: 10.1056/NEJMra2032506. - DOI - PubMed
    1. Delfino R.J., Wu J., Tjoa T., Gullesserian S.K., Nickerson B., Gillen D.L. Asthma morbidity and ambient air pollution: Effect modification by residential traffic-related air pollution. Epidemiology. 2014;25:48–57. doi: 10.1097/EDE.0000000000000016. - DOI - PubMed
    1. Garcia A., Santa-Helena E., De Falco A., de Paula Ribeiro J., Gioda A., Gioda C.R. Toxicological effects of fine particulate matter (PM2. 5): Health risks and associated systemic injuries—Systematic review. Water Air Soil Pollut. 2023;234:346. doi: 10.1007/s11270-023-06278-9. - DOI - PMC - PubMed
    1. Hazlehurst M.F., Carroll K.N., Loftus C.T., Szpiro A.A., Moore P.E., Kaufman J.D., Kirwa K., LeWinn K.Z., Bush N.R., Sathyanarayana S. Maternal exposure to PM2. 5 during pregnancy and asthma risk in early childhood: Consideration of phases of fetal lung development. Environ. Epidemiol. 2021;5:e130. doi: 10.1097/EE9.0000000000000130. - DOI - PMC - PubMed
    1. Lommatzsch M. Immune modulation in asthma: Current concepts and future strategies. Respiration. 2020;99:566–576. doi: 10.1159/000506651. - DOI - PMC - PubMed

LinkOut - more resources