. 2024 Aug 19;13(8):1007.
doi: 10.3390/antiox13081007.

Lysophosphatidylcholine Impairs the Mitochondria Homeostasis Leading to Trophoblast Dysfunction in Gestational Diabetes Mellitus

Affiliations

Lysophosphatidylcholine Impairs the Mitochondria Homeostasis Leading to Trophoblast Dysfunction in Gestational Diabetes Mellitus

Shao-Chi Hung et al. Antioxidants (Basel). .

Abstract

Gestational diabetes mellitus (GDM) is a common pregnancy disorder associated with an increased risk of pre-eclampsia and macrosomia. Recent research has shown that the buildup of excess lipids within the placental trophoblast impairs mitochondrial function. However, the exact lipids that impact the placental trophoblast and the underlying mechanism remain unclear. GDM cases and healthy controls were recruited at Kaohsiung Medical University Hospital. The placenta and cord blood were taken during birth. Confocal and electron microscopy were utilized to examine the morphology of the placenta and mitochondria. We determined the lipid composition using liquid chromatography-mass spectrometry in data-independent analysis mode (LC/MSE). In vitro studies were carried out on choriocarcinoma cells (JEG3) to investigate the mechanism of trophoblast mitochondrial dysfunction. Results showed that the GDM placenta was distinguished by increased syncytial knots, chorangiosis, lectin-like oxidized low-density lipoprotein (LDL) receptor-1 (LOX-1) overexpression, and mitochondrial dysfunction. Lysophosphatidylcholine (LPC) 16:0 was significantly elevated in the cord blood LDL of GDM patients. In vitro, we demonstrated that LPC dose-dependently disrupts mitochondrial function by increasing reactive oxygen species (ROS) levels and HIF-1α signaling. In conclusion, highly elevated LPC in cord blood plays a pivotal role in GDM, contributing to trophoblast impairment and pregnancy complications.

Keywords: gestational diabetes mellitus (GDM); hypoxia-induced factor-1 alpha (HIF-1α); lysophosphatidylcholine (LPC); mitochondrial dysfunction; placenta; trophoblast.


Conflict of interest statement

The authors declare no conflicts of interest.

Figures
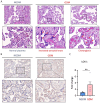
Figure 1
Figure 1
The GDM placenta had aberrant structures and LOX-1 overexpression. (A) H&E staining of the placenta in GDM revealed more syncytial knots and chorangiosis than in healthy controls (n = 6, six placentas from six different donors for each group). Scale bar represents 50 µm. The red arrow represents placental lesion. (B) Representative immunohistochemical staining for LOX-1 expression in healthy and GDM patients (n = 6). Scale bar: 50 µm. (C) LOX-1 expression increased 3.4-fold in GDM compared to healthy controls (n = 6). ** p < 0.01. Abbreviations: GDM: gestational diabetes mellitus; NGDM: non-gestational diabetes healthy controls; LOX-1: lectin-like oxidized LDL receptor-1.
Figure 2
Figure 2
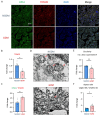
The trophoblast of the GDM placenta showed lower mitochondrial mass and enhanced mitochondrial fusion. (A) Confocal microscopy of the NGDM (upper panel) and GDM (lower panel) placenta. OPA1 controls mitochondrial fusion (green color), TOM20 depicts mitochondrial content (red color), and DAPI stains the background nuclei (blue color) (n = 6). Scale bar: 100 µm. (B) The fold change of TOM20 and (C) OPA1/TOM20 ratio was assessed according to the relative fluorescence signal intensity (n = 6). Data were quantified by ImageJ software version 1.54i. (D) Transmission electron microscopy (TEM) was used to examine mitochondrial structure and morphology in NGDM (upper panel) and GDM (lower panel) placenta. Scale bar in the representative Figure: 5 µm. The red arrow represents the location of mitochondria. (E) The fold change of circularity (4π × area/(perimeter))2 and (F) aspect ratio (largest (R)/smallest (r)) of mitochondria in NGDM and GDM placenta (n = 10 fields under transmission electron microscopy). * p < 0.05, ** p < 0.01. Abbreviations: GDM: gestational diabetes mellitus; NGDM: non-gestational diabetes healthy controls; OPA1: optic atrophy 1; TOM20: translocase of outer mitochondrial membrane 20; DAPI: 4′,6-diamidino-2-phenylindole; TEM: transmission electron microscopy.
Figure 3
Figure 3
Lysophosphatidylcholine increased in GDM cord blood. (A) Representative lipid patterns in the cord blood of NGDM (upper panel) and GDM (lower panel) as determined by UPLC/MSE (n = 6 for the NGDM group, n = 6 for the GDM group; lipid extracts were from the cord blood of 12 Taiwanese women). Total lipids were separated using a CSH C18 column (Waters Corporation; Milford, MA, USA). Furthermore, the mass-to-charge signals were detected in the positive mode using XEVO G2 QTOF mass spectrometry (Waters Corporation; Milford, MA, USA). (B) We chose m/z with (1) abundance > 5000, (2) p < 0.0001, (3) fold change > 5 as the criteria and selected the top 25 differentiative markers for GDM lipids. (C) By principal component analysis (PCA), PC1 and PC2 were determined. Furthermore, the most critical components in PC1 and PC2 were calculated, respectively. (D) According to the retention time and fragment daughter ions of lipid standards, we identified LPC signals, and (E) calculated the fold change of GDM in comparison to NGDM. ** p < 0.01. Abbreviations: GDM: gestational diabetes mellitus; NGDM: non-gestational diabetes healthy controls; LPC: lysophosphatidylcholine; UPLC: ultra-pure liquid chromatography; MSE: mass spectrometry in data-independent analysis mode; CSH: charged surface hybrid.
Figure 4
Figure 4
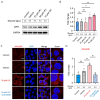
LPC-induced LOX-1 overexpression and excessive mitochondrial ROS production. (A) Human placental JEG3 cells were challenged with 25, 50, or 75 μM LPC. The glucose levels were 1.0 g/L for non-treat control and 4.5 g/L for vehicle control and other treatments. LOX-1 expression was evaluated using Western blot testing. (B) The fold changes of LOX-1 expression were calculated by chemiluminescence signal intensity (n = 5). Data were quantified using ImageJ software, and the differences were measured using one-way ANOVA. (C) 50 μM LPC was treated to human placental JEG3 cells with or without 2.5 μM CAY10585, the HIF-1α inhibitor, for 24 h. The mitochondria ROS production was detected by staining with MitoSOXTM (red color). The nuclei were stained with DAPI (blue). Signals were visualized by fluorescence microscopy. Scale bar, 20 µm. (D) The fold changes of the fluorescence signal were measured according to fluorescence signal intensity (n = 6). Data were quantified by ImageJ software. * p < 0.05, ** p < 0.01, data were compared to control; ## p < 0.01, data were compared to 50 μM LPC treatment. Abbreviations: LPC: Lysophosphatidylcholine; LOX-1: lectin-like oxidized low-density lipoprotein (LDL) receptor-1; HIF-1α: Hypoxia-inducible factor 1-alpha; ROS: reactive oxygen species; MitoSOX: mitochondrial superoxide indicators for live cell imaging; DAPI: 4′,6-diamidino-2-phenylindole, a fluorescent stain that binds strongly to adenine–thymine-rich regions in DNA; ANOVA: analysis of variance, ns: no significant differences.
Figure 5
Figure 5
Lysophosphatidylcholine disrupts mitochondrial homeostasis via the HIF-1α pathway. (A) Human placental JEG3 cells were treated with 25, 50, or 75 μM LPC to assess its effect on HIF-1α signaling. Besides, JEG3 cells were cotreated with 75 μM LPC and 2.5 μM CAY10585, the HIF-1α inhibitor, for 24 h. The glucose levels were 1.0 g/L for non-treat control and 4.5 g/L for vehicle control and other treatments. (B) Data were quantified by ImageJ software. The fold changes of signal intensity were tested (n = 6). (C) The mitochondrial mass of JEG3 cells was determined using the signal intensity of MitoTrackerTM Green FM labeling. Scale bar, 20 µm. (D) Fluorescence signal intensity was measured (n = 6). (E) Finally, the expression of OPA1 was tested for mitochondrial fusion. (F) Data were quantified by ImageJ software (n = 5). ** p < 0.01, data were compared to vehicle control; ## p < 0.01, data were compared to 75 or 50 μM LPC treatment (# for inhibitor effect). Abbreviations: LPC: Lysophosphatidylcholine; HIF-1α: Hypoxia-inducible factor 1-alpha; MitoTrackerTM Green FM: enable mitochondria visualization with fluorescent imaging; DAPI: 4′,6-diamidino-2-phenylindole, a fluorescent stain that binds strongly to adenine–thymine-rich regions in DNA; ns: no significant differences.
Figure 6
Figure 6
Lysophosphatidylcholine impaired the mitochondrial electron transport chain function. (A) Human placental JEG3 cells were treated with 50 μM LPC to evaluate the mitochondrial function. Besides, JEG3 cells were cotreated with 50 μM LPC and 2.5 μM CAY10585, the HIF-1α inhibitor, for 24 h (n = 6). The glucose levels were 1.0 g/L for non-treat control and 4.5 g/L for vehicle control and other treatments. Scale bar, 20 µm. (B) Fluorescence signal intensity was measured. Data were quantified by ImageJ software. The fold changes of signal intensity were tested (n = 5). * p < 0.05, data were compared to vehicle control; # p < 0.05, data were compared to 50 μM LPC treatment. Abbreviations: LPC: Lysophosphatidylcholine; HIF-1α: Hypoxia-inducible factor 1-alpha; MitoTrackerTM Red FM: fluorescent signal intensity was dependent on mitochondrial potential; DAPI: 4′,6-diamidino-2-phenylindole, a fluorescent stain that binds strongly to adenine–thymine-rich regions in DNA; ns: no significant differences.
Figure 7
Figure 7
A schematic diagram showing the mechanism by which LPC triggers oxidative stress, mitochondria fusion, and dysfunction, which in turn causes trophoblast dysregulation and is positively connected with a greater incidence of chorangiosis and syncytial knots in GDM. The red arrow indicates the increasing levels of LPC, ROS, HIF-1α, and OPA-1. Figures created with BioRender.com. Abbreviations: GDM: gestational diabetes mellitus; LPC: lysophosphatidylcholine; oxLDL: oxidized low-density lipoprotein; LOX-1: lectin-like oxidized low-density lipoprotein (LDL) receptor-1; HIF-1α: hypoxia-inducible factor 1-alpha; ROS: reactive oxygen species; OPA1: optic atrophy 1.

References

    1. Quintanilla Rodriguez B.S., Mahdy H. StatPearls. StatPearls Publishing; Treasure Island, FL, USA: 2022. Gestational Diabetes. - PubMed
    1. International Association of Diabetes and Pregnancy Study Groups Consensus Panel. Metzger B.E., Gabbe S.G., Persson B., Buchanan T.A., Catalano P.A., Damm P., Dyer A.R., Leiva A., Hod M., et al. International association of diabetes and pregnancy study groups recommendations on the diagnosis and classification of hyperglycemia in pregnancy. Diabetes Care. 2010;33:676–682. doi: 10.2337/dc09-1848. - DOI - PMC - PubMed
    1. Moon J.H., Jang H.C. Gestational Diabetes Mellitus: Diagnostic Approaches and Maternal-Offspring Complications. Diabetes Metab. J. 2022;46:3–14. doi: 10.4093/dmj.2021.0335. - DOI - PMC - PubMed
    1. HAPO Study Cooperative Research Group. Metzger B.E., Lowe L.P., Dyer A.R., Trimble E.R., Chaovarindr U., Coustan D.R., Hadden D.R., McCance D.R., Hod M., et al. Hyperglycemia and adverse pregnancy outcomes. N. Engl. J. Med. 2008;358:1991–2002. - PubMed
    1. Fadl H.E., Ostlund I.K., Magnuson A.F., Hanson U.S. Maternal and neonatal outcomes and time trends of gestational diabetes mellitus in Sweden from 1991 to 2003. Diabet. Med. 2010;27:436–441. doi: 10.1111/j.1464-5491.2010.02978.x. - DOI - PubMed

LinkOut - more resources