. 2024 Jul 30;14(8):924.
doi: 10.3390/biom14080924.

Integrated Multi-Omics Analysis of Cerebrospinal Fluid in Postoperative Delirium

Affiliations

Integrated Multi-Omics Analysis of Cerebrospinal Fluid in Postoperative Delirium

Bridget A Tripp et al. Biomolecules. .

Abstract

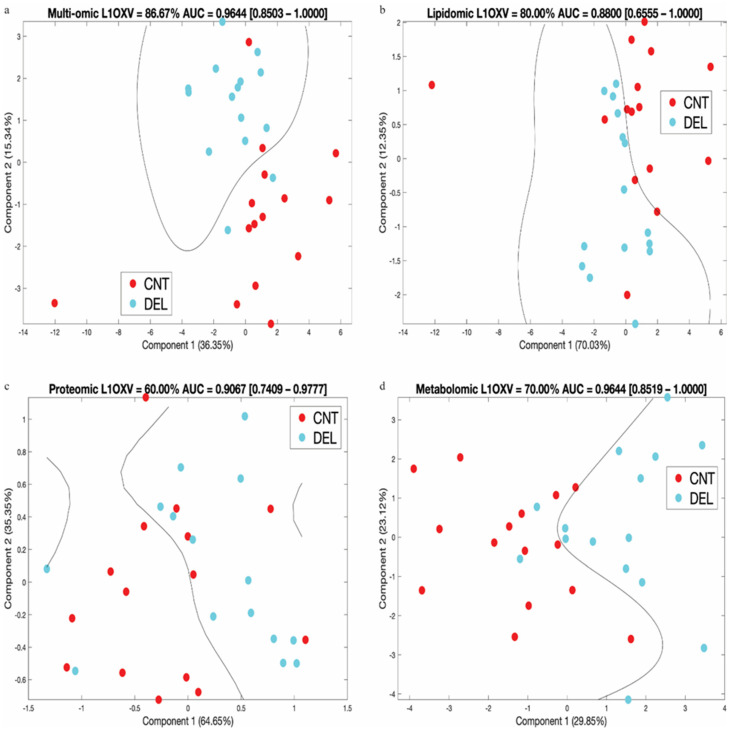
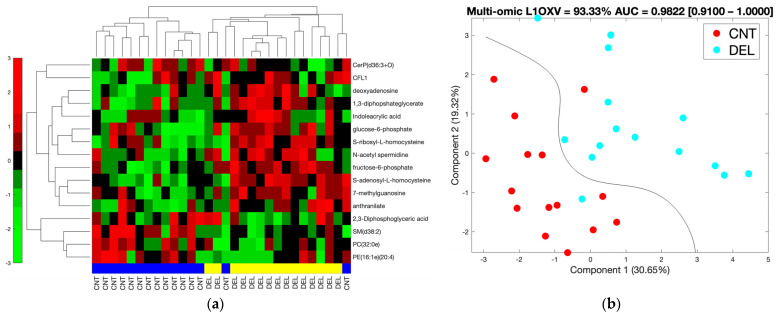
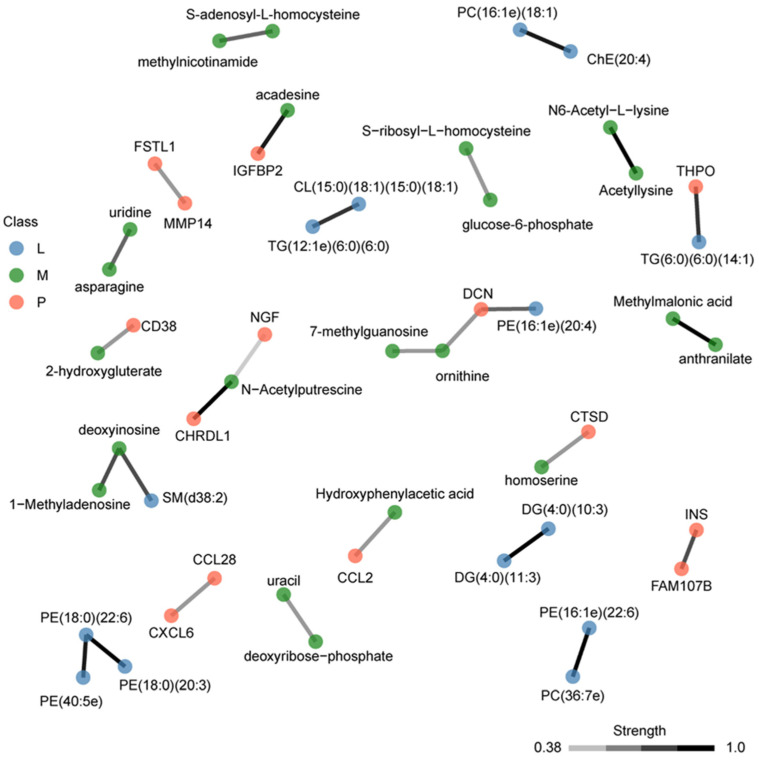
Preoperative risk biomarkers for delirium may aid in identifying high-risk patients and developing intervention therapies, which would minimize the health and economic burden of postoperative delirium. Previous studies have typically used single omics approaches to identify such biomarkers. Preoperative cerebrospinal fluid (CSF) from the Healthier Postoperative Recovery study of adults ≥ 63 years old undergoing elective major orthopedic surgery was used in a matched pair delirium case-no delirium control design. We performed metabolomics and lipidomics, which were combined with our previously reported proteomics results on the same samples. Differential expression, clustering, classification, and systems biology analyses were applied to individual and combined omics datasets. Probabilistic graph models were used to identify an integrated multi-omics interaction network, which included clusters of heterogeneous omics interactions among lipids, metabolites, and proteins. The combined multi-omics signature of 25 molecules attained an AUC of 0.96 [95% CI: 0.85-1.00], showing improvement over individual omics-based classification. We conclude that multi-omics integration of preoperative CSF identifies potential risk markers for delirium and generates new insights into the complex pathways associated with delirium. With future validation, this hypotheses-generating study may serve to build robust biomarkers for delirium and improve our understanding of its pathophysiology.

Keywords: delirium; lipidomics; metabolomics; multi-omics; proteomics; risk factors.


Conflict of interest statement

The funders had no role in the design or conduct of the study; collection, management, analysis, or interpretation of the data; preparation, review, or approval of the manuscript; or decision to submit the manuscript for publication. The authors report no biomedical financial interests or potential conflicts of interest. Zhongcong Xie provided consulting service to Baxter, NanoMosaic, Shanghai 4th, 9th and 10th hospitals, Shanghai Mental Health Center of Shanghai Jiao Tong University School of Medicine, and <<Anesthesiology and Perioperative Science>> in last 36 months.

Figures

Figure 1
Figure 1
Generalized Autophagy Pathway. Red slashes denote the two positions within the pathway where the multi-omics results support dysregulation within the autophagy pathway. Four of the five phosphatidylethanolamines (PEs) recorded in our experiment were down in the delirium group. PE (black ovals) is critical to the elongation process in autophagy. Autophagy is a catabolic pathway that degrades cytosolic contents and is important for balancing energy stores in response to nutrient deprivation. It starts with the formation of the phagophore, which goes through an elongation process to form an autophagosome. A cytosolic microtubule-associated protein 1A/1B-light chain 3 (LC3) (denoted in grey) is conjugated to PE to form LC3-PE. Then, the mature autophagosome fuses with the lysosome. After fusion, lysosomal proteases, like cathepsin D (CTSD), degrade the contents of the autophagosome [59]. Our proteomics results showed a decline in CTSD in the delirium group, inferring a potential build-up of autophagosomes and, ultimately, the dysregulation of the autophagy pathway.
Figure 2
Figure 2
Pathway analysis of metabolites with significant differences in signal between the delirium and control groups. A red box indicates an input metabolite, and all are upregulated in delirium. The two most significantly enriched pathways are (a) arginine biosynthesis (FDR = 0.0011) and (b) pentose phosphate pathway (FDR = 0.00011). Supplementary Figure S4 contains the original pathway figures generated through MetaboAnalyst, including KEGG compound numbers.
Figure 3
Figure 3
Hierarchical clustering for lipid, metabolite, protein, and combined omics signatures. The blue and yellow horizontal bars denote control (CNT) and delirium (DEL) samples, respectively. Red and green represent up- and downregulation in the delirium group, respectively. The vertical side bar represents the range of row-normalized (zero-mean, unit-variance) signal values and corresponding color codes. (a) Combined multi-omics signature (25 molecules), (b) Lipidomic signature (8 lipids), (c) Proteomic signature (2 proteins), (d) Metabolomic signature (15 metabolites).
Figure 4
Figure 4
For each signature, leave-one-out cross-validation (L1OXV) accuracy and area under the curve (AUC) of the receiver operating characteristic (ROC) curve are noted. In brackets, we note the 95% confidence interval for the AUC values. (a) Combined multi-omics signature (25 molecules), (b) Lipidomic signature (8 lipids), (c) Proteomic signature (2 proteins), (d) Metabolomic signature (15 metabolites). Percent values along the axes represent the percent of variation in data explained by the respective principal component.
Figure 5
Figure 5
(a) Hierarchical clustering and (b) PCA+SVM plot using the refined multi-omics signature with 16 molecules (11 metabolites, 5 lipids, and 1 protein). The molecules that ended up in the majority of leave-one-out-cross-validation models in regularized logistic regression with elastic net analysis constitute the refined list of 16. The input list for the regression analysis was the 25 molecules (15 metabolites, 8 lipids, 2 proteins) that were significantly associated with delirium (p < 0.05) and showed high fold change (|tFC| > 1/5).
Figure 6
Figure 6
Multi-omics integration using OBaNK. A total of 109 molecules were used as input (lipids = 26, metabolites = 51, proteins = 32) (Table 2, Supplemental Table S4). Nodes are colored to represent the molecule type (blue = lipids; green = metabolites; orange = proteins). Edges represent the significant interactions (strength) between molecules. Edges are linearly color-coded to represent the interaction confidence [0.38–1.0], with black representing the highest confidence.

References

    1. Inouye S.K., Westendorp R.G., Saczynski J.S. Delirium in elderly people. Lancet. 2014;383:911–922. doi: 10.1016/S0140-6736(13)60688-1. - DOI - PMC - PubMed
    1. Marcantonio E.R. Postoperative delirium: A 76-year-old woman with delirium following surgery. JAMA. 2012;308:73–81. doi: 10.1001/jama.2012.6857. - DOI - PMC - PubMed
    1. Gou R.Y., Hshieh T.T., Marcantonio E.R., Cooper Z., Jones R.N., Travison T.G., Fong T.G., Abdeen A., Lange J., Earp B., et al. One-year Medicare costs associated with delirium in older patients undergoing major elective surgery. JAMA Surg. 2021;156:430–442. doi: 10.1001/jamasurg.2020.7260. - DOI - PMC - PubMed
    1. Maldonado J.R. Delirium pathophysiology: An updated hypothesis of the etiology of acute brain failure. Int. J. Geriatr. Psychiatry. 2018;33:1428–1457. doi: 10.1002/gps.4823. - DOI - PubMed
    1. Maldonado J.R. Neuropathogenesis of delirium: Review of current etiologic theories and common pathways. Am. J. Geriatr. Psychiatry. 2013;21:1190–1222. doi: 10.1016/j.jagp.2013.09.005. - DOI - PubMed

LinkOut - more resources