. 2024 Aug 7;16(16):2782.
doi: 10.3390/cancers16162782.

Therapeutic Senolysis of Axitinib-Induced Senescent Human Lung Cancer Cells

Affiliations

Therapeutic Senolysis of Axitinib-Induced Senescent Human Lung Cancer Cells

Hitoshi Kotani et al. Cancers (Basel). .

Abstract

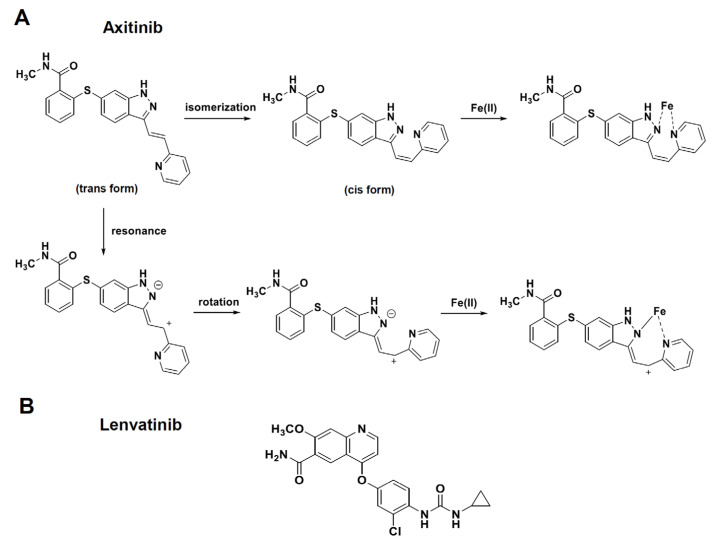
Background: Tyrosine kinase inhibitors (TKIs) inhibit receptor-mediated signals in cells. Axitinib is a TKI with high specificity for vascular endothelial growth factor receptors (VEGFRs).

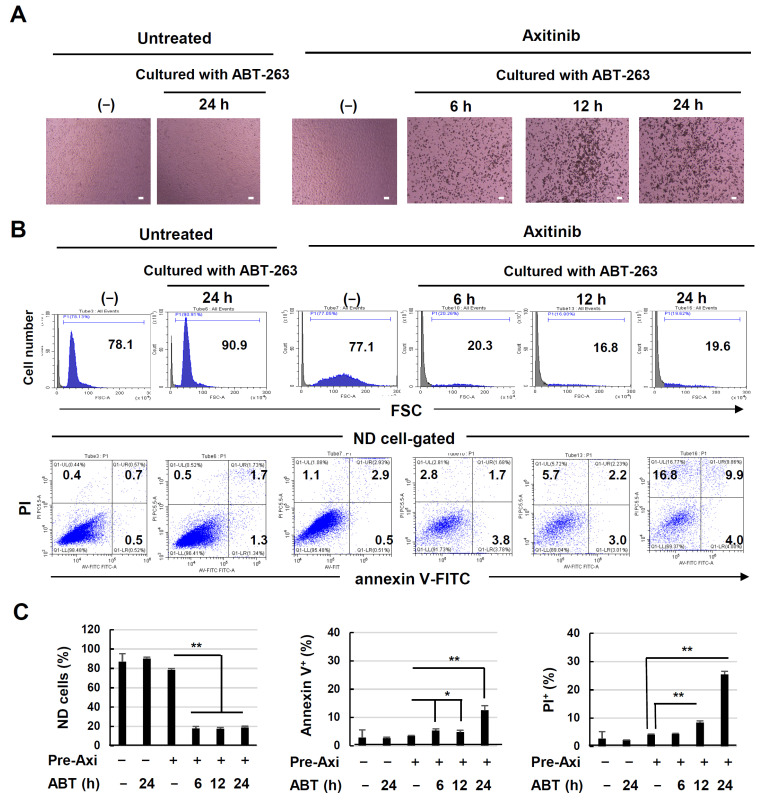
Aim: We determined whether axitinib could induce senescence in human cancer cells and be lysed by the senolytic drug ABT-263.

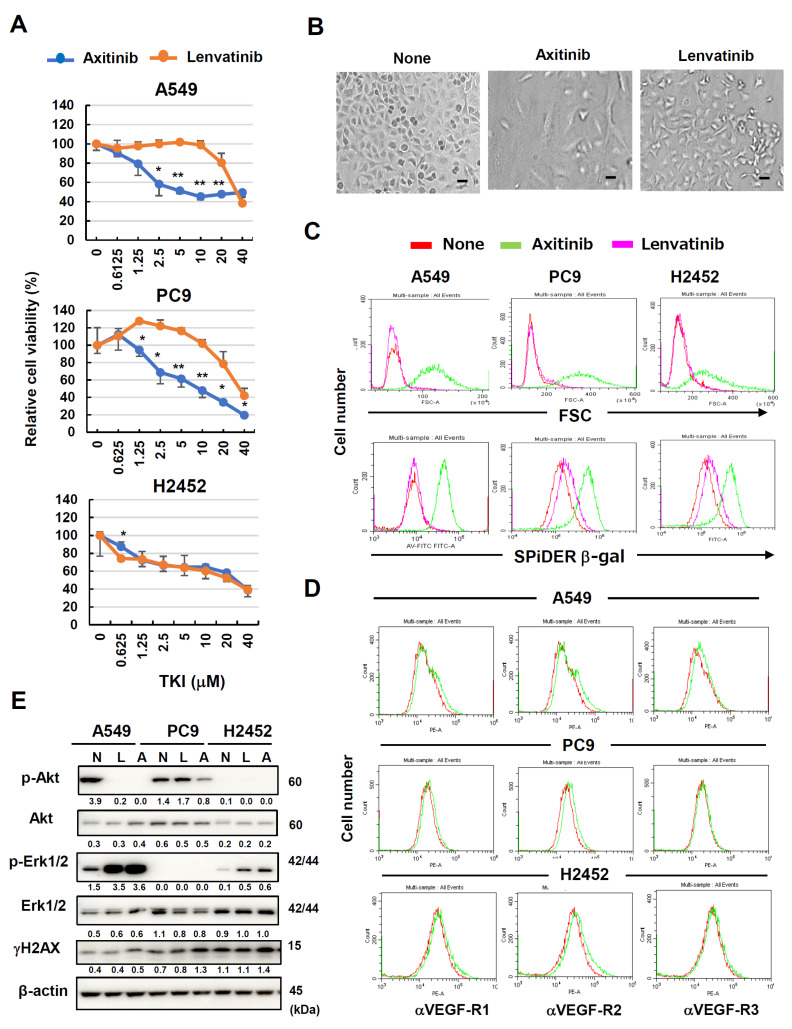
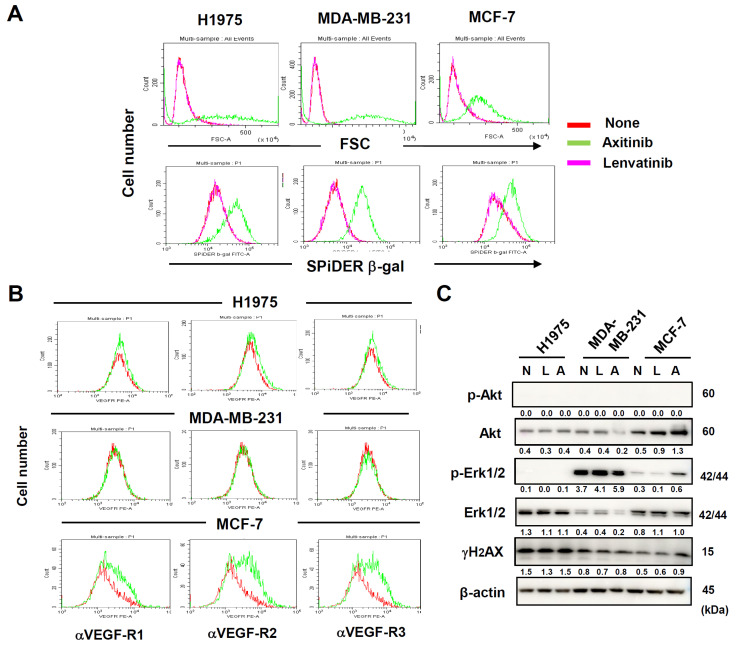
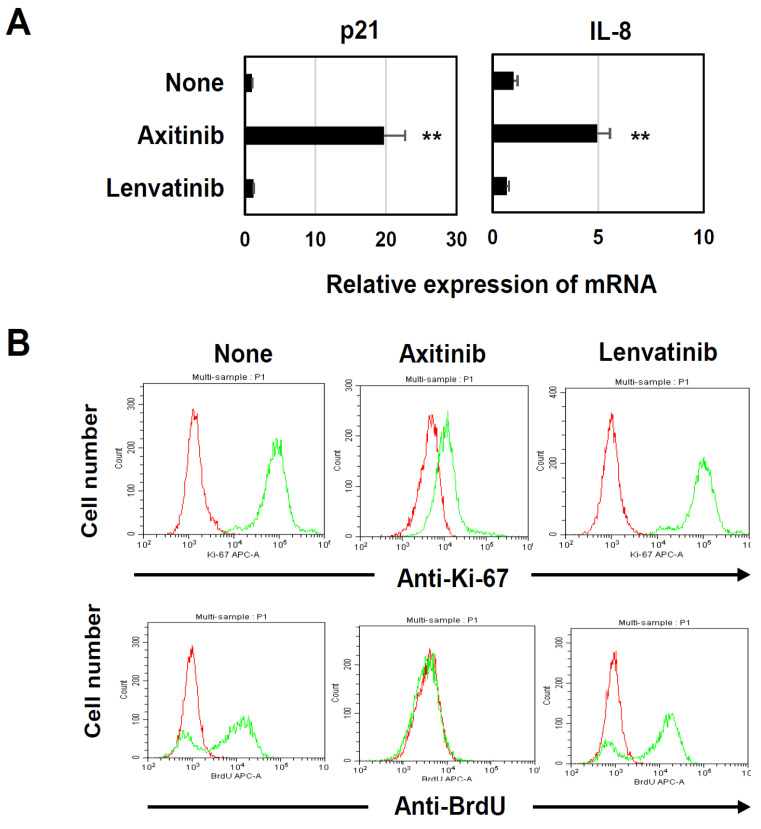
Methods: Human lung and breast adenocarcinoma cell lines were used. These cells were cultured with axitinib or a multi-target TKI lenvatinib. The expression of β-galactosidase, VEGFRs, Ki-67, reactive oxygen species (ROS) of cancer cells, and their BrdU uptake were evaluated by flow cytometry. The mRNA expression of p21 and IL-8 was examined by quantitative PCR. The effects of TKIs on phosphorylation of Akt and Erk1/2, as downstream molecules of VEGFR signaling, were examined by immunoblot. The in vivo anti-cancer effect was examined using a xenograft mice model.

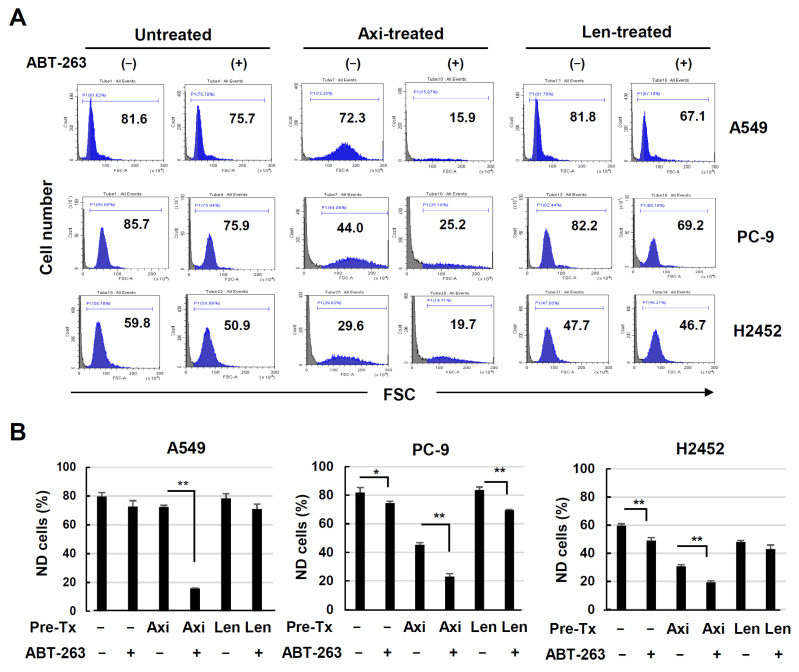
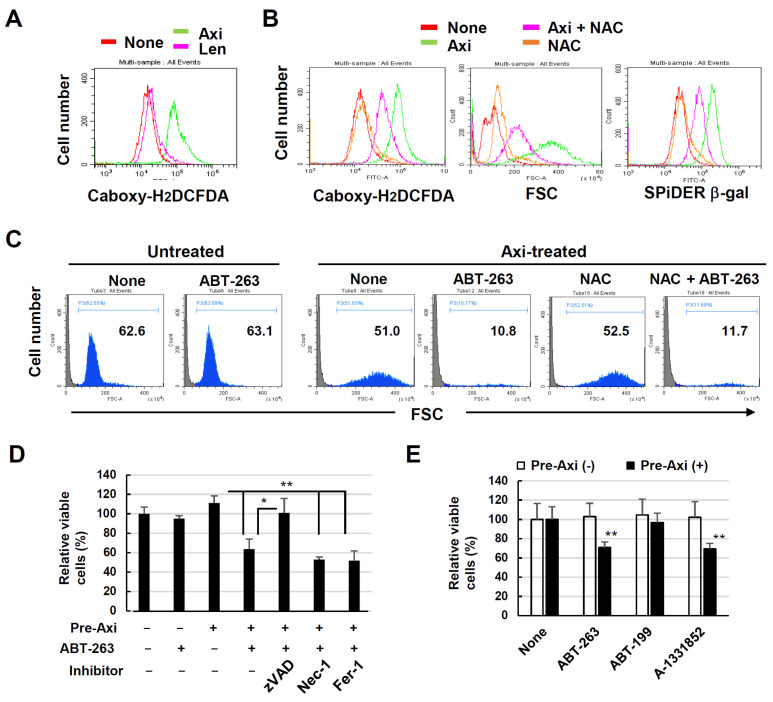
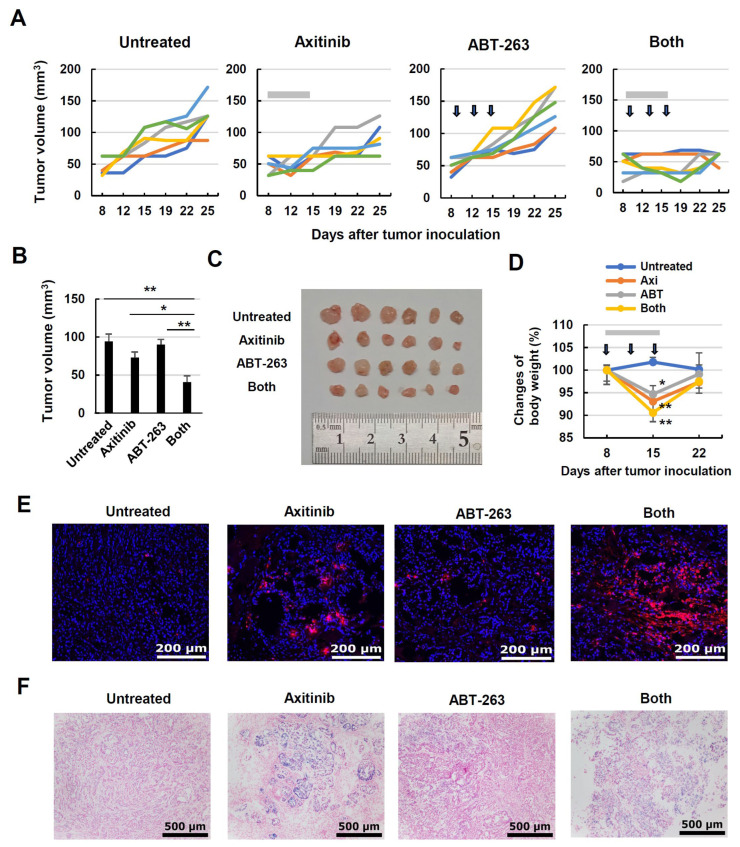
Results: Axitinib, but not lenvatinib, induced cellular senescence (increased cell size and enhanced expression of β-galactosidase) in all adenocarcinoma cell lines. Axitinib-induced senescence was unrelated to the expression of VEGFRs on cancer cells. ROS were involved in axitinib-induced senescence. Axitinib-induced senescent lung adenocarcinoma A549 cells were drastically lysed by ABT-263. In A549-xenografted mice, combination therapy with axitinib and ABT-263 significantly suppressed tumor growth with the induction of apoptotic cancer cells.

Keywords: axitinib; lung cancer; senescence; senolysis.


Conflict of interest statement

The authors declare no conflict of interest.

Figures

Figure 1
Figure 1
Effects of axitinib and lenvatinib on three human lung cancer cell lines. (A) Three lung cancer cell lines were cultured in the presence of indicated doses of two TKIs for 3 days. Relative cell viability was determined using a Cell Counting Kit-8 (CCK8) assay. Data are means ± SD of three replicates. * p < 0.05, ** p < 0.01. (B) Photographs of untreated A549 cells and those treated with axitinib or lenvatinib (2.5 μM) for 3 days. Scale bar, 50 μm. (C) Three lung cancer cell lines were cultured in the presence of two TKIs (2.5 μM) for 3 days. Thereafter, the cells were stained with SPiDER β-galactosidase (β-gal). Forward scatter (FSC) and SPiDER β-gal expression levels were examined. (D) Expression levels of VEGF-R1, -R2, and -R3 on three cancer cell lines were examined after staining with the indicated PE-conjugated antibodies (green line). Isotype-matched PE-conjugated antibodies were used as a control (red line). (E) Three lung cancer cell lines were cultured in the presence of two TKIs (2.5 μM). On day 3, the protein expression was examined by immunoblotting. β-Actin was used as a control. The numbers indicate the relative expression compared to β-actin. In the case with p-Akt and p-Erk1/2, the relative expression compared to relevant total protein is shown. The original Western blot figures is shown in Supplementary Materials Figure S1. N, none; L, lenvatinib; A, axitinib.
Figure 2
Figure 2
Axitinib-induced senescence in three other human adenocarcinoma cell lines. (A) Three cancer cell lines were cultured in the presence of two TKIs (2.5 μM) for 3 days and were stained with SPiDER β-galactosidase (β-gal). Forward scatter (FSC) and SPiDER β-gal expression levels are shown. (B) Expression levels of VEGFRs on three cancer cell lines were examined after staining with the indicated PE-conjugated antibodies (green line). Isotype-matched PE-conjugated antibody was used as a control (red line). (C) Three cancer cell lines were cultured in the presence of two TKIs (2.5 μM). On day 3, the protein expression was examined by immunoblotting. β-Actin was used as a control. The numbers indicate the relative expression compared to β-actin. In the case with p-Akt and p-Erk1/2, the relative expression compared to relevant total protein is shown. The original Western blot figures is shown in Supplementary Materials Figure S1. N, none; L, lenvatinib; A, axitinib.
Figure 3
Figure 3
Induction of SASP and growth arrest in axitibin-treated A549 cells. (A) Three lung cancer cell lines were cultured with either axitinib or lenvatinib (2.5 μM) for 3 days. Expression levels of p21 and IL-8 mRNAs were determined in the harvested cells. Data are means ± SD of three samples. Means were compared using Student’s t-test (** p < 0.01 compared to the untreated control). (B) A549 cells were cultured with axitinib or lenvatinib (2.5 μM) for 3 days. Then, these cells were stained with APC-conjugated anti-Ki-67 antibody or APC-conjugated anti-BrdU antibody (green line) and analyzed by flow cytometry. The red line is an isotype-matched control antibody.
Figure 4
Figure 4
Senolysis of axitinib-induced senescent A549 cells by ABT-263. (A) A549 cells were treated with or without axitinib (2.5 μM) for 3 days. After harvesting, the cells were cultured with ABT-263 (1 μM) for the indicated times, and images were captured. Scale bar, 100 μm. (B) Flow cytometry was performed after staining with annexin V-FITC and propidium iodide (PI). Forward scatter (FSC) data are shown in the upper panel. The data gated on non-destroyed (ND) cells are shown in the lower panel. Numbers are percentages for each subset. (C) Percentages of ND cells, annexin V+ cells, and PI+ cells. Data are means ± SD of three replicates. Means were compared using Student’s t-test (* p < 0.05, ** p < 0.01).
Figure 5
Figure 5
Senolysis of axitinib- or lenvatinib-treated three lung cancer cell lines. (A) Three lung cancer cell lines were treated with or without axitinib or lenvatinib (2.5 μM) for 3 days. After harvesting, A549, PC9, and H2452 cells were cultured with ABT-263 (1 μM) for 12, 24, and 72 h, respectively. Then, flow cytometry was performed. Forward scatter (FSC) data are shown. Numbers are percentages for each subset. (B) Percentages of non-destroyed (ND) cells. Data are means ± SD of three replicates. Means were compared using Student’s t-test (* p < 0.05, ** p < 0.01). Ax, axitinib; Len, lenvatinib.
Figure 6
Figure 6
Senolysis of axitinib-induced senescent A549 cells by ABT-263 is dependent on caspase activation and Bcl-xL inhibition. (A) A549 cells were treated with or without axitinib (2.5 μM) for 3 days, at which point reactive oxygen species (ROS) expression was examined via flow cytometry after staining with carboxy-H2DCFDA. (B) A549 cells were treated with axitinib (2.5 μM) with or without NAC (2.5 mM) for 3 days. Then, the cells were stained with SPiDER β-gal. Forward scatter (FSC) and SPiDER β-gal expression data are shown. (C) A549 cells were treated with axitinib (2.5 μM) for 3 days. After harvesting, the cells were cultured with ABT-263 (1 μM) with or without NAC (2.5 mM) for 6 h. Then, flow cytometry was performed. FSC data are shown. (D) A549 cells were treated with or without axitinib (2.5 μM) for 3 days. After harvesting, the cells were cultured with ABT-263 (1 μM) for 12 h. Relative viability was determined via a CCK-8 assay. At 1 h before culture with ABT-263, either zVAD, Nec-1, or Fer-1 was added to the culture. (E) A549 cells were treated with or without axitinib (2.5 μM) for 3 days. After harvesting, the cells were cultured with ABT-263, ABT-199, or A-1331851 (1 μM) for 12 h. Relative viability of the cells was determined using a CCK-8 assay. Data are means ± SD of three replicates. Means were compared using Student’s t-test (* p < 0.05, ** p < 0.01). Nec-1, necrostatin-1; Fer-1, ferrostatin-1.
Figure 7
Figure 7
In vivo antitumor effect of axitinib and ABT-263 on the growth of A549 cells. (A) Female BALB nude mice were injected with A549 cells (2 × 10⁶) and Matrigel at a 1:1 volumetric ratio in 100 μL in the right flank. On day 8, the mice were divided into four groups. Axitinib (30 mg/kg; gray bars) was administered orally on days 8, 9, 11, 12, 14, and 15. On days 10, 13, and 16, cancer-bearing mice were intraperitoneally injected with ABT-263 (25 mg/kg; arrows). Tumor volume (mm3) and body weight were measured twice weekly. Lines represent the growth of individual mice (n = 6). (B) Tumor volumes on day 19. Data are means ± standard error on the mean (SEM) for six mice. Means were compared using analysis of variance (ANOVA) followed by the Tukey–Kramer test (* p < 0.05, ** p < 0.01). (C) Photographs (on day 25) of tumor tissues. (D) Body weight was measured twice weekly. Means were compared using ANOVA followed by the Tukey–Kramer test (* p < 0.05, ** p < 0.01). (E) Terminal deoxynucleotidyl transferase dUTP nick-end labeling (TUNEL) staining was performed using tumor tissues on day 17. Red dots indicate TUNEL+ cells. Scale bar, 200 μm. (F) Similarly, β-galactosidase staining was performed. Blue dots indicate β-galactosidase+ cells. Scale bar, 500 μm.
Figure 8
Figure 8
Speculated iron complex formations of axitinib and lenvatinib. (A) Axitinib makes two different iron complex formations via either isomerization or resonance and rotation. As a result, axitinib can act as a bidentate ligand to iron. (B) Lenvatinib acts as a monodentate ligand to iron.

References

    1. Zhang J., Yang P.L., Gray N.S. Targeting cancer with small molecule kinase inhibitors. Nat. Rev. Cancer. 2009;9:28–39. doi: 10.1038/nrc2559. - DOI - PubMed
    1. Xie R., Wu J., Shang B., Bi X., Jiang W., Cao C., Zhou A., Shi H., Shou J. Optimizing targeted drug selection in combination therapy for patients with advanced or metastatic renal cell carcinoma: A systematic review and network meta-analysis of safety. Cancer Med. 2023;12:7051–7064. doi: 10.1002/cam4.5504. - DOI - PMC - PubMed
    1. Sonpavde G., Hutson T.E., Rini B.I. Axitinib for renal cell carcinoma. Expert Opin. Investig. Drugs. 2008;17:741–748. - PubMed
    1. Patel S.A., Nilsson M.B., Le X., Cascone T., Jain R.K., Heymach J.V. Molecular Mechanisms and Future Implications of VEGF/VEGFR in Cancer Therapy. Clin. Cancer Res. 2023;29:30–39. doi: 10.1158/1078-0432.CCR-22-1366. - DOI - PMC - PubMed
    1. Motzer R.J., Robbins P.B., Powles T., Albiges L., Haanen J.B., Larkin J., Mu X.J., Ching K.A., Uemura M., Pal S.K., et al. Avelumab plus axitinib versus sunitinib in advanced renal cell carcinoma: Biomarker analysis of the phase 3 JAVELIN Renal 101 trial. Nat. Med. 2020;26:1733–1741. doi: 10.1038/s41591-020-1044-8. - DOI - PMC - PubMed

LinkOut - more resources