

Exploration of Response Mechanisms in the Gills of Pacific Oyster (Crassostrea gigas) to Cadmium Exposure through Integrative Metabolomic and Transcriptomic Analyses
- PMID: 39199852
- PMCID: PMC11350665
- DOI: 10.3390/ani14162318
Exploration of Response Mechanisms in the Gills of Pacific Oyster (Crassostrea gigas) to Cadmium Exposure through Integrative Metabolomic and Transcriptomic Analyses
Abstract
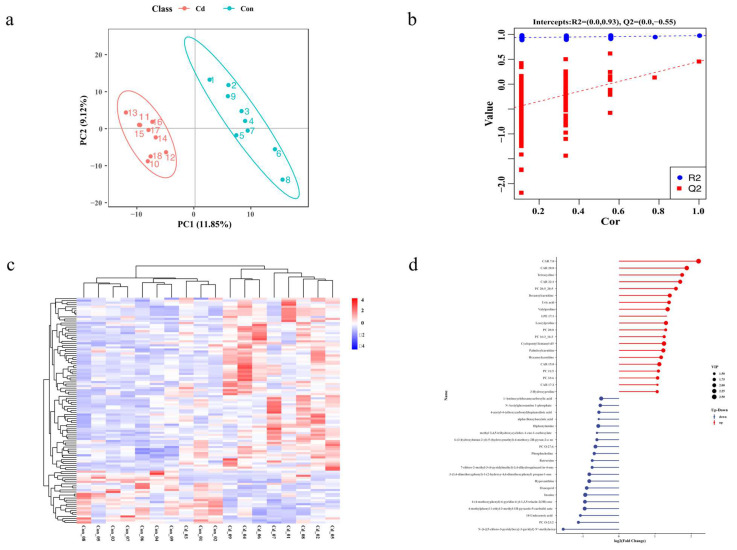
Marine mollusks, including oysters, are highly tolerant to high levels of cadmium (Cd), but the molecular mechanisms underlying their molecular response to acute Cd exposure remain unclear. In this study, the Pacific oyster Crassostrea gigas was used as a biological model, exposed to acute Cd stress for 96 h. Transcriptomic analyses of their gills were performed, and metabolomic analyses further validated these results. In our study, a total of 111 differentially expressed metabolites (DEMs) and 2108 differentially expressed genes (DEGs) were identified under acute Cd exposure. Further analyses revealed alterations in key genes and metabolic pathways associated with heavy metal stress response. Cd exposure triggered physiological and metabolic responses in oysters, including enhanced oxidative stress and disturbances in energy metabolism, and these changes revealed the biological response of oysters to acute Cd stress. Moreover, oysters could effectively enhance the tolerance and detoxification ability to acute Cd exposure through activating ABC transporters, enhancing glutathione metabolism and sulfur relay system in gill cells, and regulating energy metabolism. This study reveals the molecular mechanism of acute Cd stress in oysters and explores the molecular mechanism of high tolerance to Cd in oysters by using combined metabolomics and transcriptome analysis.
Keywords: Crassostrea gigas; cadmium stress; energy metabolism; metabolomic; transcriptomic.
Conflict of interest statement
Bin Li and Zhongping Wang was employed by the Yantai Kongtong Island Industrial Co., Ltd. The remaining authors declare that the research was conducted in the absence of any commercial or financial relationships that could be construed as a potential conflict of interest.
Figures


Similar articles
-
Physiological role of CYP17A1-like in cadmium detoxification and its transcriptional regulation in the Pacific oyster, Crassostrea gigas.Sci Total Environ. 2021 Nov 20;796:149039. doi: 10.1016/j.scitotenv.2021.149039. Epub 2021 Jul 14. Sci Total Environ. 2021. PMID: 34328900
-
Cadmium effects on DNA and protein metabolism in oyster (Crassostrea gigas) revealed by proteomic analyses.Sci Rep. 2017 Sep 15;7(1):11716. doi: 10.1038/s41598-017-11894-7. Sci Rep. 2017. PMID: 28916745 Free PMC article.
-
Proteomic and metabolomic responses of Pacific oyster Crassostrea gigas to elevated pCO2 exposure.J Proteomics. 2015 Jan 1;112:83-94. doi: 10.1016/j.jprot.2014.08.010. Epub 2014 Aug 28. J Proteomics. 2015. PMID: 25175059
-
Transcriptomic profile of oyster Crassostrea gigas hemocyte after short-term cadmium exposure and bacteria stimulation.Fish Shellfish Immunol. 2020 Mar;98:138-146. doi: 10.1016/j.fsi.2019.12.083. Epub 2019 Dec 28. Fish Shellfish Immunol. 2020. PMID: 31891811
-
Comparative transcriptomic analysis reveals a differential acid response mechanism between estuarine oyster (Crassostrea ariakensis) and Pacific oyster (Crassostrea gigas).Ecotoxicol Environ Saf. 2025 Jun 1;297:118210. doi: 10.1016/j.ecoenv.2025.118210. Epub 2025 Apr 23. Ecotoxicol Environ Saf. 2025. PMID: 40273612
Cited by
-
Oysters in transition: hermaphrodite oysters display unique DNA methylation patterns in gill tissue.BMC Genomics. 2025 Jun 6;26(1):567. doi: 10.1186/s12864-025-11736-1. BMC Genomics. 2025. PMID: 40481401 Free PMC article.
-
Transcriptomic and Metabolomic Analyses Reveal the Attenuating Role of Cordycepin and Cordyceps militaris Extract on Acute Liver Injury Induced by LPS in Piglets.Animals (Basel). 2024 Oct 5;14(19):2873. doi: 10.3390/ani14192873. Animals (Basel). 2024. PMID: 39409822 Free PMC article.
-
Exposure to metoprolol and propranolol mixtures on biochemical, immunohistochemical, and molecular alterations in the American oyster, Crassostrea virginica.Toxicol Rep. 2025 Mar 4;14:101979. doi: 10.1016/j.toxrep.2025.101979. eCollection 2025 Jun. Toxicol Rep. 2025. PMID: 40125299 Free PMC article.
-
Transcriptomic Analysis Reveals the Mechanisms of Cadmium Transport and Detoxification in Portuguese Oysters (Crassostrea angulata).Animals (Basel). 2025 Apr 3;15(7):1041. doi: 10.3390/ani15071041. Animals (Basel). 2025. PMID: 40218434 Free PMC article.
References
-
- Munksgaard N.C., Burchert S., Kaestli M., Nowland S.J., O’Connor W., Gibb K.S. Cadmium uptake and zinc-cadmium antagonism in Australian tropical rock oysters: Potential solutions for oyster aquaculture enterprises. Mar. Pollut. Bull. 2017;123:47–56. doi: 10.1016/j.marpolbul.2017.09.031. - DOI - PubMed
LinkOut - more resources
Full Text Sources
