. 2024 Jul 31;12(8):1697.
doi: 10.3390/biomedicines12081697.

A Highly Standardized Pre-Clinical Porcine Wound Healing Model Powered by Semi-Automated Histological Analysis

Affiliations

A Highly Standardized Pre-Clinical Porcine Wound Healing Model Powered by Semi-Automated Histological Analysis

Ives Bernardelli de Mattos et al. Biomedicines. .

Abstract

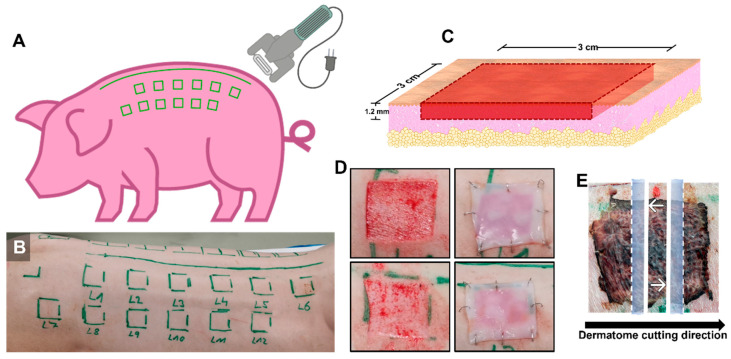
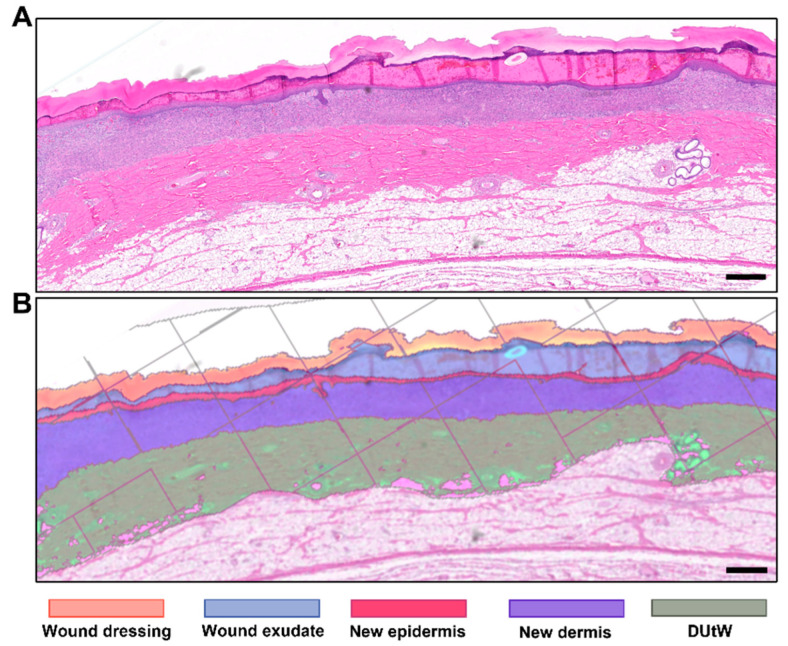
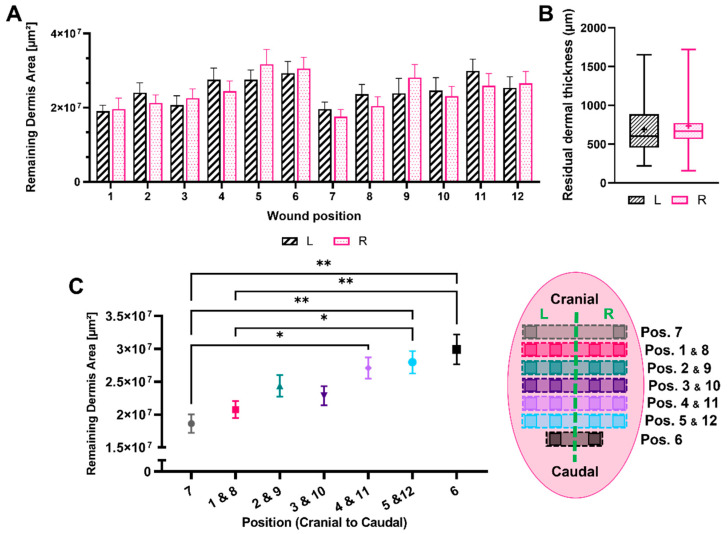
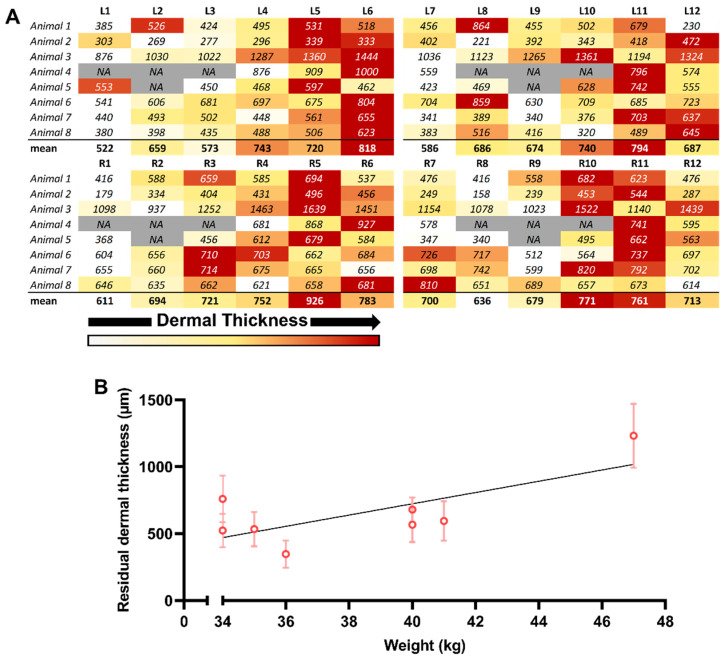
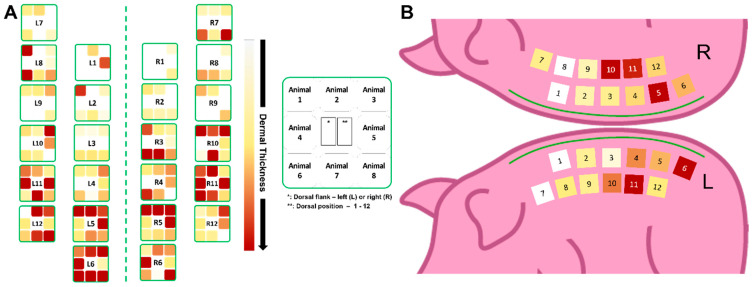
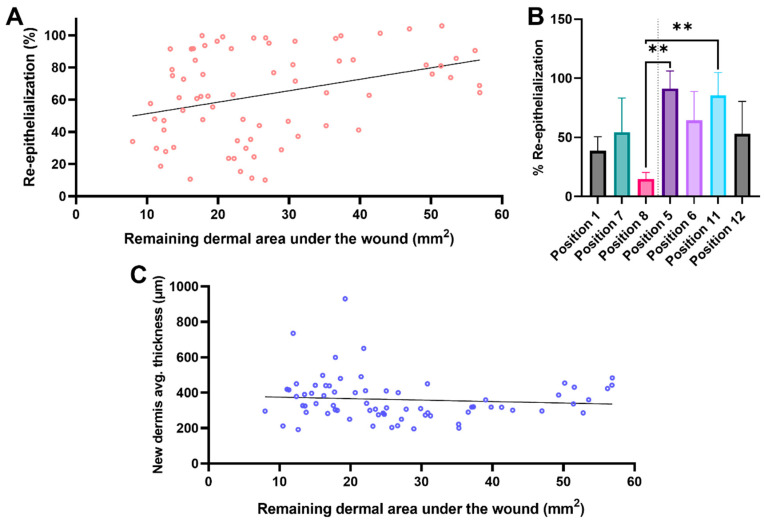
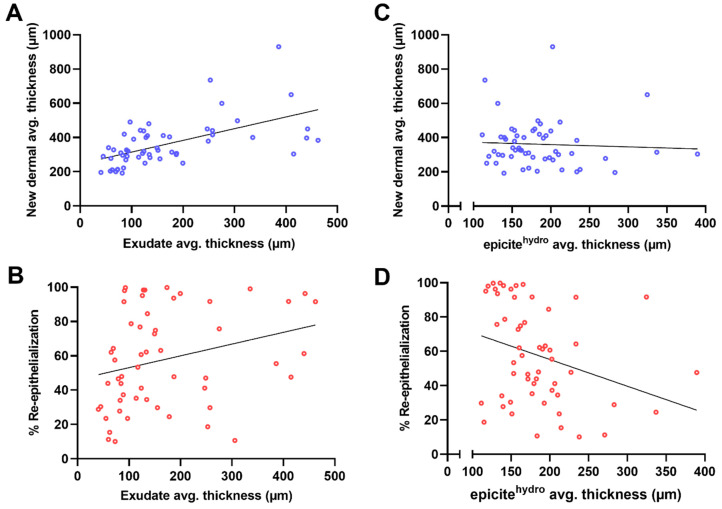
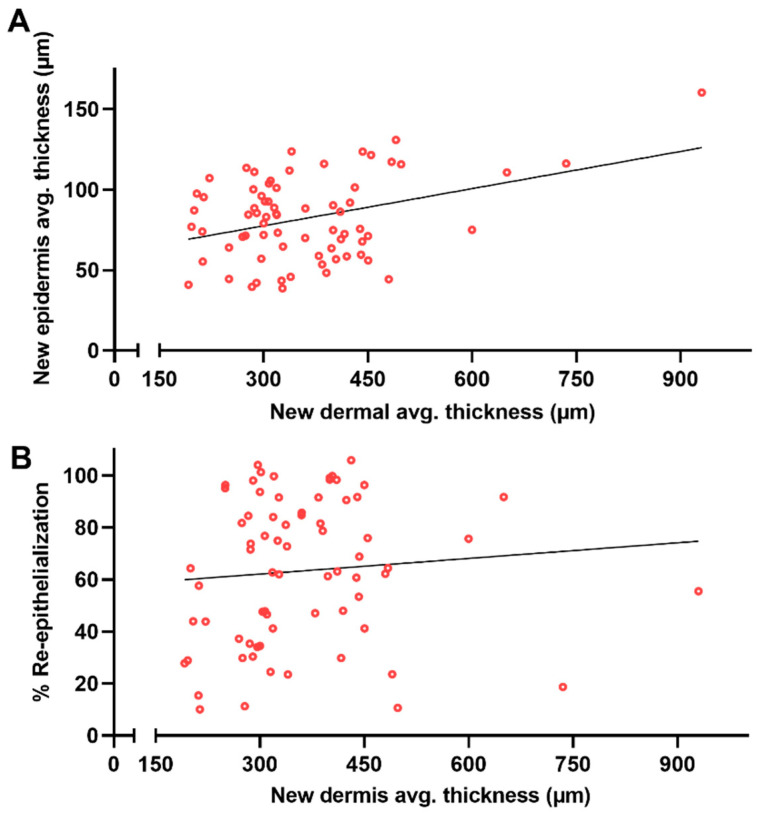
The wound-healing process is a physiological response that begins after a disruption to the integrity of tissues present in the skin. To understand the intricacies involved in this process, many groups have tried to develop different in vitro models; however, the lack of a systemic response has, until this day, been the major barrier to the establishment of these models as the main study platform. Therefore, in vivo models are still the most common system for studying healing responses following different treatments, especially porcine models, which share several morphological similarities to the human skin. In this work, we developed a porcine excisional wound model and used semi-automated software as a strategy to generate quantitative morphometric results of healing responses by specific tissues and compartments. Our aim was to extract the most information from the model while producing reliable, reproducible, and standardized results. In order to achieve this, we established a 7-day treatment using a bacterial cellulose dressing as our standard for all the analyzed wounds. The thickness of the residual dermis under the wound (DUtW) bed was shown to influence the healing outcome, especially for the regeneration of epidermal tissue, including the wound closure rate. The analysis of the DUtW throughout the entire dorsal region of the animals opened up the possibility of establishing a map that will facilitate the experimental design of future works, increasing their standardization and reproducibility and ultimately reducing the number of animals needed. Thus, the developed model, together with the automated morphometric analysis approach used, offers the possibility to generate robust quantitative results with a rapid turnaround time while allowing the study of multiple extra morphometric parameters, creating a more holistic analysis.

Keywords: burns; reproducibility; semi-automated analysis; standardization; translational model; wound healing model.


Conflict of interest statement

This study was funded by Evomedis GmbH, Austria, of which the author, Martin Funk, is a part. Fabian Kukla and Thomas Lemarchand were employed by the TPL Path Labs GmbH. This had no influence on the collection, analysis, interpretation, or submission of the manuscript. The remaining authors declare that the research was conducted in the absence of any commercial of financial relationship that could be constructed as a potential conflict of interest.

Figures

Figure 1
Figure 1
Establishment of the wound donor sites and guide for the preparation of the histological slides. (A) Schematic illustration depicting the region on the dorsum of the animals where the wounds would be generated. (B) Image of the dorsum of a representative example of how the areas would be delineated. (C) Illustration depicting how the excision wounds would be created. (D) Images showing two examples of freshly created wounds and wounds after the placement of the wound dressing. (E) Visual guide for histological section preparation White arrows indicating the position where the section sequence started.
Figure 2
Figure 2
Tissue recognition using automated software. Representative example of the morphometric analysis at day 7 of the areas of the wound dressing, the exudate on the wound surface, the new epidermis, the new dermis, and the dermis under the wound (DUtW), performed by the automated software. (A) Microscopy of an H&E-stained slide. (B) Image of the same microscopy postanalysis by the software. The scale bar represents 500 μm.
Figure 3
Figure 3
Area of the remaining dermis under the wound. Diagram showing (A) the results of the remaining dermis under the wound (DUtW) area for each position, left and right, and (B) the results comparing the thicknesses of the DUtW for positions left and right combined. (C) Diagram for the areas of the remaining DUtW for each position and schematic representation of the donor site position scattered on the dorsal part of the animals (n = 8). The results are expressed as means and standard errors of the mean. p * < 0.02 and p ** < 0.009.
Figure 4
Figure 4
Individual animal influence on the thickness of the remaining dermis under the wound (DUtW). (A) Heat map of the DUtW average thickness (μm) for each studied animal, considering the dorsal flank where the donor sites were created. The DUtW values were arranged considering positions 1–6 and positions 7–12. The burgundy tone represents high values, the ocher tone represents mid-to-high values, the yellow tone represents mid values, the light yellow tone represents mid-to-low values, and the white tone represents low values. In grey boxes, NA represent sections where the measurements for this area was not possible. (B) Correlation between the residual dermis thickness and the body weight of each animal. The results are expressed as means and standard deviations. Simple linear regression was calculated and plotted as a guide to help observe the tendency of the scattered plots, with no statistical importance.
Figure 5
Figure 5
Schematic map of the thickness of the dermis under the wound. (A) Schematic illustration of the individual mean values for the thickness of the dermis under the wound (DUtW) obtained for each position. Highlighted is the model depicting where the results for each of the eight animals were plotted. (B) Final map compiling the mean results for the thickness of the DUtW.
Figure 6
Figure 6
Influence of the remaining dermis under the wound on different healing parameters. (A) Scatter plot with morphometric data for the correlation between the percentage of re-epithelialization and the area of the dermis under the wound (DUtW). (B) Bar diagram of the percentage of re-epithelialization comparing the results for positions closer to the cranial part of the dorsum (positions 1, 7, and 8) and closer to the caudal part (positions 6, 11, and 12). p ** < 0.008. (C) Scatter plot of the correlation between the average thickness of the new dermal tissue and the area of the remaining DUtW. Simple linear regression was calculated and plotted as a guide to help observe the tendency of the scattered plots, with no statistical importance.
Figure 7
Figure 7
Influence of exudate and moisture balance on regenerated dermal tissue and wound closure. (A) Scatter plot of the morphometric data for the average thickness of the exudate after 7 days of treatment correlated to the average thickness of the new dermal tissue. (B) Diagram with the scatter plot of the correlation between the average thickness of the exudate and the percentage of re-epithelialization. (C) Scatter plot of the average thickness of the epicitehydro dressing after the 7-day treatment correlated with the average thickness of the regenerated dermal tissue and (D) correlated with the re-epithelialization rate. Simple linear regression was calculated and plotted as a guide to help observe the tendency of the scattered plots, with no statistical importance.
Figure 8
Figure 8
Influence of regenerated dermal tissue on different epidermal healing parameters. (A) Scatter plot of the average new dermal thickness correlated with the new epidermal area and (B) correlated with the percentage of re-epithelialization. Simple linear regression was calculated and plotted as a guide to help observe the tendency of the scattered plots, with no statistical importance.

Similar articles

References

    1. Singer A.J., Clark R.A. Cutaneous wound healing. N. Engl. J. Med. 1999;341:738–746. doi: 10.1056/NEJM199909023411006. - DOI - PubMed
    1. Tottoli E.M., Dorati R., Genta I., Chiesa E., Pisani S., Conti B. Skin wound healing process and new emerging technologies for skin wound care and regeneration. Pharmaceutics. 2020;12:735. doi: 10.3390/pharmaceutics12080735. - DOI - PMC - PubMed
    1. Rodrigues M., Kosaric N., Bonham C.A., Gurtner G.C. Wound healing: A cellular perspective. Physiol. Rev. 2019;99:665–706. doi: 10.1152/physrev.00067.2017. - DOI - PMC - PubMed
    1. Gurtner G.C., Werner S., Barrandon Y., Longaker M.T. Wound repair and regeneration. Nature. 2008;453:314–321. doi: 10.1038/nature07039. - DOI - PubMed
    1. Reinke J.M., Sorg H. Wound repair and regeneration. Eur. Surg. Res. 2012;49:35–43. doi: 10.1159/000339613. - DOI - PubMed

Grants and funding

LinkOut - more resources