

Single and Mixed Strains of Probiotics Reduced Hepatic Fat Accumulation and Inflammation and Altered Gut Microbiome in a Nonalcoholic Steatohepatitis Rat Model
- PMID: 39200311
- PMCID: PMC11605219
- DOI: 10.3390/biomedicines12081847
Single and Mixed Strains of Probiotics Reduced Hepatic Fat Accumulation and Inflammation and Altered Gut Microbiome in a Nonalcoholic Steatohepatitis Rat Model
Abstract
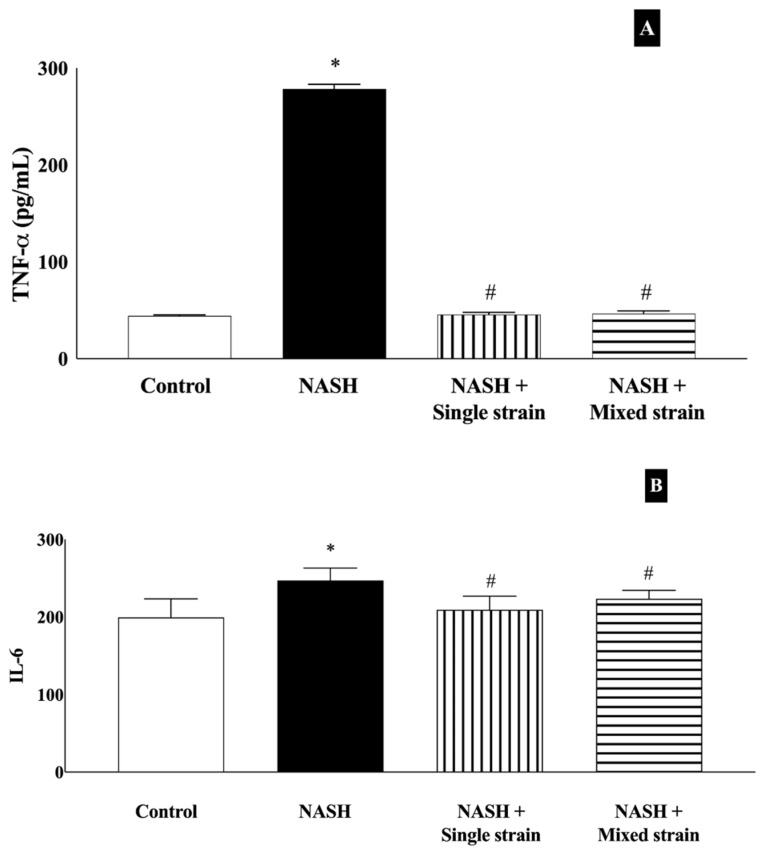
As gut dysbiosis has been implicated in the pathogenesis of nonalcoholic steatohepatitis (NASH), probiotic supplementation might be a potential treatment for this condition. The aim of this study was to evaluate the effects of single- and mixed-strain probiotics on the severity of NASH induced by a high-fat, high-fructose (HFHF) diet and their mechanisms of action. Male Sprague-Dawley rats were divided into four groups (n = 7 per group): control group, NASH group, NASH + single-strain group, and NASH + mixed-strain group. In the single-strain and mixed-strain groups, rats received Lactobacillus plantarum B7 and Lactobacillus rhamnosus L34 + Lactobacillus paracasei B13 by oral gavage once daily, respectively. The duration of the study was 6 weeks. Liver tissue was used for histopathology, hepatic fat content was assessed by Oil Red O staining and hepatic free fatty acid (FFA), and hepatic TLR4 and CD14 expression were assessed by immunohistochemistry. Fresh feces was collected for gut microbiota analysis. Liver histology revealed a higher degree of fat accumulation, hepatocyte ballooning, and lobular inflammation in the NASH group, which improved in probiotics-treated groups. The amounts of hepatic fat droplets and hepatic FFA levels were more pronounced in the NASH group than in the control and treatment groups. Serum TNF- α levels were significantly higher in the NASH group than in control and probiotic groups. The expression of CD14 and TLR4 increased in the NASH group as compared with the control and probiotics-treated groups. Alpha diversity was reduced in the NASH group, but increased in both treatment groups. The relative abundance of Lactobacillus significantly decreased in the NASH group, but increased in both treatment groups. The relative abundance of Akkermansia significantly increased in the NASH group, but decreased in both treatment groups. In conclusion, both single-strain and mixed-strain probiotics could improve NASH histology by suppressing inflammatory responses in the liver, with this improvement potentially being associated with changes in the gut microbiota.
Keywords: CD14; TLR4; gut microbiota; nonalcoholic steatohepatitis; probiotics.
Conflict of interest statement
The authors declare no conflicts of interest.
Figures


Similar articles
-
Genistein and Sex Hormone Supplementation Modulated Hepatic PPARα, δ, and γ Subtypes and STAT1 Expressions in a NASH Rat Model with Bilateral Orchidectomy.Biomedicines. 2024 Feb 21;12(3):483. doi: 10.3390/biomedicines12030483. Biomedicines. 2024. PMID: 38540097 Free PMC article.
-
Lactobacillus paracasei Induces M2-Dominant Kupffer Cell Polarization in a Mouse Model of Nonalcoholic Steatohepatitis.Dig Dis Sci. 2015 Nov;60(11):3340-50. doi: 10.1007/s10620-015-3770-1. Epub 2015 Jul 5. Dig Dis Sci. 2015. PMID: 26143342
-
Genistein and sex hormone treatment alleviated hepatic fat accumulation and inflammation in orchidectomized rats with nonalcoholic steatohepatitis.Heliyon. 2024 Feb 8;10(4):e26055. doi: 10.1016/j.heliyon.2024.e26055. eCollection 2024 Feb 29. Heliyon. 2024. PMID: 38380011 Free PMC article.
-
The Therapeutic Implications of the Gut Microbiome and Probiotics in Patients with NAFLD.Diseases. 2019 Feb 25;7(1):27. doi: 10.3390/diseases7010027. Diseases. 2019. PMID: 30823570 Free PMC article. Review.
-
Understanding the Role of the Gut Microbiome and Microbial Metabolites in Non-Alcoholic Fatty Liver Disease: Current Evidence and Perspectives.Biomolecules. 2021 Dec 31;12(1):56. doi: 10.3390/biom12010056. Biomolecules. 2021. PMID: 35053205 Free PMC article. Review.
Cited by
-
Therapeutic Potential of Probiotics in Metabolic Dysfunction-Associated Steatohepatitis: A Comprehensive Review.Microorganisms. 2025 Aug 14;13(8):1894. doi: 10.3390/microorganisms13081894. Microorganisms. 2025. PMID: 40871398 Free PMC article. Review.
-
Effects of Enterococcus faecalis Supplementation on Growth Performance, Hepatic Lipid Metabolism, and mRNA Expression of Lipid Metabolism Genes and Intestinal Flora in Geese.Animals (Basel). 2025 Jan 18;15(2):268. doi: 10.3390/ani15020268. Animals (Basel). 2025. PMID: 39858268 Free PMC article.
-
Advances in Pathogenesis and Therapeutics of Hepatobiliary Diseases II.Biomedicines. 2025 Apr 8;13(4):904. doi: 10.3390/biomedicines13040904. Biomedicines. 2025. PMID: 40299489 Free PMC article.
References
Grants and funding
- GCUGR1125641001M/the 90th Anniversary Fund of Chulalongkorn University (Ratchada phiseksomphot Endowment Fund)
- GA65/26/Grant of Ratchadaphiseksomphot, Faculty of Medicine, Chulalongkorn University
- B36G660010/Program Management Unit for Human Resources & Institutional Development, Research and Innovation (PMU-B)
LinkOut - more resources
Full Text Sources
Research Materials
