. 2024 Aug 7;13(16):2484.
doi: 10.3390/foods13162484.

Structural Characterization and Abundance of Sialylated Milk Oligosaccharides in Holstein Cows during Early Lactation

Affiliations

Structural Characterization and Abundance of Sialylated Milk Oligosaccharides in Holstein Cows during Early Lactation

Lisa Isernhagen et al. Foods. .

Abstract

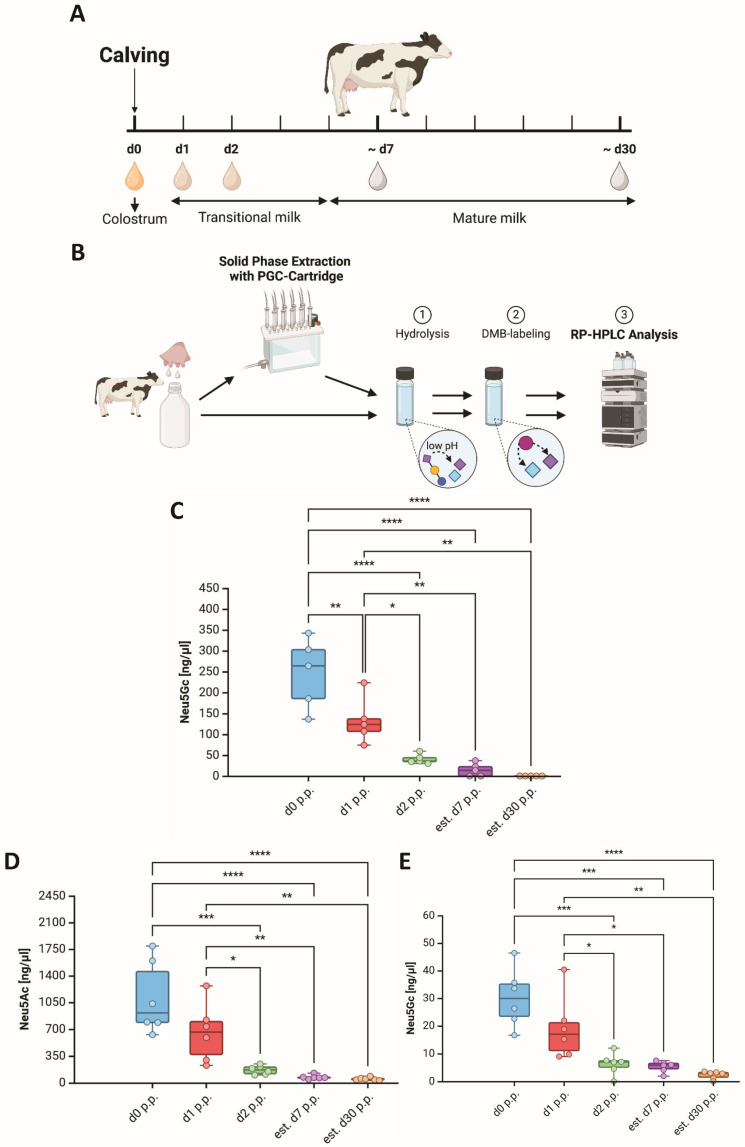
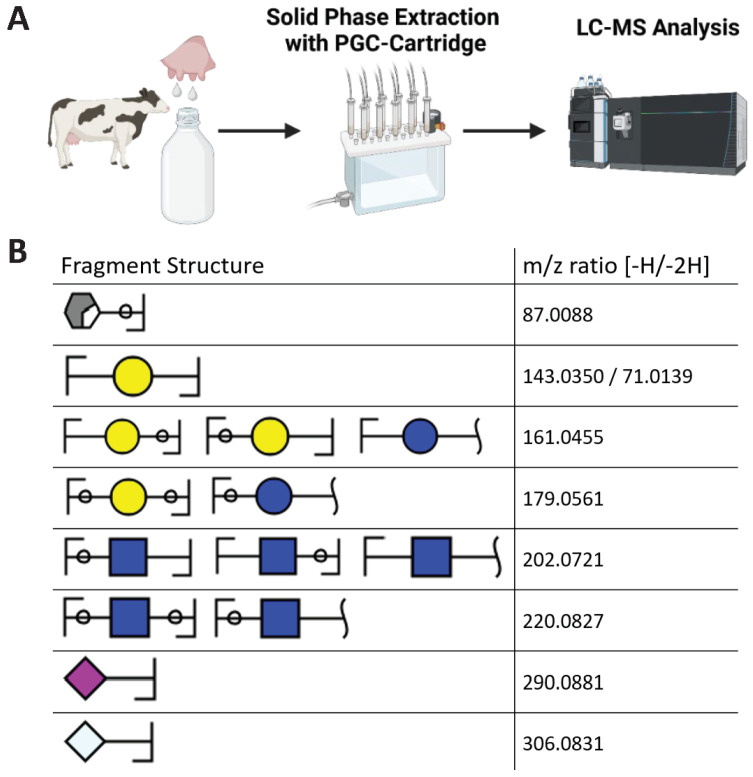
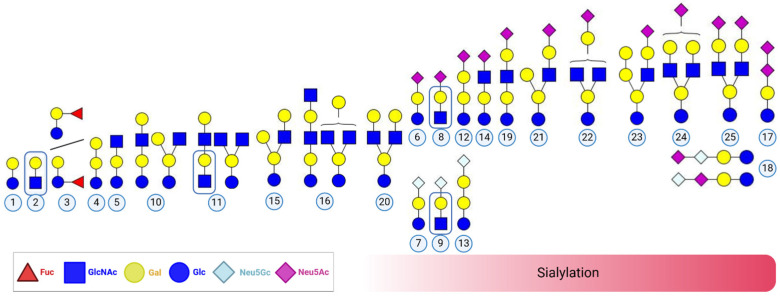
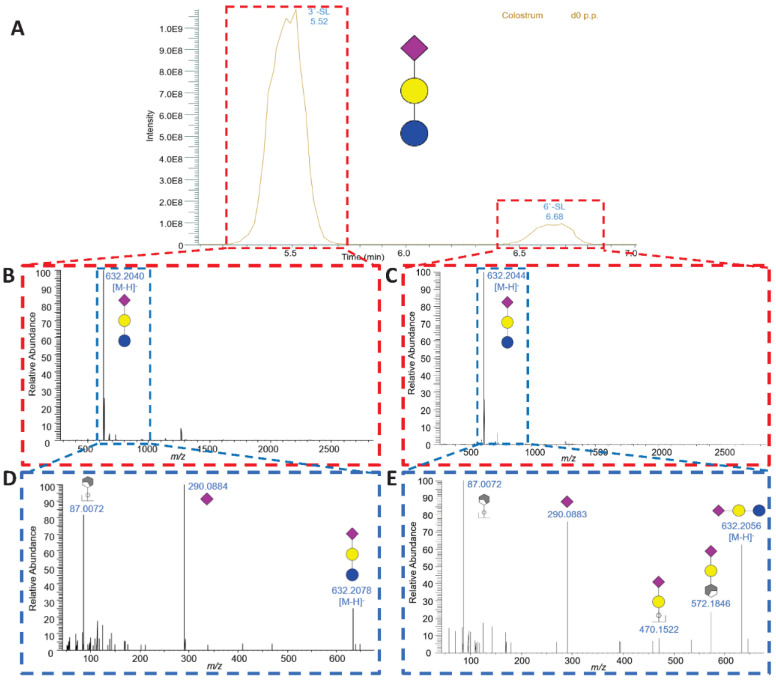
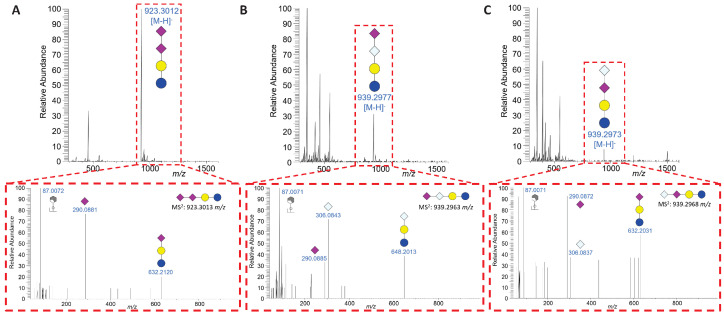
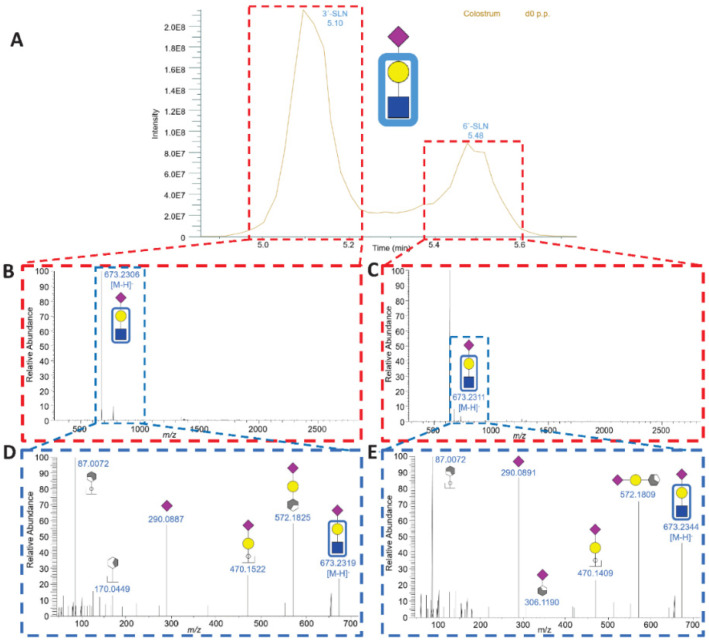
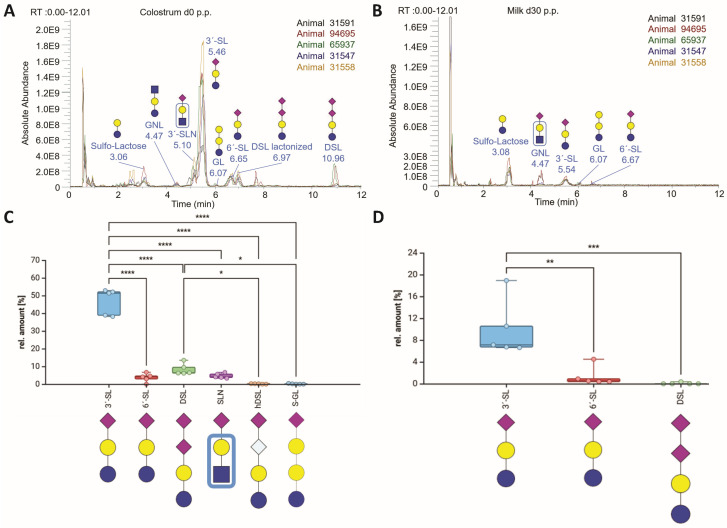
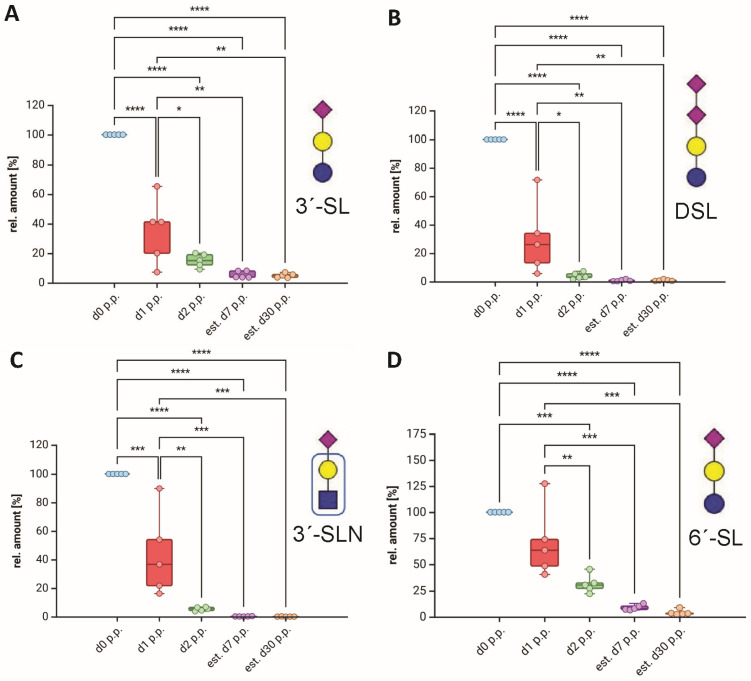
Among other bioactive molecules, milk contains high amounts of sialylated milk oligosaccharides (MOs) that influence numerous processes in the offspring. For instance, sialylated MOs inhibit the invasion of pathogens and positively influence the gut microbiome to support the optimal development of the offspring. For these reasons, sialylated MOs are also used in infant formula as well as food supplements and are potential therapeutic substances for humans and animals. Because of the high interest in sialylated bovine MOs (bMOs), we used several analytical approaches, such as gas and liquid chromatography in combination with mass spectrometry, to investigate in detail the profile of sialylated bMOs in the milk of Holstein Friesian cows during early lactation. Most of the 40 MOs identified in this study were sialylated, and a rapid decrease in all detected sialylated bMOs took place during the first day of lactation. Remarkably, we observed a high variance within the sialylation level during the first two days after calving. Therefore, our results suggest that the content of sialylated MOs might be an additional quality marker for the bioactivity of colostrum and transitional milk to ensure its optimized application for the production of milk replacer and food supplements.

Keywords: bovine milk; colostrum; lactation; milk oligosaccharides; sialic acids; sialyllactose.


Conflict of interest statement

The authors declare no conflicts of interest.

Figures

Figure 1
Figure 1
Quantification of Neu5Gc in milk from Holstein Friesian cows. (A) Sampling timeline for milk collection. The time ranges of colostrum, transitional milk, and mature milk were specified on the basis of Silva et al. [49]. Created with BioRender.com. (B) Scheme of the DMB-RP-HPLC strategy for sialic acid quantification. Sialic acid residues in milk as well as in the extracted bMOs fraction were released by hydrolysis and subsequently labeled with DMB for fluorescence detection using an RP-HPLC system equipped with a fluorescence detector. Created with BioRender.com. (C) Box and whisker plots (median; min to max) showing the Neu5Gc values during early lactation (n = 6 animals) as well as the values for Neu5Ac (D) and Neu5Gc (E) in the extracted bMOs fraction (n = 5 animals). The statistical analysis and graphs were generated using BioRender.com. Significant differences are denoted as follows: *: p < 0.05, **: p < 0.01, ***: p < 0.001, ****: p < 0.0001.
Figure 2
Figure 2
Analysis of bMO distribution using LC-MS. (A) Scheme of bMO analysis using LC-MS. After bMO enrichment using PGC cartridges, the resulting bMOs were analyzed using HILIC-HESI-MS/(MS). Created with BioRender.com. (B) The displayed MS fragments of bMOs were used for the identification of bMOs. For the manual verification process, at least one of those fragments had to be found in the corresponding MS2 spectrum to identify the detected bMO. For the sialylated bMOs, the most significant fragment was always the cleaved sialic acid residues (Neu5Ac or Neu5Gc). The bMO structures were computed with GlycoWorkbench 2 [43].
Figure 3
Figure 3
Proposed structures of the detected disaccharides lactose and lactosamine in addition to bMOs in Holstein Friesian cows during early lactation. For some bMOs, multiple linkages and compositions have been reported. Due to the lack of specific linkage analysis and for clarity purposes, not all possible isomers are visualized. The bMO structures were designed with GlycoWorkbench 2 [43] and assembled using BioRender.com. Each structure is given the corresponding number used in this study, which is also described in Table 1.
Figure 4
Figure 4
LC-MS analysis of sialyllactose (SL). (A) Extracted ion chromatogram (EIC) of SLs shown for representative samples on the day of calving. (B) MS spectrum at 5.46 min showing the deprotonated molecular ion [M-H] of SL with its corresponding MS/MS spectrum (D) showing two MO fragments as a cross-ring fragment of a Hex with 87.0072 m/z and a detached Neu5Ac at 290.0884 m/z. (C) MS spectrum at 6.68 min showing the deprotonated molecular ion [M-H] of SL with its corresponding MS/MS spectrum (E) showing fragments at 87.0072 and 290.0883 m/z, as well as Neu5Ac attached to a Hex (470.1522 m/z) and Neu5Ac attached to a Hex with an additional cross-ring fragment of another Hex (572.1846 m/z). The bMO structures were designed with GlycoWorkbench 2 [43].
Figure 5
Figure 5
LC-MS analysis of DSL. (A) MS spectrum at 10.99 min showing the deprotonated molecular ion for DSL containing a Neu5Ac dimer attached to the lactose core and the corresponding MS2 spectrum for DSL at this time. The MS2 spectrum shows three fragments, two of which are already mentioned for SL in Figure 4 (87.0072 and 290.0881 m/z), and one larger fragment is SL with 632.2120 m/z, validating the linear composition of DSL. (B) MS spectrum at 11.51 min showing the deprotonated molecular ion for heterogenic DSL (hDSL) consisting of Neu5Ac as well as Neu5Gc attached to the lactose core and the corresponding MS2 spectrum for hDSL at this time. The MS2 spectrum shows four fragments, two of which were already mentioned for SL in Figure 4 (87.0071 and 290.0885 m/z), as well as one larger fragment, NGL, with 648.2013 m/z, validating the linear composition of hDSL as NGL with an additional Neu5Ac attached. (C) The MS spectrum at 12.69 min displays the deprotonated molecular ion for hDSL and the corresponding MS2 spectrum for hDSL at this time. The MS2 spectrum shows four fragments, three of which were already mentioned for hDSL (87.0071, 290.0872, and 306.0837 m/z), as well as SL with 632.2031 m/z, validating the linear composition of the second hDSL as SL with an additional Neu5Gc attached. The bMO structures were designed with GlycoWorkbench 2 [43].
Figure 6
Figure 6
LC-MS analysis of sialyllactosamine (SLN). (A) Extracted ion chromatogram (EIC) of SLN shown for a representative sample on the day of calving. (B) MS spectrum at 5.10 min showing the deprotonated molecular ion 673.2306 m/z of SLN with the corresponding MS2 spectrum, (D) which displays the same fragments as those displayed for SL in Figure 5, with an additional fragment of another cross-ring fragment of Hex at 170.0449 m/z. (C) MS spectrum at 5.50 min showing the deprotonated molecular ion 673.2311 m/z of SLN with the corresponding MS2 spectrum, (E) which shows the same fragments as noted at 5.10 min. Additionally, there is another fragment of Neu5Ac attached to a cross-ring fragment of a Hex (306.1190 m/z), which indicates the α2,6-linkage of Neu5Ac. The bMO structures were computed with GlycoWorkbench 2 [43].
Figure 7
Figure 7
Distribution of bMOs during lactation. (A) The total ion chromatography (TIC) from the colostrum samples on day 0 p.p. of the analyzed Holstein cattle were overlaid using FreeStyle software (Thermo Fisher). The MO peaks were labeled with the name and retention time of the base peak. (B) The TIC from the colostrum samples on day 30 p.p. of the analyzed Holstein cattle were overlaid using FreeStyle software. The MO peaks were labeled with the name and retention time of the base peak. The ratios of the peak areas of the sialylated bMOs were determined (n = 5 animals), and box and whisker plots (median; min to max) are shown for (C) day 0 and (D) day 30 p.p. Only sialylated bMOs with peak areas greater than 0.1% were included. The statistical analysis and graphs were generated using BioRender.com. Significant differences are denoted as follows: *: p < 0.05, **: p < 0.01, ***: p < 0.001, ****: p < 0.0001. The bMO structures were designed with GlycoWorkbench 2 [43].
Figure 8
Figure 8
Abundance of the major sialylated bMOs during early lactation. The EICs were used to calculate the ratios of the peak areas of the most abundant sialylated bMOs. Box and whisker plots (median; min to max) are shown for (A) 3′-SL, (B) DSL, (C) 3′SLN, and (D) 6′-SL (n = 5 animals). Statistical analysis and graphs were generated using BioRender.com. Significant differences are denoted as follows: *: p < 0.05, **: p < 0.01, ***: p < 0.001, ****: p < 0.0001. The bMO structures were designed with GlycoWorkbench 2 [43].

Similar articles

References

    1. Dai D., Nanthkumar N.N., Newburg D.S., Walker W.A. Role of oligosaccharides and glycoconjugates in intestinal host defense. J. Pediatr. Gastroenterol. Nutr. 2000;30((Suppl. 2)):23–33. doi: 10.1097/00005176-200000002-00005. - DOI - PubMed
    1. Lepenies B., Yin J., Seeberger P.H. Applications of synthetic carbohydrates to chemical biology. Curr. Opin. Chem. Biol. 2010;14:404–411. doi: 10.1016/j.cbpa.2010.02.016. - DOI - PubMed
    1. Bornhöfft K.F., Galuska S.P. Glycans as Modulators for the Formation and Functional Properties of Neutrophil Extracellular Traps: Used by the Forces of Good and Evil. Front. Immunol. 2019;10:959. doi: 10.3389/fimmu.2019.00959. - DOI - PMC - PubMed
    1. Kronimus Y., Dodel R., Galuska S.P., Neumann S. IgG Fc N-glycosylation: Alterations in neurologic diseases and potential therapeutic target? J. Autoimmun. 2019;96:14–23. doi: 10.1016/j.jaut.2018.10.006. - DOI - PubMed
    1. Zlatina K., Galuska S.P. Immunoglobulin Glycosylation—An Unexploited Potential for Immunomodulatory Strategies in Farm Animals. Front. Immunol. 2021;12:753294. doi: 10.3389/fimmu.2021.753294. - DOI - PMC - PubMed

LinkOut - more resources