. 2024 Aug 12;12(16):1608.
doi: 10.3390/healthcare12161608.

Effects of Community Assets on Major Health Conditions in England: A Data Analytic Approach

Affiliations

Effects of Community Assets on Major Health Conditions in England: A Data Analytic Approach

Aristides Moustakas et al. Healthcare (Basel). .

Abstract

Introduction: The broader determinants of health including a wide range of community assets are extremely important in relation to public health outcomes. Multiple health conditions, multimorbidity, is a growing problem in many populations worldwide.

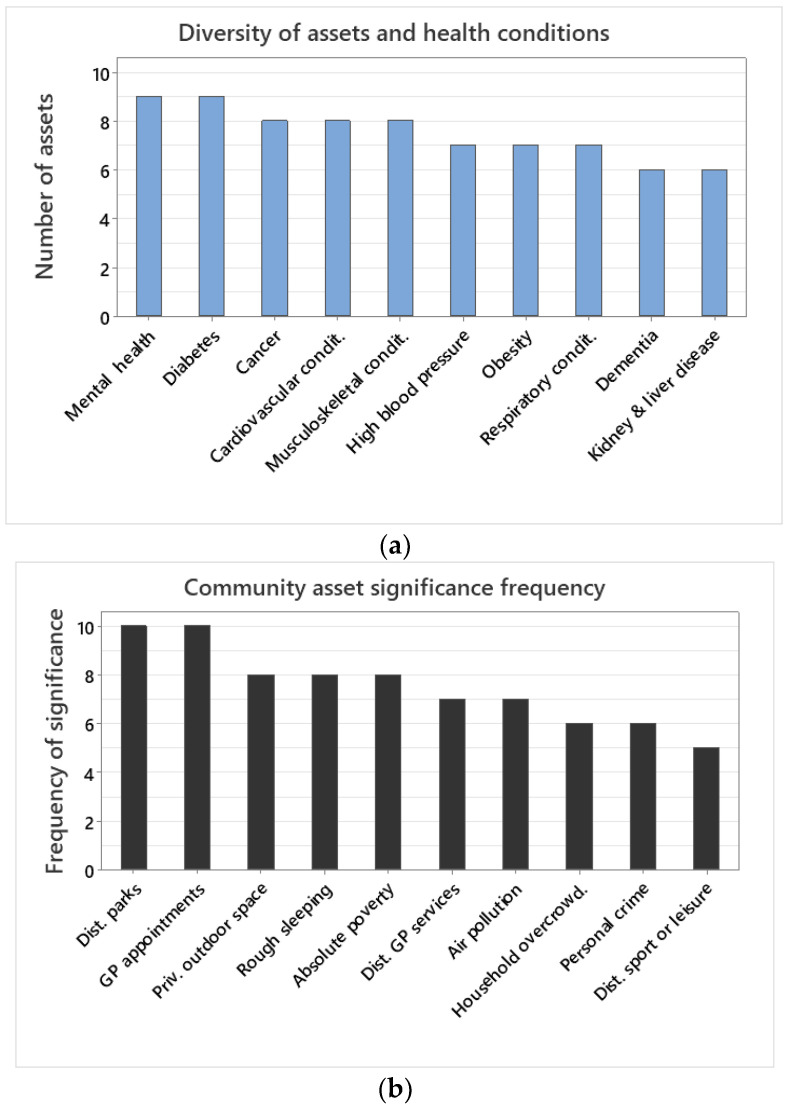
Methods: This paper quantified the effect of community assets on major health conditions for the population of England over six years, at a fine spatial scale using a data analytic approach. Community assets, which included indices of the health system, green space, pollution, poverty, urban environment, safety, and sport and leisure facilities, were quantified in relation to major health conditions. The health conditions examined included high blood pressure, obesity, dementia, diabetes, mental health, cardiovascular conditions, musculoskeletal conditions, respiratory conditions, kidney and liver disease, and cancer. Cluster analysis and dendrograms were calculated for the community assets and major health conditions. For each health condition, a statistical model with all community assets was fitted, and model selection was performed. The number of significant community assets for each health condition was recorded. The unique variance, explained by each significant community asset per health condition, was quantified using hierarchical variance partitioning within an analysis of variance model.

Results: The resulting data indicate major health conditions are often clustered, as are community assets. The results suggest that diversity and richness of community assets are key to major health condition outcomes. Primary care service waiting times and distance to public parks were significant predictors of all health conditions examined. Primary care waiting times explained the vast majority of the variances across health conditions, with the exception of obesity, which was better explained by absolute poverty.

Conclusions: The implications of the combined findings of the health condition clusters and explanatory power of community assets are discussed. The vast majority of determinants of health could be accounted for by healthcare system performance and distance to public green space, with important covariate socioeconomic factors. Emphases on community approaches, significant relationships, and asset strengths and deficits are needed alongside targeted interventions. Whilst the performance of the public health system remains of key importance, community assets and local infrastructure remain paramount to the broader determinants of health.

Keywords: community assets; data analytics; environmental health; green space; healthcare; multimorbidity.


Conflict of interest statement

The authors declare no conflict of interest.

Figures

Figure 1
Figure 1
(a) A spatial plot of a local healthcare unit (LTLA). Map plotted in Google maps using data from the Geoportal Statistics UK, available at: https://geoportal.statistics.gov.uk/datasets/196d1a072aaa4882a50be333679d4f63/explore?showTable=true (accessed 20 February 2024). (b) Block diagram of the framework applied here. Initially data were mined from publicly available spatiotemporal data sets at the level of an LTLA. Data were standardised sequentially to facilitate comparisons across space, time, and unequal demographics. Clusters of community assets and health conditions were computed and visualised. Generalised linear models (GLMs) were fitted for each health condition as dependent variables and community assets as explanatory variables. Model selection was performed for each GLM eliminating the least informative community asset variables per health condition. The diversity of community assets as significant predictors per health condition was calculated. Hierarchical variance partitioning between each health condition and the significant explanatory community assets was computed indicating the unique variance explained by each community assets per health condition.
Figure 1
Figure 1
(a) A spatial plot of a local healthcare unit (LTLA). Map plotted in Google maps using data from the Geoportal Statistics UK, available at: https://geoportal.statistics.gov.uk/datasets/196d1a072aaa4882a50be333679d4f63/explore?showTable=true (accessed 20 February 2024). (b) Block diagram of the framework applied here. Initially data were mined from publicly available spatiotemporal data sets at the level of an LTLA. Data were standardised sequentially to facilitate comparisons across space, time, and unequal demographics. Clusters of community assets and health conditions were computed and visualised. Generalised linear models (GLMs) were fitted for each health condition as dependent variables and community assets as explanatory variables. Model selection was performed for each GLM eliminating the least informative community asset variables per health condition. The diversity of community assets as significant predictors per health condition was calculated. Hierarchical variance partitioning between each health condition and the significant explanatory community assets was computed indicating the unique variance explained by each community assets per health condition.
Figure 2
Figure 2
(a) Dendrograms of the cluster analysis among health conditions. The cluster analysis deploys a hierarchical procedure to form the clusters. Variables were grouped together that are correlated (i.e., similarity) to each other. Similarity is indicated by the Pearsons’ correlation values. (b) Dendrograms of the cluster analysis among the assets. The cluster analysis deployed a hierarchical procedure to form the clusters. Variables were grouped together that are correlated (i.e., similarity) with each other. Similarity is indicated by the Pearsons’ correlation values.
Figure 2
Figure 2
(a) Dendrograms of the cluster analysis among health conditions. The cluster analysis deploys a hierarchical procedure to form the clusters. Variables were grouped together that are correlated (i.e., similarity) to each other. Similarity is indicated by the Pearsons’ correlation values. (b) Dendrograms of the cluster analysis among the assets. The cluster analysis deployed a hierarchical procedure to form the clusters. Variables were grouped together that are correlated (i.e., similarity) with each other. Similarity is indicated by the Pearsons’ correlation values.
Figure 3
Figure 3
(a) Number of community assets included in the final model between a health condition (i.e., dependent variable) and the ten community asset explanatory variables investigated. The final model refers to the community assets included in the model after model selection eliminating the least informative ones. (b) Number of times that a community asset was included in the final model for a health condition.
Figure 4
Figure 4
(a) Pie chart of unique variance explained by each community asset per health condition. (b) Sum of total unique variance explained by each community asset across health conditions. (c) Sum of total unique variance explained per health condition.
Figure 4
Figure 4
(a) Pie chart of unique variance explained by each community asset per health condition. (b) Sum of total unique variance explained by each community asset across health conditions. (c) Sum of total unique variance explained per health condition.

Similar articles

References

    1. Pearson-Stuttard J., Ezzati M., Gregg E.W. Multimorbidity—A defining challenge for health systems. Lancet Public Health. 2019;4:e599–e600. doi: 10.1016/S2468-2667(19)30222-1. - DOI - PubMed
    1. NIHR . Multiple Long-Term Conditions (Multimorbidity): Making Sense of the Evidence. Public Health; Bethesda, ML, USA: 2021. National Institute for Health and Care Research. - DOI
    1. GOV.UK Major Conditions Strategy: Case for Change and Our Strategic Framework. [(accessed on 20 February 2024)];Updated 21 August 2023. 2023 Available online: https://www.gov.uk/government/publications/major-conditions-strategy-cas....
    1. Healthcaredenmark Chronic Diseases and Multimorbidity in Denmark. 2023. [(accessed on 20 February 2024)]. Available online: https://healthcaredenmark.dk/news-publications/publications/chronic-dise...
    1. Struckmann V., Snoeijs S., Melchiorre M.G., Hujala A., Rijken M., Quentin W., van Ginneken E. Caring for people with multiple chronic conditions in Europe. Eurohealth. 2014;20:35–40.

LinkOut - more resources