. 2024 Aug 6;25(16):8577.
doi: 10.3390/ijms25168577.

Increased Homer Activity and NMJ Localization in the Vestibular Lesion het-/- Mouse soleus Muscle

Affiliations

Increased Homer Activity and NMJ Localization in the Vestibular Lesion het-/- Mouse soleus Muscle

Gabor Trautmann et al. Int J Mol Sci. .

Abstract

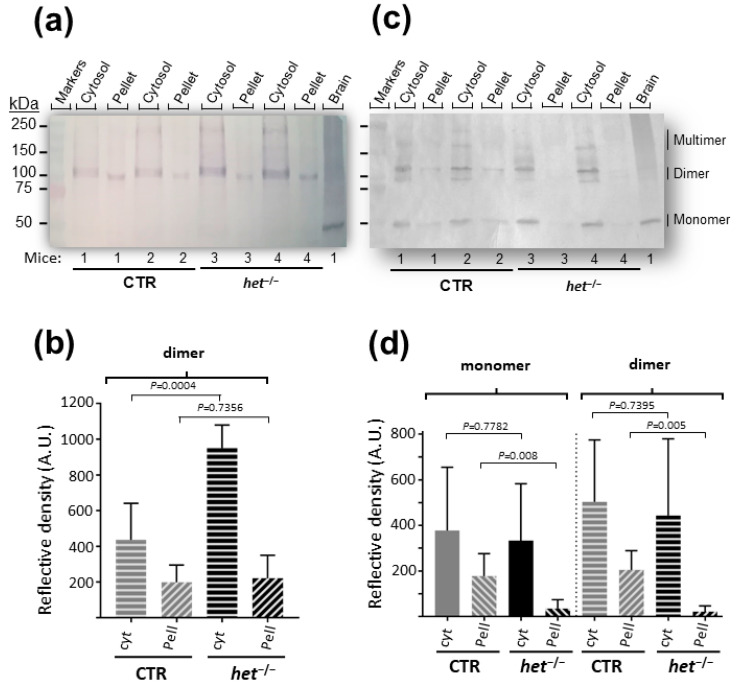
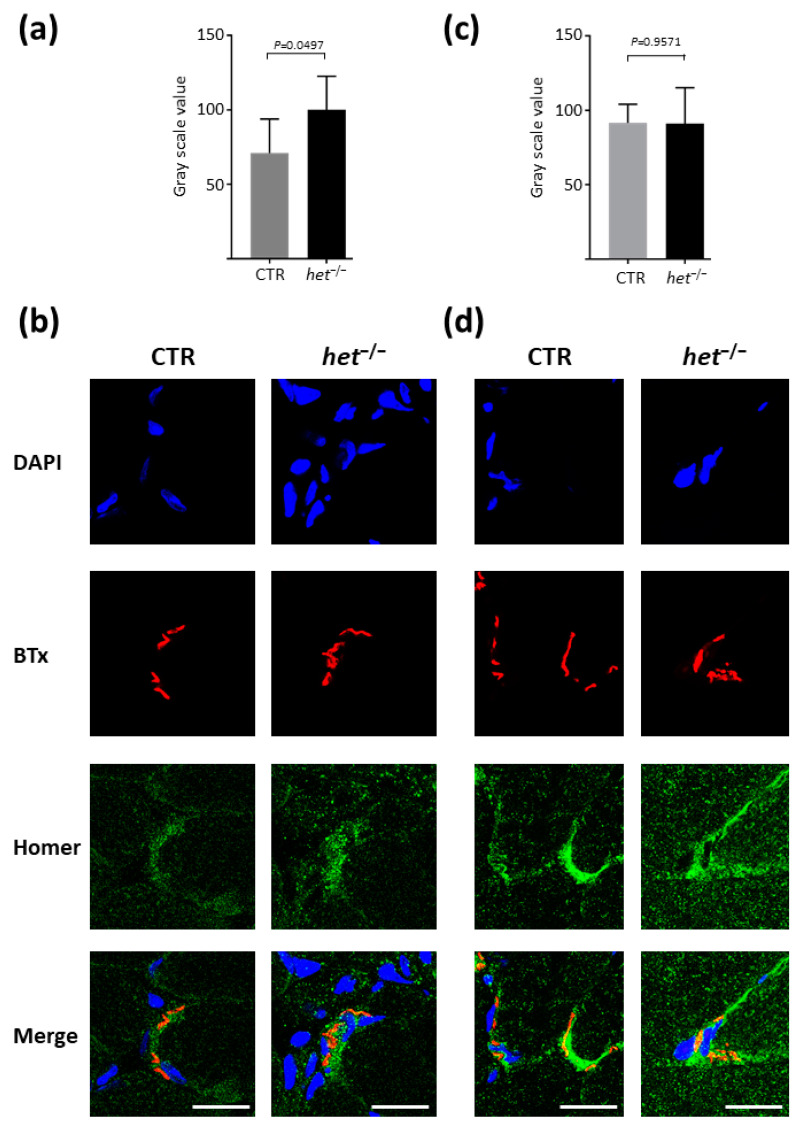
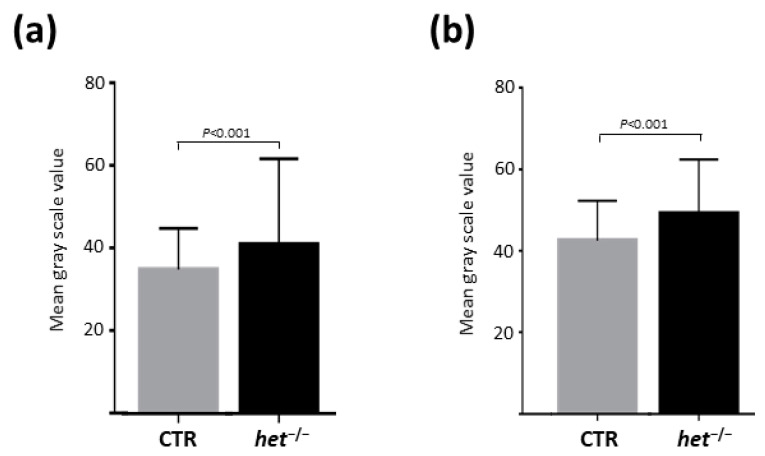
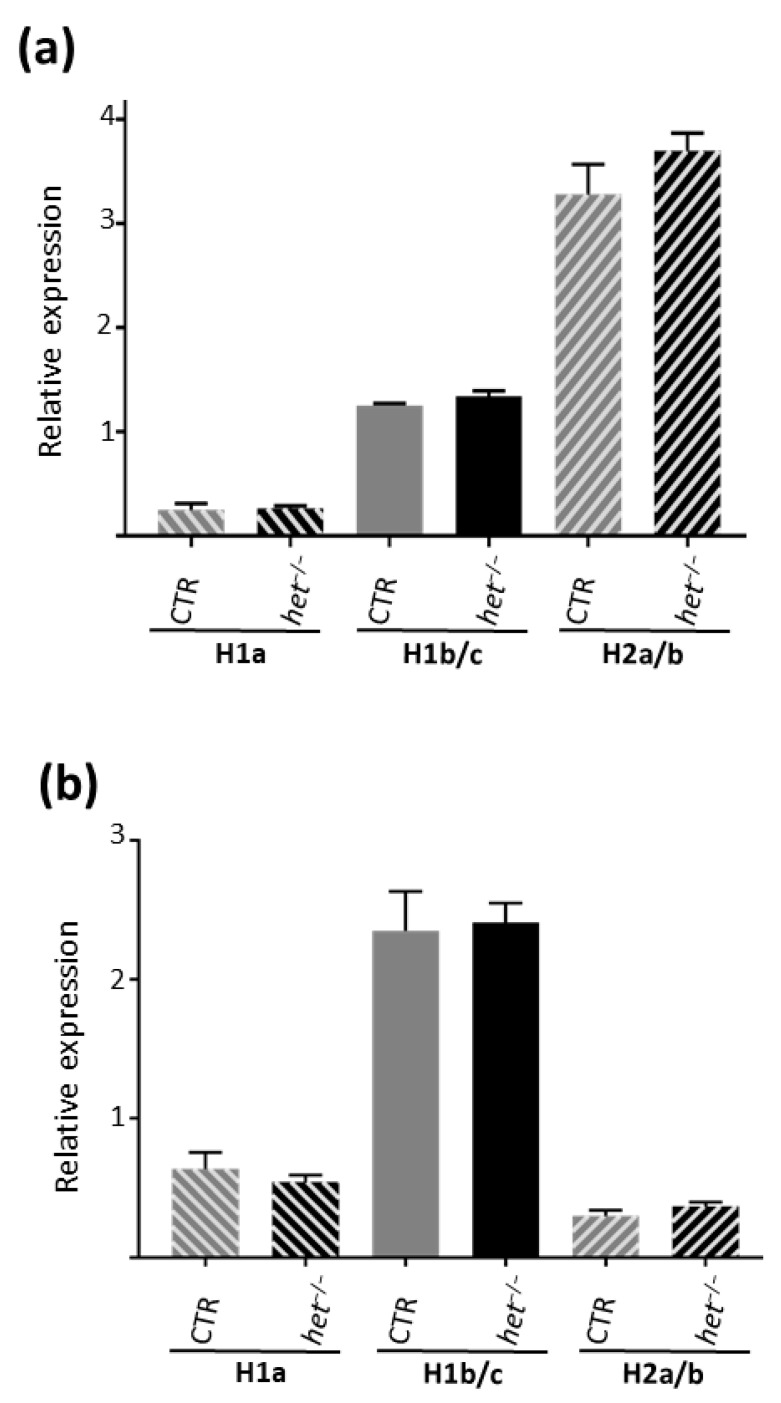
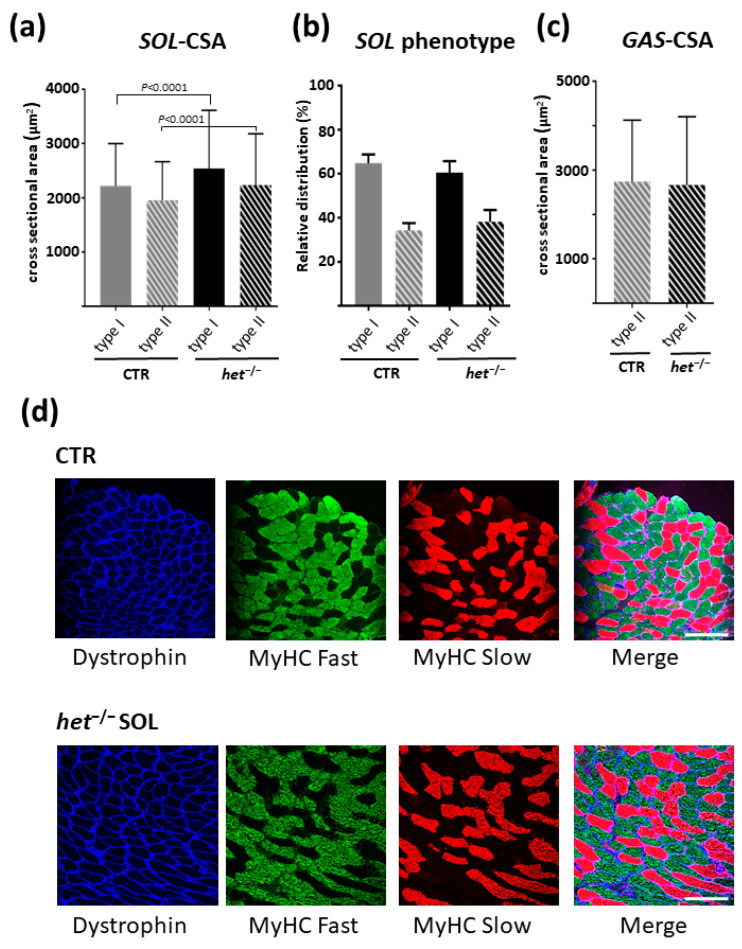
We investigated the shuttling of Homer protein isoforms identified in soluble (cytosolic) vs. insoluble (membrane-cytoskeletal) fraction and Homer protein-protein interaction/activation in the deep postural calf soleus (SOL) and non-postural gastrocnemius (GAS) muscles of het-/- mice, i.e., mice with an autosomal recessive variant responsible for a vestibular disorder, in order to further elucidate a) the underlying mechanisms of disrupted vestibular system-derived modulation on skeletal muscle, and b) molecular signaling at respective neuromuscular synapses. Heterozygote mice muscles served as the control (CTR). An increase in Homer cross-linking capacity was present in the SOL muscle of het-/- mice as a compensatory mechanism for the altered vestibule system function. Indeed, in both fractions, different Homer immunoreactive bands were detectable, as were Homer monomers (~43-48 kDa), Homer dimers (~100 kDa), and several other Homer multimer bands (>150 kDA). The het-/- GAS particulate fraction showed no Homer dimers vs. SOL. The het-/- SOL soluble fraction showed a twofold increase (+117%, p ≤ 0.0004) in Homer dimers and multimers. Homer monomers were completely absent from the SOL independent of the animals studied, suggesting muscle-specific changes in Homer monomer vs. dimer expression in the postural SOL vs. the non-postural GAS muscles. A morphological assessment showed an increase (+14%, p ≤ 0.0001) in slow/type-I myofiber cross-sectional area in the SOL of het-/- vs. CTR mice. Homer subcellular immuno-localization at the neuromuscular junction (NMJ) showed an altered expression in the SOL of het-/-mice, whereas only not-significant changes were found for all Homer isoforms, as judged by RT-qPCR analysis. Thus, muscle-specific changes, myofiber properties, and neuromuscular signaling mechanisms share causal relationships, as highlighted by the variable subcellular Homer isoform expression at the instable NMJs of vestibular lesioned het-/- mice.

Keywords: Homer; NMJ; vestibular lesion.


Conflict of interest statement

The authors declare no conflicts of interest. The sponsors had no role in the design, execution, interpretation, or writing of the study.

Figures

Figure 1
Figure 1
Homer skeletal muscle Western blot analysis from SOL (a,b) and GAS (c,d) muscle. (a) Representative image of soluble (cytosol) and insoluble (pellet) fractions of CTR and het−/− mice. Homer dimer (~90 kDa) and Homer multimer (above 150 kDa) immunoreactive bands are present in both soluble and insoluble fractions of both animal groups. (b) Homer quantification by densitometry analysis in SOL. (c) Representative image of soluble (cytosol) and insoluble (pellet) fractions of CTR and het−/− mice. Homer monomer (~43–45 kDa), dimer (~90 kDa), and multimer (above 150 kDa) immunoreactive bands are detectable mostly in the soluble fraction. No Homer immunoreactive bands are present in the insoluble fraction of het−/− mice. (d) Homer quantification by densitometry analysis in GAS. Cytosol = soluble fraction; pellet = insoluble fraction. Brain was used as positive internal control in panels a and c. Results are from at least three independent experiments. Data were compared using unpaired Student’s t-test and considered statistically significant at p ≤ 0.05. Altogether, a total of n = 6 CTR and n = 6 het−/− mice were investigated.
Figure 2
Figure 2
Homer immunofluorescence intensity at the NMJ. (a,b) SOL muscle. (a) The graphs show the mean gray scale value obtained in SOL from the Homer signal at the NMJ postsynaptic region. (b) Representative Homer immunofluorescence analysis in CTR and het−/− of NMJ SOL muscle. The number of analyzed NMJs in the SOL: het−/− n = 69; CTR n = 52. (c,d) GAS muscle. (c) The graphs show the mean gray scale value obtained in GAS from the Homer signal at the NMJ postsynaptic region. (d) Representative Homer immunofluorescence analysis in CTR and het−/− of NMJ GAS muscle. The number of analyzed NMJs in the GAS: het−/− n = 45; CTR n = 71. In blue = DAPI cell nuclei staining; red = α-Bungarotoxin (BTx)-labelled AChRs; green = Homer proteins. Magnification scale bar = 15 μm. Data were compared using unpaired Student’s t-test and/or Mann–Whitney test and considered statistic significant at p ≤ 0.05.
Figure 3
Figure 3
nAChRs fluorescence intensity analysis at the NMJ. (a) SOL muscle; (b) GAS muscle. The graphic shows the mean value of the fluorophore-conjugated BTx signal, marking the nAChRs at the postsynaptic domain of the NMJ of CTR (gray column) and het−/− (black column). The number of NMJs analyzed: SOL het−/− n = 177; CTR n = 52; GAS het−/− n = 124; CTR n = 77.
Figure 4
Figure 4
Homer specific isoforms transcripts expression analysis by qPCR. (a) SOL muscle; (b) GAS muscle. Graphs represent the relative expression of Homer-isoform-specific mRNA to the housekeeping gene HPRT1 in the SOL and GAS muscles, respectively. In the GAS muscle, the dominating Homer isoform is the long Homer 1b/c, whereas in the SOL, it is Homer 2a/b. H1a = Homer 1a; H1b/c = Homer 1b/c; H2a/b = Homer 2a/b.
Figure 5
Figure 5
Myofiber cross-sectional area analysis in het−/− vs. CTR skeletal muscle. (a) Graphic represents the CSA of the myofibers in the SOL muscle (het−/− n = 542 + 775; CTR n = 306 + 545 type I and type II fibers, respectively); (b) Graphic represents the myofiber phenotype composition of the SOL muscle; (c) Graphic represents the CSA of the myofibers in the GAS muscle (het−/− n = 976; CTR n = 865; myofibers from six animals/group). The gastrocnemius muscle is comprised of more than 90% type II myofibers; therefore, type I fiber morphological analysis was omitted. (d) Representative images from the SOL muscle cross sections in the CTR and het−/− groups, respectively. Dystrophin membrane marker (blue label); type II fast-twitch myofibers (green label); type I slow-twitch myofibers (red label). Magnifican scale bar = 150 μm.

Similar articles

References

    1. Angelaki D.E., Cullen K.E. Vestibular system: The many facets of a multimodal sense. Annu. Rev. Neurosci. 2008;31:125–150. doi: 10.1146/annurev.neuro.31.060407.125555. - DOI - PubMed
    1. Brosel S., Strupp M. The Vestibular System and Ageing. Subcell. Biochem. 2019;91:195–225. - PubMed
    1. Grillner S., Hongo T., Lund S. The vestibulospinal tract. Effects on alpha-motoneurones in the lumbosacral spinal cord in the cat. Exp. Brain Res. 1970;10:94–120. doi: 10.1007/BF00340521. - DOI - PubMed
    1. Curthoys I.S., Grant J.W., Burgess A.M., Pastras C.J., Brown D.J., Manzari L. Otolithic Receptor Mechanisms for Vestibular-Evoked Myogenic Potentials: A Review. Front. Neurol. 2018;9:366. doi: 10.3389/fneur.2018.00366. - DOI - PMC - PubMed
    1. Kasri M., Picquet F., Falempin M. Effects of unilateral and bilateral labyrinthectomy on rat postural muscle properties: The soleus. Exp. Neurol. 2004;185:143–153. doi: 10.1016/j.expneurol.2003.09.006. - DOI - PubMed

Substances

LinkOut - more resources