. 2024 Aug 8;25(16):8659.
doi: 10.3390/ijms25168659.

Computational Analyses Reveal Deregulated Clock Genes Associated with Breast Cancer Development in Night Shift Workers

Affiliations

Computational Analyses Reveal Deregulated Clock Genes Associated with Breast Cancer Development in Night Shift Workers

Silvia Vivarelli et al. Int J Mol Sci. .

Abstract

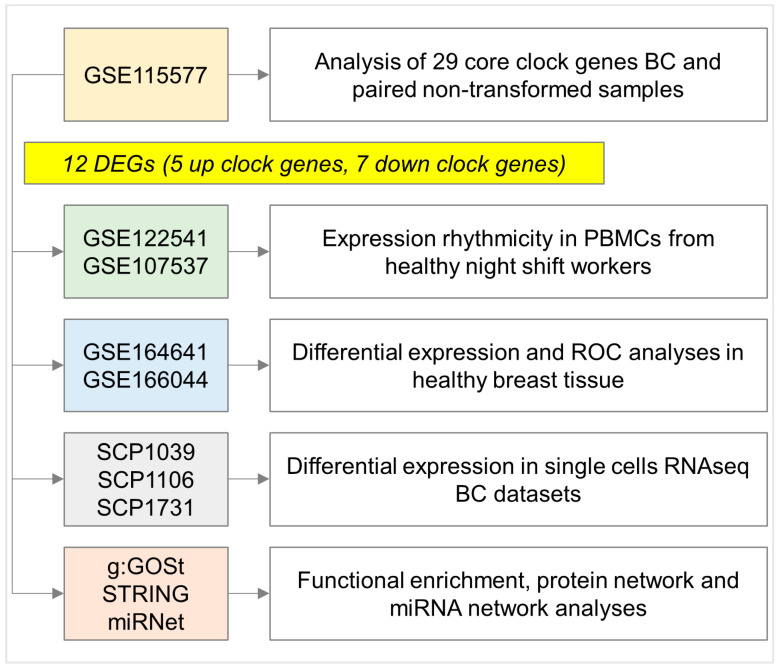
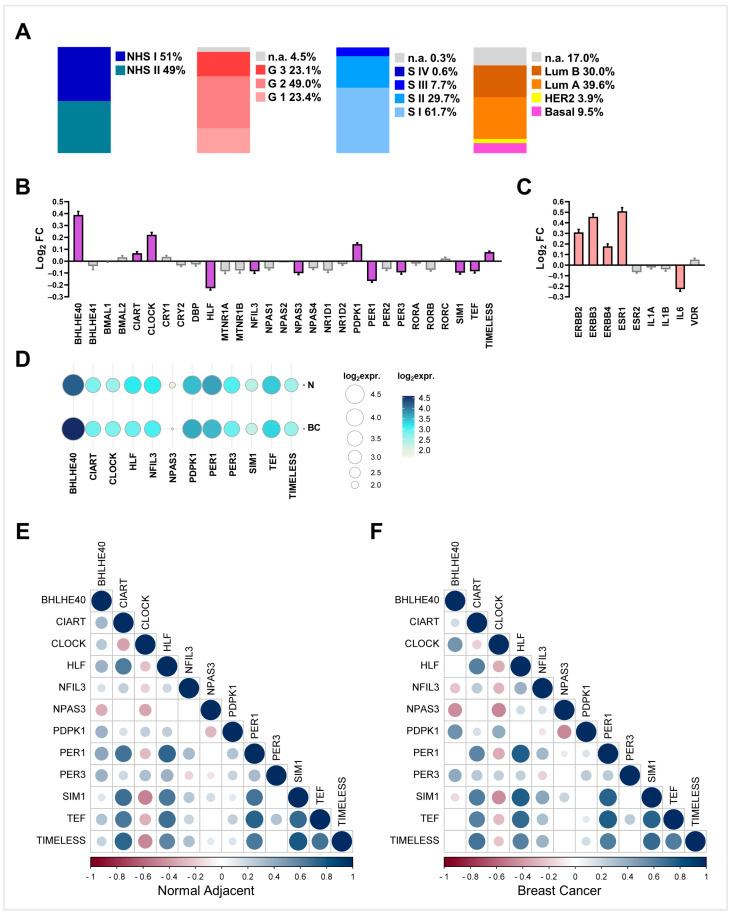
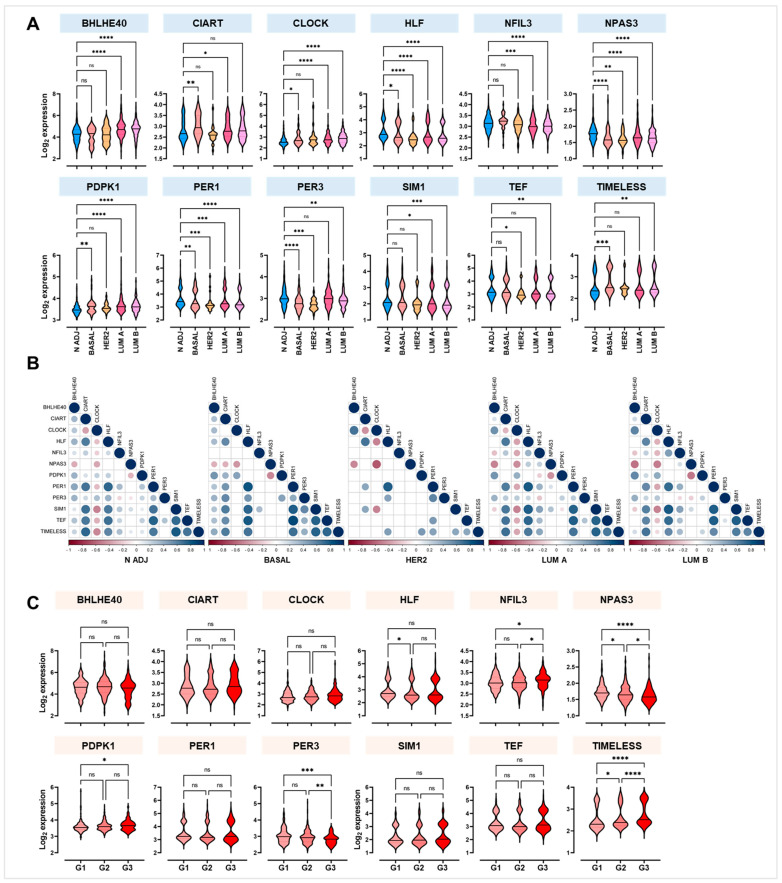
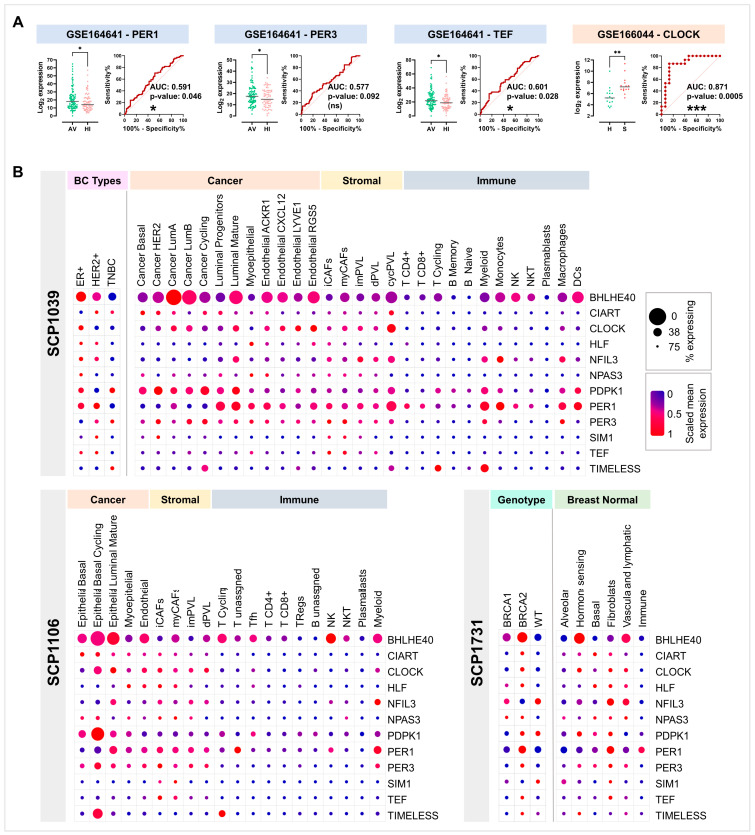
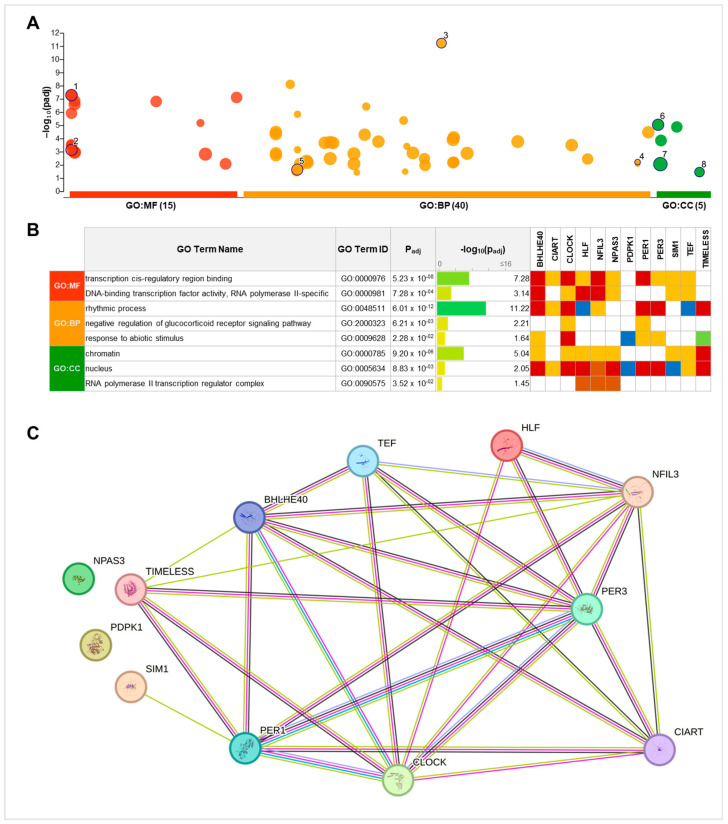
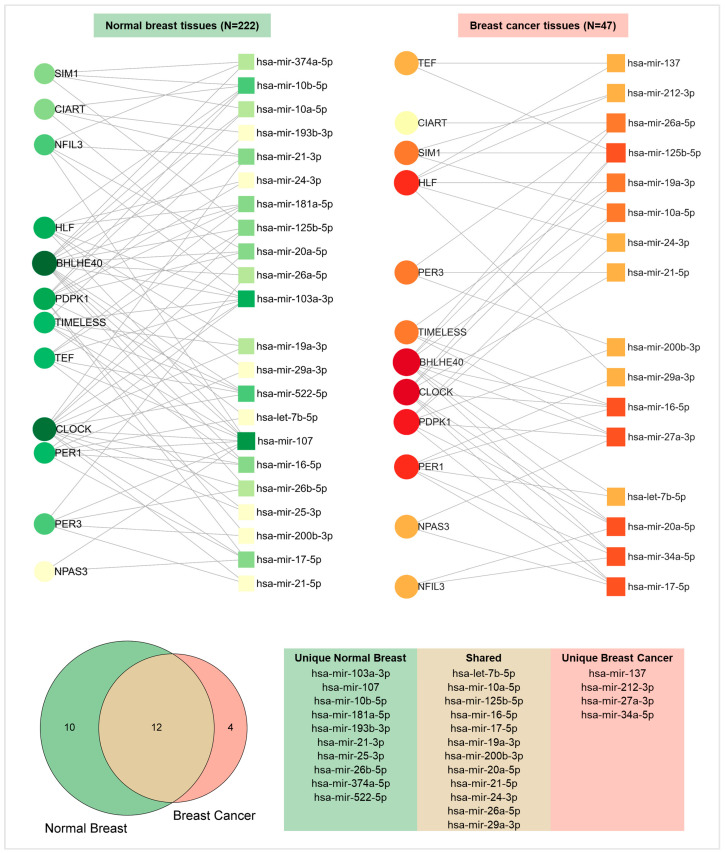
Breast cancer (BC) is the leading cause of cancer death among women worldwide. Women employed in shift jobs face heightened BC risk due to prolonged exposure to night shift work (NSW), classified as potentially carcinogenic by the International Agency for Research on Cancer (IARC). This risk is linked to disruptions in circadian rhythms governed by clock genes at the cellular level. However, the molecular mechanisms are unclear. This study aimed to assess clock genes as potential BC biomarkers among women exposed to long-term NSW. Clock gene expression was analysed in paired BC and normal breast tissues within Nurses' Health Studies I and II GEO datasets. Validation was performed on additional gene expression datasets from healthy night shift workers and women with varying BC susceptibility, as well as single-cell sequencing datasets. Post-transcriptional regulators of clock genes were identified through miRNA analyses. Significant alterations in clock gene expression in BC compared to normal tissues were found. BHLHE40, CIART, CLOCK, PDPK1, and TIMELESS were over-expressed, while HLF, NFIL3, NPAS3, PER1, PER3, SIM1, and TEF were under-expressed. The downregulation of PER1 and TEF and upregulation of CLOCK correlated with increased BC risk in healthy women. Also, twenty-six miRNAs, including miR-10a, miR-21, miR-107, and miR-34, were identified as potential post-transcriptional regulators influenced by NSW. In conclusion, a panel of clock genes and circadian miRNAs are suggested as BC susceptibility biomarkers among night shift workers, supporting implications for risk stratification and early detection strategies.

Keywords: biomarkers; breast cancer; circadian rhythms; clock genes; computational study; micro-RNAs; night shift work.


Conflict of interest statement

The authors declare no conflicts of interest.

Figures

Figure 1
Figure 1
Flow chart of this study. DEGs, differentially expressed genes. GSE, gene set enrichment. PBMCs, peripheral blood mononuclear cells. ROC, receiver operating characteristic curve. BC, breast cancer. g: GOSt, functional enrichment from g: Profiler. STRING, protein–protein association networks. miRNet, miRNA network visual analytics platform.
Figure 2
Figure 2
NHS cohort statistics and significantly deregulated clock genes and BC genes in GSE115577. (A) Stacked bar graphs illustrating percentage frequencies for the following stratifications: NHS cohorts I vs. II, grade, stage, and IHC BC types; (B) differential expressions of analysed core clock genes expressed as fold differences (Log2FC). Purple colour bars indicate significant values, grey bars not significant; (C) differential expressions of pivotal BC genes expressed as fold differences (Log2FC). Pink colour bars indicate significant values, grey bars not significant; (D) relative expression of significantly deregulated clock genes. The size and colour of the circles indicate the expression level (mean log2 expression value); (E,F) correlograms of Spearman correlations between deregulated core clock genes in adjacent non-cancerous breast tissue (E, n = 623) and BC tissue (F, n = 623). Blue colour indicates positive correlations (rho values > 1), while red colour indicates negative correlations (rho values < 1). Only significant correlations with p value ≥ 0.05 are reported.
Figure 3
Figure 3
Stratification of significantly deregulated clock genes in GSE115577 based on major molecular types and tumour grade. (A) Violin plots with median of 12 significantly deregulated clock genes (only paired cancerous and non-cancerous samples with known IHC phenotypes were considered in this analysis) based on BC molecular subtype. Samples are divided into normal adjacent (N ADJ, n = 517), basal (n = 59), HER2-positive (HER2, n = 24), Luminal A (LUM A, n = 247), and Luminal B (LUM B, n = 187). (B) Correlograms of Spearman correlations between deregulated core clock genes in N ADJ, BASAL, HER2, LUM A, and LUM B (from left to right). Blue colour indicates positive correlations (rho values > 1), while red colour indicates negative correlations (rho values < 1). Only significant correlations with p value ≥ 0.05 are reported. (C) Violin plots with median of 12 significantly deregulated clock genes in BC samples stratified based on their grade from 1 to 3 (G1, n = 146; G2, n = 305; G3, n = 144). * p < 0.05; ** p < 0.01; *** p < 0.001; **** p < 0.0001; ns = not significant.
Figure 4
Figure 4
Clock gene expression in BC-susceptible subjects and single-cell RNA datasets of cancerous and non-cancerous human breast tissues. (A) Gene expression of significantly deregulated clock transcripts in breast tissue from healthy women with different degrees of risk of developing BC (GSE164641) or from healthy women that never developed BC or developed it years later (GSE166044). Dot plots with median log2 expression (left) and ROC analysis with AUC (right). AV, average risk of BC; HI, high risk of BC. H, healthy; S, susceptible. * p < 0.05; ** p < 0.01. (B) Selected clock gene expression in single-cell RNA datasets: dot plots with relative gene expression. The diameter of the dots is proportional to the number of cells expressing the gene, and the colour of the dots is proportional to the scaled mean expression (from blue to red). SCP1039 (100,064 cells from primary untreated BC biopsies), SCP1106 (24,271 cells from triple-negative BC biopsies), and SCP1731 (52,681 cells from healthy breast biopsies). * p < 0.05; *** p < 0.001; ns = not significant.
Figure 5
Figure 5
g: GOSt functional network analysis of differentially expressed clock genes in GSE115577. (A) g: GOSt multi-query Manhattan plot; X-axis shows the functional terms grouped and colour-coded by data source, and Y-axis shows the −log10 value of p-adjusted values. Highlighted driver GO terms are numbered from 1 to 8. (B) Table summarizing multi-query results with significant p-adjusted values and genes involved for 8 driver GO terms (square colours for different evidence; red: inferred from experiment, yellow: sequence or structural similarity, brown: genetic or physical interaction, blue: reviewed computational analysis, green: inferred by curator). MF, molecular function; BP, biological process; CC, cellular component; (C) STRING plot, with edges representing protein–protein associations (light green line indicates association through text mining, black line indicates interaction due to co-expression, light purple line indicates protein homology, deep purple line indicates known interaction experimentally determined, light blue line indicates known interaction from curated databases).
Figure 6
Figure 6
miRNet miRNA–target interaction network of differentially expressed clock genes in normal breast and breast cancer tissues. Upper left: network plot highlighting the interactions (grey nodes) between 12 clock genes and 22 miRNAs in normal breast samples. Upper right: network plot highlighting the interactions (grey nodes) between 12 clock genes and 16 miRNAs in BC samples. Lower left: Venn diagram showing intersections between miRNet queries. Lower right: list of miRNA post-transcriptional regulators of clock genes in three Venn subgroups (unique normal breast, shared, unique BC).

Similar articles

Cited by

References

    1. Bray F., Laversanne M., Sung H., Ferlay J., Siegel R.L., Soerjomataram I., Jemal A. Global Cancer Statistics 2022: GLOBOCAN Estimates of Incidence and Mortality Worldwide for 36 Cancers in 185 Countries. CA. Cancer J. Clin. 2024;74:229–263. doi: 10.3322/caac.21834. - DOI - PubMed
    1. Santucci C., Mignozzi S., Malvezzi M., Boffetta P., Collatuzzo G., Levi F., La Vecchia C., Negri E. European Cancer Mortality Predictions for the Year 2024 with Focus on Colorectal Cancer. Ann. Oncol. 2024;35:308–316. doi: 10.1016/j.annonc.2023.12.003. - DOI - PubMed
    1. Oncology T.L. The Lancet Oncology Curbing the Climb in Cancer Incidence. Lancet Oncol. 2024;25:529. doi: 10.1016/S1470-2045(24)00217-1. - DOI - PubMed
    1. Obeagu E.I., Obeagu G.U. Breast Cancer: A Review of Risk Factors and Diagnosis. Medicine. 2024;103:e36905. doi: 10.1097/MD.0000000000036905. - DOI - PMC - PubMed
    1. Fenga C. Occupational Exposure and Risk of Breast Cancer. Biomed. Rep. 2016;4:282–292. doi: 10.3892/br.2016.575. - DOI - PMC - PubMed

LinkOut - more resources