Review
. 2024 Aug 8;25(16):8660.
doi: 10.3390/ijms25168660.

Trajectory Analysis in Single-Particle Tracking: From Mean Squared Displacement to Machine Learning Approaches

Affiliations
Review

Trajectory Analysis in Single-Particle Tracking: From Mean Squared Displacement to Machine Learning Approaches

Chiara Schirripa Spagnolo et al. Int J Mol Sci. .

Abstract

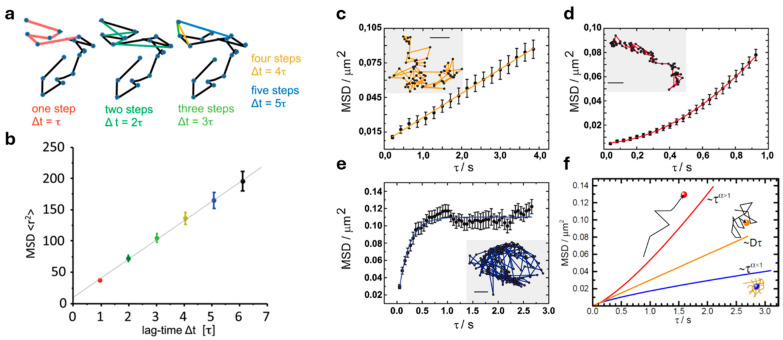
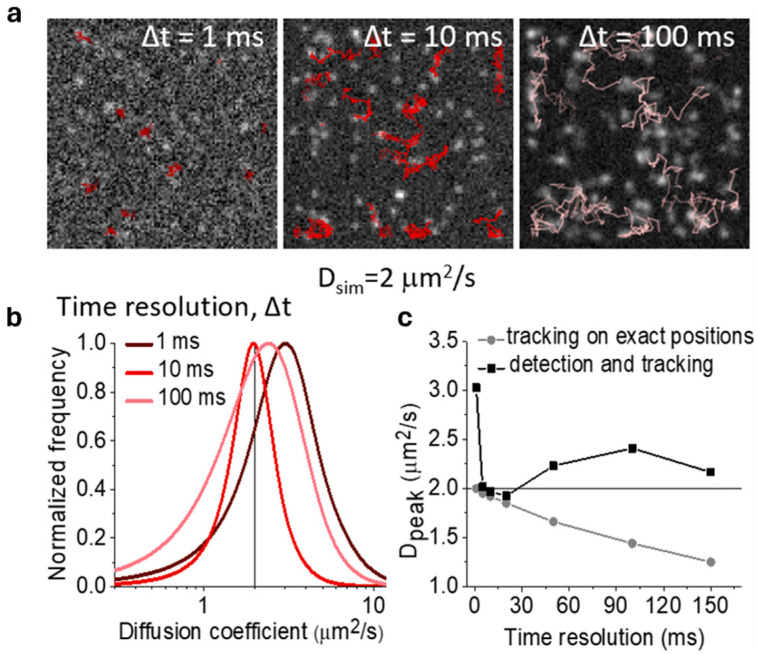
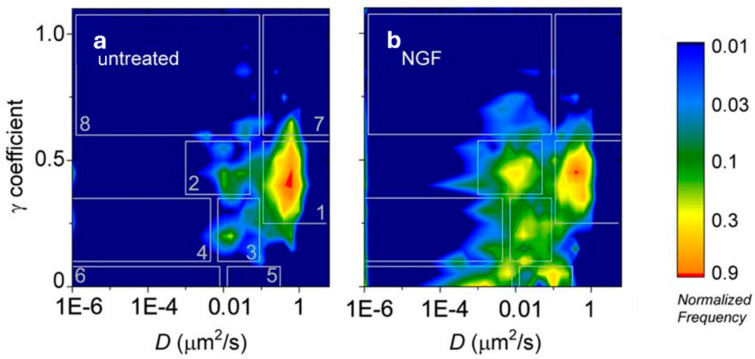
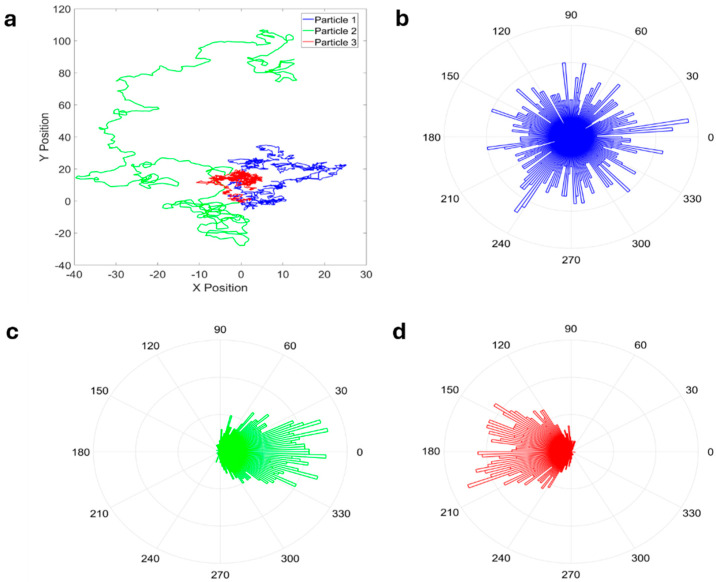
Single-particle tracking is a powerful technique to investigate the motion of molecules or particles. Here, we review the methods for analyzing the reconstructed trajectories, a fundamental step for deciphering the underlying mechanisms driving the motion. First, we review the traditional analysis based on the mean squared displacement (MSD), highlighting the sometimes-neglected factors potentially affecting the accuracy of the results. We then report methods that exploit the distribution of parameters other than displacements, e.g., angles, velocities, and times and probabilities of reaching a target, discussing how they are more sensitive in characterizing heterogeneities and transient behaviors masked in the MSD analysis. Hidden Markov Models are also used for this purpose, and these allow for the identification of different states, their populations and the switching kinetics. Finally, we discuss a rapidly expanding field-trajectory analysis based on machine learning. Various approaches, from random forest to deep learning, are used to classify trajectory motions, which can be identified by motion models or by model-free sets of trajectory features, either previously defined or automatically identified by the algorithms. We also review free software available for some of the analysis methods. We emphasize that approaches based on a combination of the different methods, including classical statistics and machine learning, may be the way to obtain the most informative and accurate results.

Keywords: hidden Markov models; machine learning in biology; molecular diffusion; molecular trajectory statistics; moment scaling spectrum; particle dynamics; quantitative biology; quantitative microscopy; single molecule tracking; single-molecule analysis.


Conflict of interest statement

The authors declare no conflicts of interest.

Figures

Figure 1
Figure 1
Mean Squared Displacement (MSD) analysis. (a) Different numbers of steps (different time lags) are considered for the MSD calculation. (b) The average of all displacements with the same time lag gives a point in the MSD curve. (ce) The plot of MSD versus the time lag (τ) allows the classification of the type of motion for the trajectories (in the insets) showing Brownian (c), drifted (d), and confined (e) motion. (f) Examples of MSD behavior for superdiffusive (red line) and subdiffusive (blue line) “anomalous” motion, compared with the one for a Brownian trajectory (orange line). Bar in (ce) insets: 0.16 μm. Panels (a,b) are adapted with permission from [3] © 2011 The American Society of Gene and Cell Therapy, published by Elsevier Inc. Panels (ce) are adapted with permission from [18] © 2011 Elsevier B.V.
Figure 2
Figure 2
Effects of time resolution on estimates of diffusion coefficient by MSD analysis. (a) Movies of single molecules diffusing with Brownian motion are simulated with a diffusion coefficient of 2 μm2/s at different time resolutions Δt; we show the first frame of each movie and some of the reconstructed trajectories. (b) The histogram shows the distributions (normalized to 1 at the peak) of the short-term diffusion coefficients estimated from the first two points of the MSD function using three different time resolutions. Data were obtained by detection and tracking on simulated movies. (c) The peak of the estimated distribution of the short-term diffusion coefficient (Dpeak) is shown at different time resolutions. Data were obtained by detection and tracking on simulated movies (black, including static and dynamic localization errors and tracking errors) and by tracking on exact simulated positions (grey, including tracking errors only). See [53] for more details and examples.
Figure 3
Figure 3
Bidimensional histograms of the γ coefficient (from the MSS analysis) versus the short-term diffusion coefficient D (from the MSD analysis) measured by SPT for the TrkA receptor (unstimulated in (a), stimulated by the nerve growth factor, NGF, in (b)). White rectangles numbered from 1 to 8 correspond to the different identified dynamic regions [23]. On the right the color bar shows the frequency of the total D-γ distributions in logarithmic scale and normalized to 1 at the peak. Reproduced with permission from [23] (© 2013 The Company of Biologists Ltd.), permission conveyed through Copyright Clearance Center, Inc.
Figure 4
Figure 4
(a) The trajectories of three particles are shown as examples in blue, green, and red. Panels (bd) show the radial histograms obtained by calculating the angular displacement between each successive time step: the angle is reported along the azimuthal axis, the frequency for that angle is reported along the radial direction. In (b), the particle has no angular preferences, typical of Brownian motion; in (c), the particle tends not to change direction (angular distribution center close to 0°); in (d), the particle tends to move in the opposite direction for each time point (angular distribution center close to 180°). Reproduced with permission from [14] (© 2019 John Wiley and Sons, Inc.), permission conveyed through Copyright Clearance Center, Inc.
Figure 5
Figure 5
Variational Bayes SPT (vbSPT) software applied to simulated data. (a) Top: simulation of a smaller region with lower diffusion coefficient within a larger area with higher diffusion coefficient. Bottom: results of the vbSPT analysis that identified two states described by the indicated parameters of diffusion coefficient (D), mean lifetime (τ) and transition probabilities during one time step (0.02, 0.10). (b) A single state is correctly identified by vbSPT for a homogeneous region with a single diffusion coefficient. (c) (Top): simulation of a region with a continuously increasing diffusion coefficient along the axis. (Bottom): results of the vbSPT analysis that identify three states with the indicated parameters. Reproduced with permission from [118] (©2013 Nature America, Inc.), permission conveyed through Copyright Clearance Center, Inc.
Figure 6
Figure 6
Workflow of trajectory classification by supervised machine learning. A training set of labelled trajectories is used to train the model. The trained model is then used to classify unlabeled (unseen) data. Preprocessing can consist of extracting relevant features. Reproduced with permission from [127]. Copyright (2020) by The American Physical Society.
Figure 7
Figure 7
Workflow of DiffusionLab trajectory analysis. (1) Trajectories are imported; (2) a set of trajectory properties is calculated; (3) a classification model is constructed either manually (3a) or by machine learning (3b); (4) trajectories are classified with the constructed classification model and pooled into populations with similar behavior; (5) MSD analysis is performed. Reproduced with permission from [91] © The Author(s) 2022.
Figure 8
Figure 8
Sketch of the architecture of a convolutional neural network (CNN). The hidden layers automatically extract relevant features from the trajectories; they include convolutional layers (which apply convolution operations to the input data to extract local features and capture spatial hierarchies) and pooling layers (which reduce the spatial dimensions of the feature maps and thus help in reducing the number of parameters and the computational complexity and in controlling overfitting, retaining the most important information while discarding non-essential details). The extracted features are used by the successive classification part of the algorithm based on fully connected layers in which each neuron in a layer is connected to every neuron in the previous layer, allowing the network to combine the extracted features. Reproduced with permission from [136]. Copyright (2019) by The American Physical Society.

Similar articles

References

    1. Wang Z., Wang X., Zhang Y., Xu W., Han X. Principles and Applications of Single Particle Tracking in Cell Research. Small. 2021;17:2005133. doi: 10.1002/smll.202005133. - DOI - PubMed
    1. Marchetti L., Bonsignore F., Gobbo F., Amodeo R., Calvello M., Jacob A., Signore G., Schirripa Spagnolo C., Porciani D., Mainardi M., et al. Fast-Diffusing P75 NTR Monomers Support Apoptosis and Growth Cone Collapse by Neurotrophin Ligands. Proc. Natl. Acad. Sci. USA. 2019;116:21563–21572. doi: 10.1073/pnas.1902790116. - DOI - PMC - PubMed
    1. Ruthardt N., Lamb D.C., Bräuchle C. Single-Particle Tracking as a Quantitative Microscopy-Based Approach to Unravel Cell Entry Mechanisms of Viruses and Pharmaceutical Nanoparticles. Mol. Ther. 2011;19:1199–1211. doi: 10.1038/mt.2011.102. - DOI - PMC - PubMed
    1. Marchetti L., Luin S., Bonsignore F., de Nadai T., Beltram F., Cattaneo A. Ligand-Induced Dynamics of Neurotrophin Receptors Investigated by Single-Molecule Imaging Approaches. Int. J. Mol. Sci. 2015;16:1949–1979. doi: 10.3390/ijms16011949. - DOI - PMC - PubMed
    1. Schirripa Spagnolo C., Moscardini A., Amodeo R., Beltram F., Luin S. Optimized Two-Color Single-Molecule Tracking of Fast-Diffusing Membrane Receptors. Adv. Opt. Mater. 2023;12:2302012. doi: 10.1002/adom.202302012. - DOI

LinkOut - more resources