. 2024 Aug 8;25(16):8657.
doi: 10.3390/ijms25168657.

Functional Characterization of Splice Variants in the Diagnosis of Albinism

Affiliations

Functional Characterization of Splice Variants in the Diagnosis of Albinism

Modibo Diallo et al. Int J Mol Sci. .

Abstract

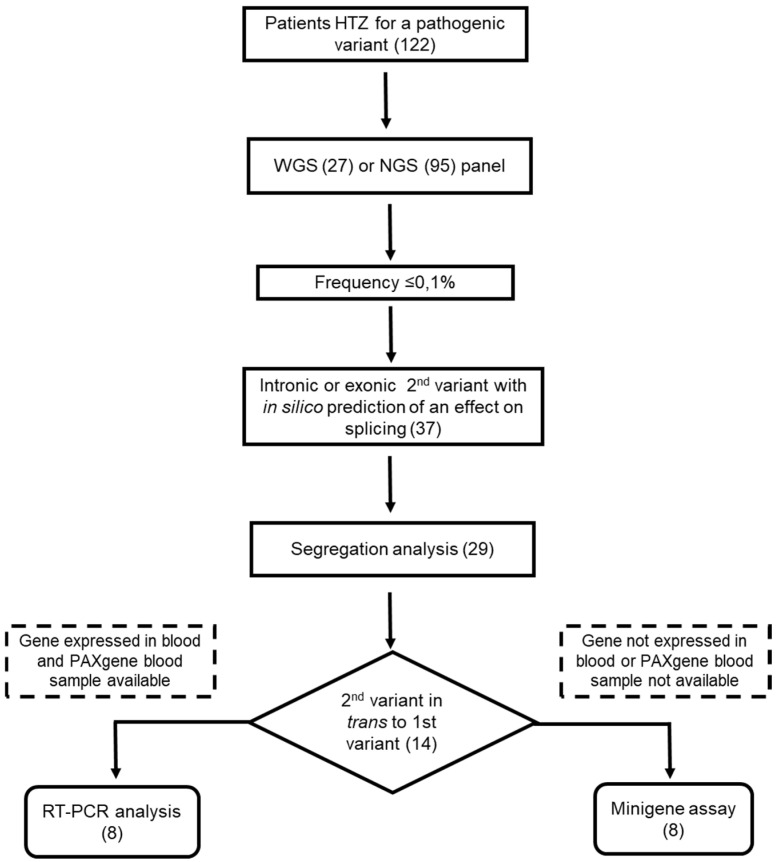
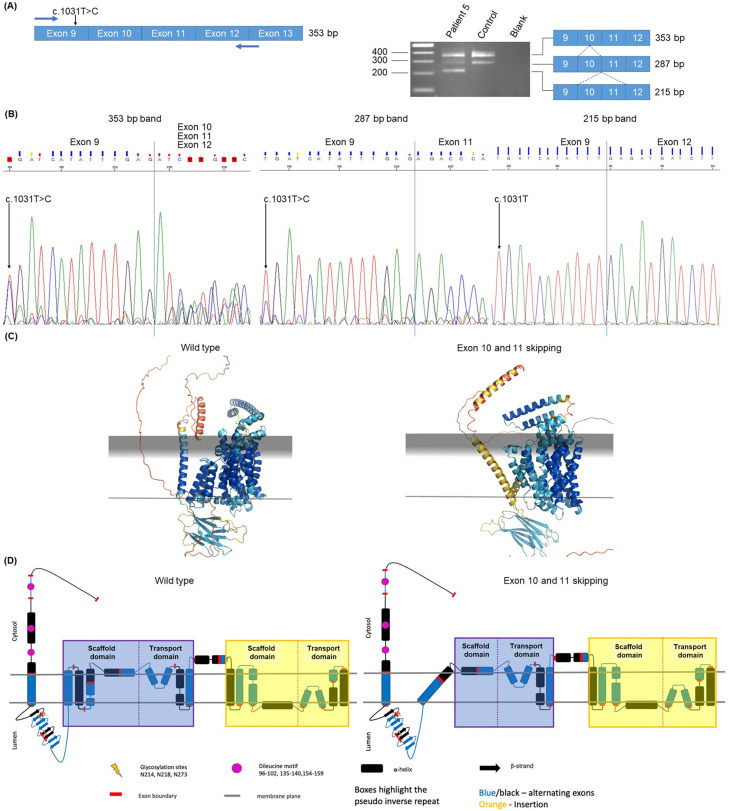
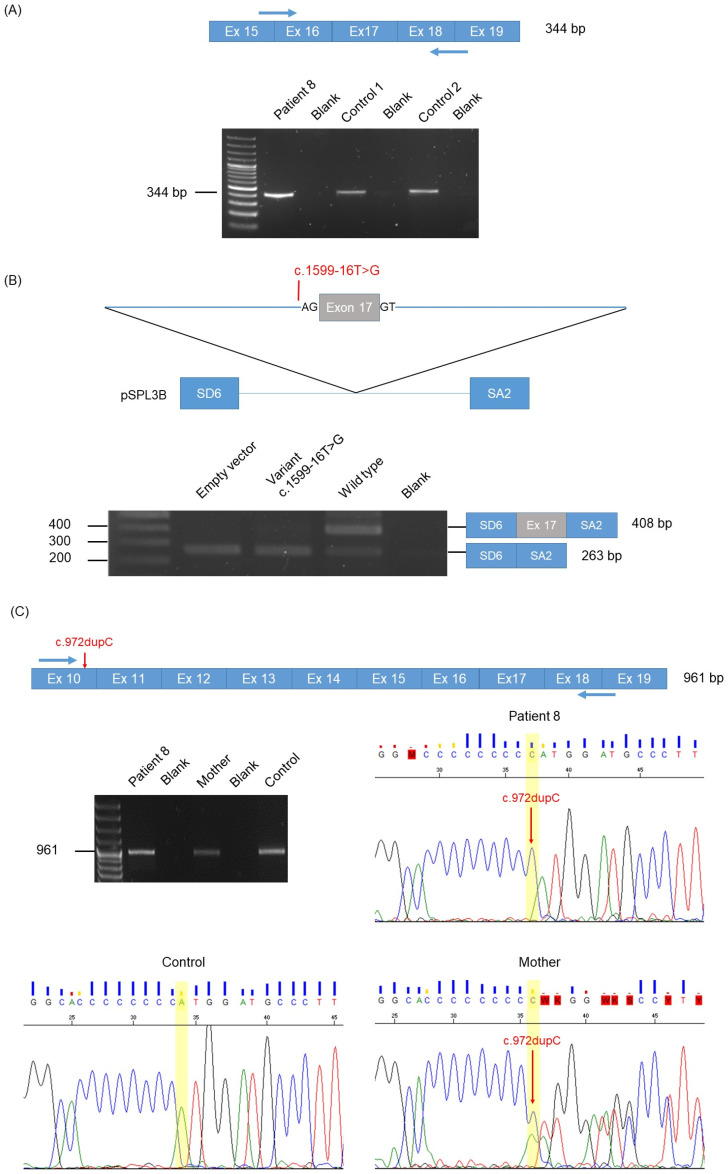
Albinism is a genetically heterogeneous disease in which 21 genes are known so far. Its inheritance mode is autosomal recessive except for one X-linked form. The molecular analysis of exonic sequences of these genes allows for about a 70% diagnostic rate. About half (15%) of the unsolved cases are heterozygous for one pathogenic or probably pathogenic variant. Assuming that the missing variant may be located in non-coding regions, we performed sequencing for 122 such heterozygous patients of either the whole genome (27 patients) or our NGS panel (95 patients) that includes, in addition to all exons of the 21 genes, the introns and flanking sequences of five genes, TYR, OCA2, SLC45A2, GPR143 and HPS1. Rare variants (MAF < 0.01) in trans to the first variant were tested by RT-PCR and/or minigene assay. Of the 14 variants tested, nine caused either exon skipping or the inclusion of a pseudoexon, allowing for the diagnosis of 11 patients. This represents 9.8% (12/122) supplementary diagnosis for formerly unsolved patients and 75% (12/16) of those in whom the candidate variant was in trans to the first variant. Of note, one missense variant was demonstrated to cause skipping of the exon in which it is located, thus shedding new light on its pathogenic mechanism. Searching for non-coding variants and testing them for an effect on RNA splicing is warranted in order to increase the diagnostic rate.

Keywords: RT-PCR; albinism; exon skipping; minigene assay; pseudoexon; splice variants.


Conflict of interest statement

The authors declare no conflicts of interest.

Figures

Figure 3
Figure 3
Minigene assay of patient 2 OCA2 variant c.2080-158A>G. (A) Schematic representation of the minigene construct in the vector pSPL3B to test variant c.2080-158A>G. A 727 bp long genomic segment encompassing 646 bp of intron 19 including the variant (in red) and putative pseudoexon (PE 123 bp) as well as exon 20 and 81 bp of intron 20 was cloned in the pSPL3B intron between vector exons SD6 and SA2. Consensus splice site AG and GT dinucleotides at the border of the pseudoexon are underlined. (B) Schematic representations of the 323 bp RT-PCR product expected in the absence of inclusion of the pseudoexon and of the 446 bp product expected if the pseudoexon is included. The agarose gel on the right shows the RT-PCR products obtained with the empty vector with the wild-type (WT) insert and the insert carrying the variant (Var). Size marker is a 1 kb ladder. (C) Sanger sequencing shows that the WT insert-derived 323 bp RT-PCR product contains only exon 20, and that the variant insert-derived 446 bp RT-PCR product contains exon 20 and the pseudoexon. Vertical blue bars indicate the junctions between exons. (D) AlphaFold2 [16] generated OCA2 models. Wild type on the left and variant on the right. Colored by pLDDT (predicted Local Distance Difference Test); blue (high) to red (low)—pLDDT score is a measure of confidence in the predicted structure of a protein. The score ranges from 0 to 100 with higher scores indicating higher confidence in the accuracy of the predicted structure for a particular region of the protein. Gray planes represent membrane boundaries and their positions predicted by the OPM server [17]. (E) OCA2 topology: wild type on the left and variant on the right. Wild-type topology adapted from [15] with minor revisions based on new data.
Figure 1
Figure 1
Flowchart of the analytical process. Numbers in parentheses indicate the number of patients, of variants, or of experiments performed.
Figure 2
Figure 2
RT-PCR analysis of patient 1 OCA2 variant c.2433-22889T>A. (A) Schematic representation of the genomic region encompassing exon 23 through to exon 24, showing the predicted 159 bp pseudoexon (PE). The c.2433-22889T>A variant is indicated in red. Key intronic nucleotides at consensus splice sites are indicated. (B) Schematic representation of the design of the two RT-PCR reactions performed, one extending from exon 21 to the predicted pseudoexon, and one extending from the predicted pseudoexon to exon 24. Primers are indicated by arrows. Sizes of the predicted RT-PCR products are indicated on the right. (C) Agarose gels showing the RT-PCR products obtained in the patient and in a control individual without albinism. Sizes of the expected bands in the case of pseudoexon inclusion in the patient are indicated for both RT-PCR reactions. Size marker is a 1 kb ladder. (D) Sanger sequences showing the nucleotides at the junction of exon 23 and the 159 bp pseudoexon on the left and at the junction of the 159 bp pseudoexon and exon 24 on the right. Vertical blue bars show where the junctions are.
Figure 4
Figure 4
Functional analysis of variants in patients 3, 4, 6 and 7. (A) Minigene assay of patient 3 OCA2 variant c.1951+1215G>T; p? Schematic representations (left) of the 263 bp RT-PCR product expected in the absence of inclusion of the pseudoexon and of the 340 bp product expected if the 77 bp pseudoexon is included. The agarose gel (middle) shows the RT-PCR products obtained with the empty vector with the wild-type (WT) insert and the insert carrying the variant (Var). Size marker is a 1 kb ladder. Sanger sequencing (right) shows that the variant insert-derived 340 bp RT-PCR product contains the 77 bp pseudoexon. Vertical blue bars indicate the junctions between vector-derived exons and the pseudoexon. (B) RT-PCR analysis of OCA2 patient 4 variant c.1857C>T; p.Asp619=. Schematic representations (left) of the 648 bp RT-PCR product in the absence of inclusion of the pseudoexon and of the 725 bp product when the 77 bp pseudoexon is included. Arrows indicate the RT-PCR primers. The agarose gel (middle) shows the 725 bp RT-PCR products in the patient and the 648 bp product in a control individual without albinism. The size marker is a 1 kb ladder. Sanger sequencing (right) shows the inclusion of the 77 bp pseudoexon between exons 18 and 19. Vertical blue bars indicate the junctions between the exons and the pseudoexon. The red star indicates the c.1857C>T variant in exon 18, demonstrating that this sequence corresponds to the variant allele. (C) RT-PCR analysis of patient 6 SLC45A2 variant c.1157-765C>G. Schematic representations and sizes of the expected RT-PCR products resulting from inclusion of the 275 bp pseudoexon using either a exon 5 and a pseudoexon-derived primer or a pseudoexon-derived primer and one located at the junction between exons 6 and 7. Agarose gels display the RT-PCR products obtained for each PCR in the patient and a control individual without albinism. Sizes of the pseudoexon containing bands are indicated in bp. Sanger sequences of part of the exon 5—PE and PE—exon 6/7 RT-PCR products amplified in the patient are shown, focusing on the junctions between exon 5 and PE and PE and exon 6, respectively, thus proving inclusion of the 275 bp PE. The STOP codon created by the inclusion of the pseudoexon (see main text) is indicated. Vertical blue bars indicate the junctions between the exons and the pseudoexon. (D,E) Minigene assays of patient 7 TYRP1 variants c.415G>A; p.(Glu139Lys) and c.913+2T>G; p?, respectively. Schematic representations (left) of the expected RT-PCR products corresponding to WT (exon retention) and variant (exon skipping). Sizes of the different products are indicated. Agarose gels (middle) show the RT-PCR products obtained with the empty vector with the wild type (WT) inserts and the insert carrying the variants (Var). Size marker is a 1 kb ladder. Sizes of the observed RT-PCR products are indicated. Sanger sequencing (right) shows exon retention and skipping with the wild type and the variant-carrying constructs, respectively. Vertical blue bars indicate the junctions between vector- and/or insert-derived exons.
Figure 5
Figure 5
RT-PCR analysis of patient 5 OCA2 variant c.1117-17T>C. (A) Schematic representation of part of the mRNA encompassing exons 9 to 13 (left). Blue arrows represent the RT-PCR primers. The expected correctly spliced 353 bp RT-PCR product is indicated. The c.1031T>C variant (presumably inherited from the mother, see main text) is shown. The agarose gel (right) shows the RT-PCR products obtained in the patient and in a control individual without albinism. The content of the different bands observed is schematized, and sizes are indicated. Size marker is a 1 kb ladder. (B) Sanger sequences of part of the 353, 287 and 215 bp bands showing the nucleotides at the junctions between the different exons as indicated for each sequence. Vertical blue bars show where the junctions are. Presence of both C and T or only T at the position of variant c.1031T>C is shown in each sequence. (C) AlphaFold2 [16] generated OCA2 models. Wild type on the left and variant on the right. Colored by pLDDT (predicted Local Distance Difference Test); blue (high) to red (low)—pLDDT score is a measure of confidence in the predicted structure of a protein. The score ranges from 0 to 100 with higher scores indicating higher confidence in the accuracy of the predicted structure for a particular region of the protein. Gray planes represent membrane boundaries and their positions predicted by the OPM server [17]. (D) OCA2 topology: wild type on the left and variant on the right. Wild-type topology adapted from [15] with minor revisions based on new data.
Figure 6
Figure 6
Functional analysis of patient 8 HPS1 variant c.1599-16T>G. (A) RT-PCR analysis between exons 15 and 19. Schematic representation of part of the HPS1 mRNA encompassing exons 15 to 19. Blue arrows represent the RT-PCR primers. The correctly spliced 344 bp RT-PCR product is indicated. The agarose gel shows the 344 bp product obtained in patient 8 and in 2 control individuals without albinism. Size marker is a 1 kb ladder. (B) Minigene assay. Schematic representation of the minigene construct in the vector pSPL3B, displaying HPS1 exon 17 and variant c.1599-16T>G indicated in red. The agarose gel shows the RT-PCR products obtained with the empty vector with the wild-type insert and the insert carrying the variant. Only the 263 bp product is seen with the variant construct, indicating total exon 17 skipping. The 408 bp product retaining exon 17 is seen in the wild type. Size marker is a 1 kb ladder (bands at 200, 300 and 400 bp are indicated). (C) RT-PCR analysis between exons 10 and 19. Schematic representation of part of the HPS1 mRNA encompassing exons 10 to 19. Blue arrows represent the RT-PCR primers. The correctly spliced 961 bp RT-PCR product is indicated. The maternally inherited c.972dupC variant is in red. The agarose gel shows the 961 bp product in patient 8, his mother and a control individual without albinism. Size marker is a 1 kb ladder. Sanger sequences show that the patient’s RT-PCR product corresponds only to mRNA molecules containing the c.972dupC variant. The mother displays RT-PCR products corresponding to both the c.972dupC variant-derived and wild type-derived mRNA molecules. The control displays only the wild type RT-PCR product, as expected.

References

    1. Bakker R., Wagstaff P.E., Kruijt C.C., Emri E., van Karnebeek C.D.M., Hoffmann M.B., Brooks B.P., Boon C.J.F., Montoliu L., van Genderen M.M., et al. The retinal pigmentation pathway in human albinism: Not so black and white. Prog. Retin. Eye Res. 2022;91:101091. doi: 10.1016/j.preteyeres.2022.101091. - DOI - PubMed
    1. Lasseaux E., Neveu M.M., Fiore M., Morice-Picard F., Arveiler B. Clinical Ophthalmic Genetics and Genomics. Academic Press; Cambridge, MA, USA: 2022. [(accessed on 17 June 2024)]. Albinism; pp. 393–402. Available online: https://www.elsevier.com/books-and-journals.
    1. Lasseaux E., Plaisant C., Michaud V., Pennamen P., Trimouille A., Gaston L., Monfermé S., Lacombe D., Rooryck C., Morice-Picard F., et al. Molecular characterization of a series of 990 index patients with albinism. Pigment. Cell Melanoma Res. 2018;31:466–474. doi: 10.1111/pcmr.12688. - DOI - PubMed
    1. Richards S., Aziz N., Bale S., Bick D., Das S., Gastier-Foster J., Grody W.W., Hegde M., Lyon E., Spector E., et al. Standards and guidelines for the interpretation of sequence variants: A joint consensus recommendation of the American College of Medical Genetics and Genomics and the Association for Molecular Pathology. Genet. Med. 2015;17:405–424. doi: 10.1038/gim.2015.30. - DOI - PMC - PubMed
    1. Sarkar A., Panati K., Narala V.R. Code inside the codon: The role of synonymous mutations in regulating splicing machinery and its impact on disease. Mutat. Res. Rev. Mutat. Res. 2022;790:108444. doi: 10.1016/j.mrrev.2022.108444. - DOI - PubMed

LinkOut - more resources