. 2024 Aug 9;25(16):8704.
doi: 10.3390/ijms25168704.

Integrated Transcriptomic-Metabolomic Analysis Reveals the Effect of Different Light Intensities on Ovarian Development in Chickens

Affiliations

Integrated Transcriptomic-Metabolomic Analysis Reveals the Effect of Different Light Intensities on Ovarian Development in Chickens

Xiaoli Zhou et al. Int J Mol Sci. .

Abstract

Light is a key environmental factor regulating reproduction in avians. However, the mechanism of light intensity regulating ovarian development is still unclear. In this study, 5-week-old (5 wk) partridge broiler breeders were randomly divided into a low-light-intensity group (LL group) and a natural-light-intensity group (NL group) (n = 100). In the rearing period (5 wk to 22 wk), the light intensity of the LL group and NL group were 0.41 ± 0.05 lux and 45.39 ± 1.09 lux, and in the laying period (23 wk to 32 wk) they were 23.92 ± 0.06 lux and 66.93 ± 0.76 lux, respectively. Samples were collected on 22 wk and 32 wk. The results showed that the LL group had a later age at first egg and a longer laying period than the NL group. Serum P4 and LH levels in the LL group were higher than in the NL group on 22 wk (p < 0.05). On 32 wk, P4, E2, LH and FSH levels in the LL group were lower than in the NL group (p < 0.05). Ovarian transcriptomics and metabolomics identified 128 differentially expressed genes (DEGs) and 467 differential metabolites (DMs) on 22 wk; 155 DEGs and 531 DMs on 32 wk between two groups. An enrichment analysis of these DEGs and DMs identified key signaling pathways, including steroid hormone biosynthesis, neuroactive ligand-receptor interaction. In these pathways, genes such as CYP21A1, SSTR2, and NPY may regulate the synthesis of metabolites, including tryptamine, triglycerides, and phenylalanine. These genes and metabolites may play a dominant role in the light-intensity regulation of ovarian development and laying performance in broiler breeders.

Keywords: light intensity; metabolomics; ovarian development; partridge chicken; transcriptomics.


Conflict of interest statement

The authors declare no conflicts of interest.

Figures

Figure 1
Figure 1
Effect of different light intensities on laying performance. (A) Experimental design of this study. Two hundred 5-week-old (5 wk) partridge broiler breeders with similar body weights were selected and randomly divided into low-light-intensity group (LL group) and natural-light-intensity group (NL group) (n = 100). The light intensity of the LL group and NL group from 5 wk to 22 wk were 0.41 ± 0.05 lux and 45.39 ± 1.09 lux, respectively; and from 23 wk to 32 wk, they were 23.92 ± 0.06 lux and 66.93 ± 0.76 lux, respectively. Tissue and blood samples were collected on 22 wk and 32 wk. (B) Laying rate.
Figure 2
Figure 2
Effects of different light intensities on GSI% and numbers of follicles. (A) GSI% (GSI% = gonadal weight/body weight × 100%); (B) Number of large yellow follicles (LYFs, follicle diameter > 8 mm); (C) Number of small yellow follicles (SYFs, follicle diameter = 6–8 mm); (D) Number of white follicles (WFs, follicle diameter < 6 mm). Data are presented as the mean ± SEM, n = 10. ** indicates p < 0.01.
Figure 3
Figure 3
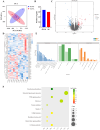
Transcriptomic analysis in ovaries under different light intensities on 22 wk. (A) PCA plot; (B) DEGs bar plot; (C) Gene volcano plot; (D) DEGs clustering heatmap; (E) DEGs GO enrichment analysis plot; (F) DEGs KEGG enrichment analysis plot.
Figure 4
Figure 4
Transcriptomic analysis in ovaries under different light intensities on 32 wk. (A) PCA plot; (B) DEGs bar plot; (C) Gene volcano plot; (D) DEGs clustering heatmap; (E) DEGs GO enrichment analysis plot; (F) DEGs KEGG enrichment analysis plot.
Figure 5
Figure 5
Metabolomic analysis in ovaries under different light intensities on 22 wk. (A) PCA plot; (B) OPLS-DA scores plot; (C) OPLS-DA model validation plot; (D) DM clustering heatmap; (E) DM bar plot; (F) metabolites’ volcano plot; (G) DM KEGG enrichment analysis plot.
Figure 6
Figure 6
Metabolomic analysis in ovaries under different light intensities on 32 wk. (A) PCA plot; (B) OPLS-DA scores plot; (C) OPLS-DA model validation plot; (D) DM clustering heatmap; (E) DM bar plot; (F) metabolites’ volcano plot; (G) DM KEGG enrichment analysis plot.
Figure 7
Figure 7
Integrated analysis of transcriptomics and metabolomics in ovaries under different light intensities. (A) Venn diagram of intersection of DEG and DM enrichment signaling pathways on 22 wk; (B) top 10 pathways of the intersection of DEG and DM enrichment signaling pathways on 22 wk; (C) Venn diagram of intersection of DEG and DM enrichment signaling pathways on 32 wk; (D) top 10 pathways of the intersection of DEG and DM enrichment signaling pathways on 32 wk.

References

    1. Aulsebrook A.E., Johnsson R.D., Lesku J.A. Light, Sleep and Performance in Diurnal Birds. Clocks Sleep. 2021;3:115–131. doi: 10.3390/clockssleep3010008. - DOI - PMC - PubMed
    1. Blatchford R.A., Archer G.S., Mench J.A. Contrast in light intensity, rather than day length, influences the behavior and health of broiler chickens. Poult. Sci. 2012;91:1768–1774. doi: 10.3382/ps.2011-02051. - DOI - PubMed
    1. Zhou X., Jiang D., Xu Y., Pan J., Xu D., Tian Y., Shen X., Huang Y. Endocrine and molecular regulation mechanisms of follicular development and egg-laying in quails under different photoperiods. Anim. Biotechnol. 2023;34:4809–4818. doi: 10.1080/10495398.2023.2196551. - DOI - PubMed
    1. Soliman E.S., Hassan R.A. Impact of lighting color and duration on productive performance and Newcastle disease vaccination efficiency in broiler chickens. Vet. World. 2019;12:1052–1059. doi: 10.14202/vetworld.2019.1052-1059. - DOI - PMC - PubMed
    1. Surbhi, Kumar V. Avian photoreceptors and their role in the regulation of daily and seasonal physiology. Gen. Comp. Endocrinol. 2015;220:13–22. doi: 10.1016/j.ygcen.2014.06.001. - DOI - PubMed

LinkOut - more resources