. 2024 Aug 10;25(16):8735.
doi: 10.3390/ijms25168735.

Understanding Secondary Sarcopenia Development in Young Adults Using Pig Model with Chronic Pancreatitis

Affiliations

Understanding Secondary Sarcopenia Development in Young Adults Using Pig Model with Chronic Pancreatitis

Ewa Tomaszewska et al. Int J Mol Sci. .

Abstract

Chronic pancreatitis (CP) in young individuals may lead to disease-related secondary sarcopenia (SSARC), characterized by muscle loss and systemic inflammation. In this study, CP was induced in young pigs, and serum levels of key hormones, muscle fiber diameters in various muscles, and the mRNA expression of genes related to oxidative stress and programmed cell death were assessed. A decrease in muscle fiber diameters was observed in SSARC pigs, particularly in the longissimus and diaphragm muscles. Hormonal analysis revealed alterations in dehydroepiandrosterone, testosterone, oxytocin, myostatin, and cortisol levels, indicating a distinct hormonal response in SSARC pigs compared to controls. Oxytocin levels in SSARC pigs were significantly lower and myostatin levels higher. Additionally, changes in the expression of catalase (CAT), caspase 8 (CASP8), B-cell lymphoma 2 (BCL2), and BCL2-associated X protein (BAX) mRNA suggested a downregulation of oxidative stress response and apoptosis regulation. A reduced BAX/BCL2 ratio in SSARC pigs implied potential caspase-independent cell death pathways. The findings highlight the complex interplay between hormonal changes and muscle degradation in SSARC, underscoring the need for further research into the apoptotic and inflammatory pathways involved in muscle changes due to chronic organ inflammation in young individuals.

Keywords: chronic pancreatitis; muscle fibers; pig; sarcopenia.


Conflict of interest statement

The authors declare no conflicts of interest.

Figures
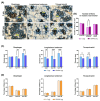
Figure 1
Figure 1
Muscle histomorphometry. (A) Representative images of the NADH-TR and MyHC stained sections of the diaphragm, the longissimus lumborum muscle, and the triceps brachii muscle in the control (C-pig) and cerulein-injected (SSARC-pig) groups, showing muscle fiber type variability. Type I fibers are stained brown, type IIa fibers are stained blue, and type IIb fibers are stained white; (B) Comparison of numbers of muscle fibers in the cross-section of the diaphragm, the longissimus lumborum muscle, and the triceps brachii muscle; (C) Comparison of the diameter of type I, IIa, and IIb muscle fibers in the diaphragm, longissimus lumborum muscle, and the triceps brachii muscle; (D) Comparison of the percentages of type I, IIa, and IIb muscle fibers in the diaphragm, longissimus lumborum muscle, and the triceps brachii muscle. In graphs, data are represented as the mean ± SE values (n = 5 in each group). Statistical significance: * p < 0.05, ** p < 0.01, *** p < 0.001 (two-tailed t-test adjusted for multiple comparisons using the Bonferroni method). In images in (A), all the scale bars show 100 μm.
Figure 2
Figure 2
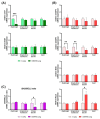
Time dependence of serum sarcopenic indicators during the experimental period: (A) dehydroepiandrosterone, DHEA; (B) testosterone, T; (C) cortisol; (D) oxytocin, OT; (E) myostatin, MNST; and (F) DHEA/cortisol ratio in pigs during the experimental period. Data are shown for the control group (C-pigs, black) and the cerulein-injected group (SSARC-pigs, red). The shaded area represents the 6-day-long period of daily cerulein injections (1 µg/kg b.w./day) in the SSARC-pig group. Data are presented as mean ± SE (n = 5 in each group). Statistical significance: * p < 0.05; ** p < 0.01; *** p < 0.001 (compared to day 0); # p < 0.05; ## p < 0.01 (between groups at a given time point).
Figure 3
Figure 3
Relative gene expression of (A) antioxidant proteins, (B) signal proteins of programmed cell death, and (C) BAX/BCL2 mRNA ratio in pigs in the control (C-pig) and cerulein-injected (SSARC-pig) groups. The expression was normalized to the GAPDH housekeeping gene and is presented relative to the level observed in the control group. Due to the −ΔΔCT method’s exponential nature for calculating relative mRNA expression, the graphs depict the geometric means with SE (standard errors) (n = 5 in each group). Statistical significance: * p < 0.05, ** p < 0.01, *** p < 0.001 (two-tailed t-test adjusted for multiple comparisons using the Bonferroni method).

Similar articles

Cited by

References

    1. Fielding R.A., Vellas B., Evans W.J., Bhasin S., Morley J.E., Newman A.B., Abellan van Kan G., Andrieu S., Bauer J., Breuille D., et al. Sarcopenia: An Undiagnosed Condition in Older Adults. Current Consensus Definition: Prevalence, Etiology, and Consequences. International Working Group on Sarcopenia. J. Am. Med. Dir. Assoc. 2011;12:249–256. doi: 10.1016/j.jamda.2011.01.003. - DOI - PMC - PubMed
    1. Morley J.E., Abbatecola A.M., Argiles J.M., Baracos V., Bauer J., Bhasin S., Cederholm T., Stewart Coats A.J., Cummings S.R., Evans W.J., et al. Sarcopenia with Limited Mobility: An International Consensus. J. Am. Med. Dir. Assoc. 2011;12:403–409. doi: 10.1016/j.jamda.2011.04.014. - DOI - PMC - PubMed
    1. Tagliafico A.S., Bignotti B., Torri L., Rossi F. Sarcopenia: How to Measure, When and Why. Radiol. Med. 2022;127:228–237. doi: 10.1007/s11547-022-01450-3. - DOI - PMC - PubMed
    1. Guttikonda D., Smith A.L. Sarcopenia Assessment Techniques. Clin. Liver Dis. 2021;18:189–192. doi: 10.1002/cld.1111. - DOI - PMC - PubMed
    1. Goodpaster B.H., Kelley D.E., Thaete F.L., He J., Ross R. Skeletal Muscle Attenuation Determined by Computed Tomography Is Associated with Skeletal Muscle Lipid Content. J. Appl. Physiol. 2000;89:104–110. doi: 10.1152/jappl.2000.89.1.104. - DOI - PubMed

LinkOut - more resources