. 2024 Aug 12;25(16):8777.
doi: 10.3390/ijms25168777.

Effect of Mifepristone on Migration and Proliferation of Oral Cancer Cells

Affiliations

Effect of Mifepristone on Migration and Proliferation of Oral Cancer Cells

Anem Iftikhar et al. Int J Mol Sci. .

Abstract

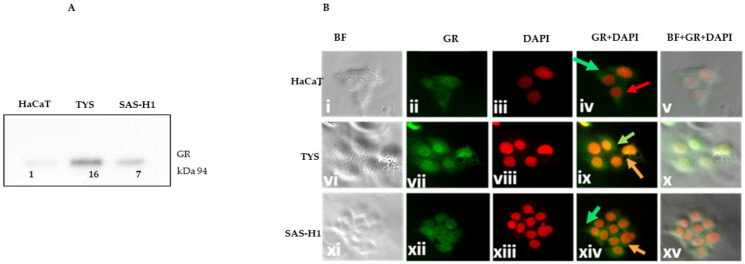
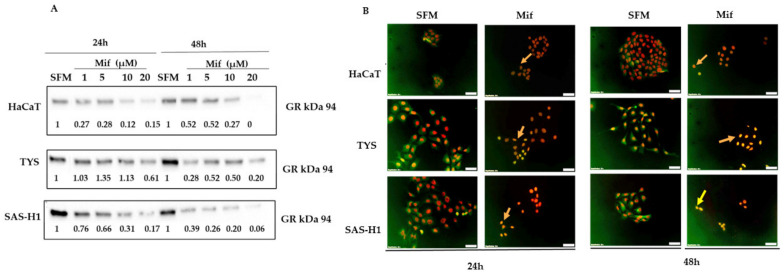
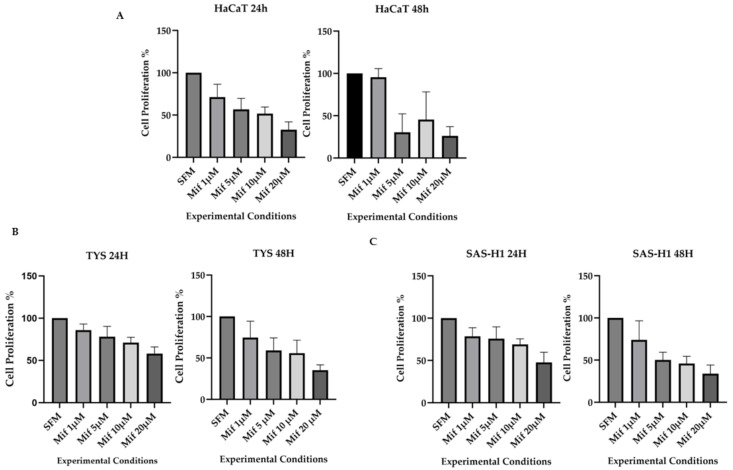
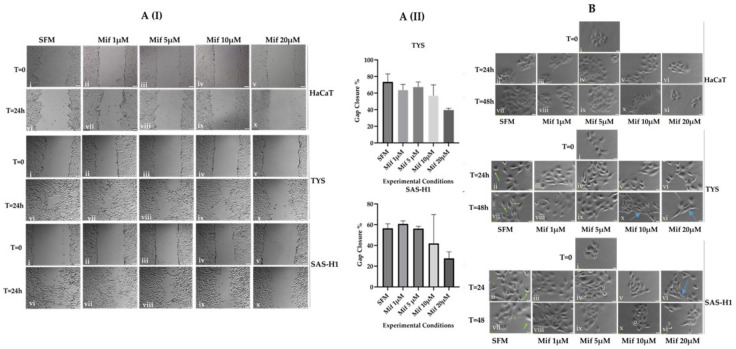
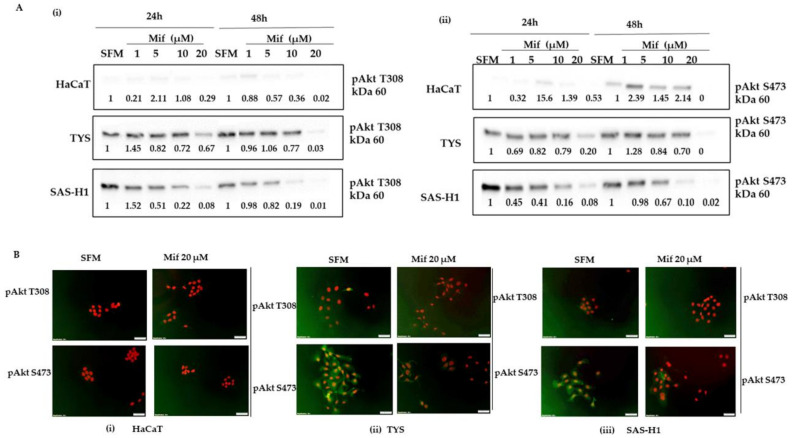
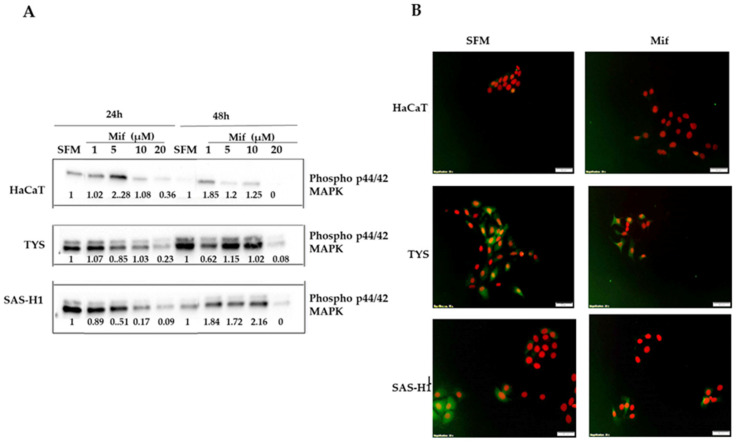
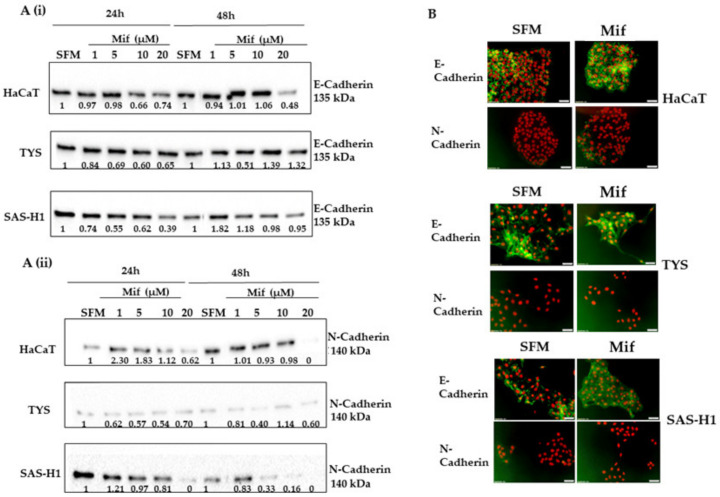
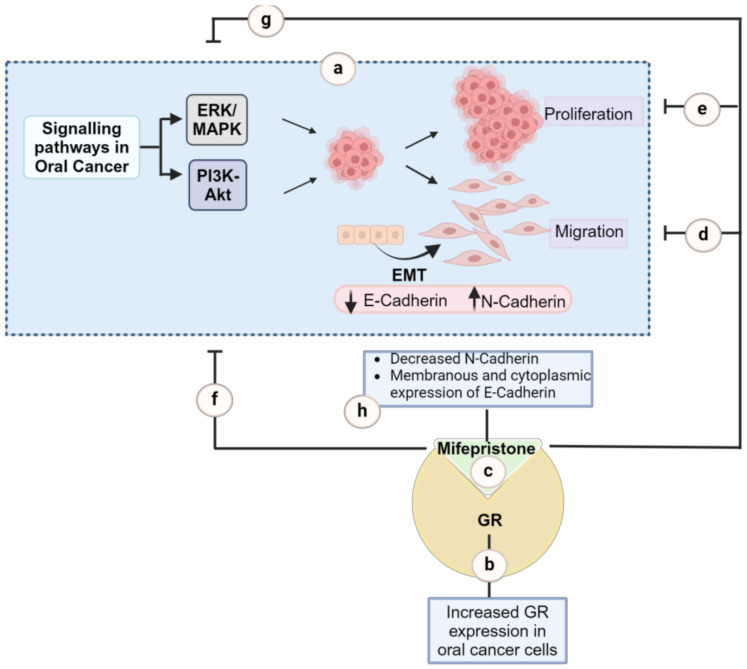
Glucocorticoid receptor (GR) overexpression has been linked to increased tumour aggressiveness and treatment resistance. GR antagonists have been shown to enhance treatment effectiveness. Emerging research has investigated mifepristone, a GR antagonist, as an anticancer agent with limited research in the context of oral cancer. This study investigated the effect of mifepristone at micromolar (µM) concentrations of 1, 5, 10 and 20 on the proliferation and migration of oral cancer cells, at 24 and 48 h. Scratch and scatter assays were utilised to assess cell migration, MTT assays were used to measure cell proliferation, Western blotting was used to investigate the expression of GR and the activation of underlying Phosphoinositide 3-kinase (PI3K)/protein kinase B (Akt) and mitogen-activated protein kinase (MAPK) signalling pathways, and immunofluorescence (IF) was used to determine the localisation of proteins in HaCaT (immortalised human skin keratinocytes), TYS (oral adeno squamous cell carcinoma), and SAS-H1 cells (squamous cell carcinoma of human tongue). Mifepristone resulted in a dose-dependent reduction in the proliferation of HaCaT, TYS, and SAS-H1 cells. Mifepristone at a concentration of 20 µM effectively reduced collective migration and scattering of oral cancer cells, consistent with the suppression of the PI3K-Akt and MAPK signalling pathways, and reduced expression of N-Cadherin. An elongated cell morphology was, however, observed, which may be linked to the localisation pattern of E-Cadherin in response to mifepristone. Overall, this study found that a high concentration of mifepristone was effective in the suppression of migration and proliferation of oral cancer cells via the inhibition of PI3K-Akt and MAPK signalling pathways. Further investigation is needed to define its impact on epithelial-mesenchymal transition (EMT) markers.

Keywords: MAPK signalling pathway; PI3K/Akt signalling pathway; cell migration; glucocorticoid receptor; head and neck cancer; mifepristone; oral cancer.


Conflict of interest statement

The authors declare no conflicts of interest.

Figures

Figure 1
Figure 1
Expression and localisation of the glucocorticoid receptor (GR) in HaCaT, TYS, and SAS-H1 cells. (A) HaCaT, TYS, and SAS-H1 cells were seeded at 1 × 10⁵ cells per 60 mm dish and grown in 10% foetal calf serum–minimum essential medium (FCS-MEM) for 24 h. Cells were then lysed, and the lysates were fractionated by SDS-PAGE using 10% acrylamide gels followed by transfer to a PVDF membrane by Western blotting. The membrane was probed using primary antibody for GR (1:1000), followed by incubation with goat anti-rabbit secondary antibody (Table 1). The Western blot was quantified against total protein, and the data are presented as the fold-change in the GR for TYS and SAS-H1 cells compared to HaCaT cells. TYS and SAS-H1 cells showed a higher expression of the GR in comparison to the HaCaT cells. Full blot images are presented in the Supplementary Materials (Figure S1). (B) (i–xv) HaCaT, TYS, and SAS-H1 cells were fixed with methanol after incubation with 10% FCS-MEM for 24 h. The fixed cells were analysed for the localisation of the GR by immunofluorescence (IF) with primary and fluorescent labelled secondary antibodies. The HaCaT, TYS, and SAS-H1 cells were observed for localisation of the GR using a fluorescence microscope IX70 and images were captured with a digital camera, XM10. Bright field (BF) images displayed cells, DAPI-stained images indicated the nuclei, and labelled antibody images revealed the GR. BF, GR, and DAPI images were merged using Adobe Photoshop to observe the pattern of localisation of GR in the cytoplasm and/or nucleus of the cells. Red arrow indicates the nucleus. Green arrows show localisation in the cytoplasm, orange arrows show localisation in the nucleus. Experiments were repeated three times. A representative experiment is shown.
Figure 2
Figure 2
Effect of mifepristone (Mif) on the expression and localisation of the glucocorticoid receptor (GR) in HaCaT, TYS, and SAS-H1 cells. (A) Cells treated with 1, 5, 10, and 20 µM mifepristone were incubated for 24 and 48 h. Cells were then lysed, and the lysates were fractionated by SDS-PAGE using 10% acrylamide gels followed by transfer to PVDF membrane by Western blotting. The membrane was probed using primary antibody for GR (1:1000), followed by incubation with goat anti-rabbit secondary antibody (Table 1). The Western blots were normalised against total protein, quantified, and the data presented as fold-change in the GR expression compared to cells incubated in serum-free medium (SFM) only, at 24 and 48 h. A representative experiment is shown. Full blot images are presented in the Supplementary Materials (Figure S2). (B) shows the merged immunofluorescence (IF) images for localisation of the GR in HaCaT, TYS, and SAS-H1 cells in response to mifepristone (Mif). Cells were treated with 20 µM mifepristone (Mif) and incubated for 48 h. Cells were then fixed and stained for GR using primary and fluorescent labelled secondary antibodies to analyse the localisation of the GR. Addition of mifepristone (Mif) resulted in complete nuclear translocation of the GR, as indicated by the arrows. The images were captured at 200× magnification using a fluorescence microscope (IX70) with a digital camera (XM10). Cells incubated with SFM were used as a control. Experiments were repeated three times. A representative experiment is shown.
Figure 3
Figure 3
Effect of mifepristone (Mif) on the proliferation of HaCaT, TYS, and SAS-H1 cells. HaCaT (A), TYS (B), and SAS-H1 (C) cells were seeded in 48-well plates at a cell density of 2 × 10⁴ cells/mL. Following overnight attachment, cells were treated with mifepristone (Mif) at concentrations of 1, 5, 10, and 20 µM and incubated for 24 and 48 h. MTT solution, diluted in serum-free medium (SFM), was added to the cells and incubated for 3 h. The MTT was then removed, and DMSO was added. The plates were read on an OPTIMA plate reader at a wavelength of 550 nm with a reference filter of 620 nm. Data are expressed as the cell proliferation percentage compared to SFM, as a mean of four experiments, with error bars representing standard deviation (SD). Cells incubated in SFM were used as a control. A dose-dependent decrease in proliferation was observed in response to mifepristone for all the three cell lines.
Figure 4
Figure 4
Effect of mifepristone on the migration of HaCaT, TYS, and SAS-H1 cell lines. A (I) (i–x) To observe the effect of mifepristone on collective cell migration, HaCaT, TYS and SAS-H1 cells were seeded at 5 × 10⁵ cells per 60 mm dish and incubated in 10% FCS-MEM until 90% confluency was achieved. A gap was then created in the monolayer. Cells were treated with mifepristone (Mif) concentrations of 1, 5, 10 and 20 µM and incubated for 24 h. Images were captured for all experimental conditions at time point 0 (T = 0) and after 24 h (T = 24 h), using the light microscope (IX70) and digital camera (XM10), at 40× magnification. (A) (II) The gap area at T = 0 and T = 24 h was analysed using Image J, and the data are presented as gap closure percentage, which decreased in response to increasing concentrations of mifepristone. Error bars represent the standard deviation (SD) in the three experiments. (B) (i–xi) To observe the effect of mifepristone on cell scatter, HaCaT, TYS, SAS-H1 cells were seeded at 4 × 10(4) cells/mL and grown into small colonies. Cells were treated with mifepristone (Mif) concentrations of 1, 5, 10, and 20 µM for 24 and 48 h. After completion of the respective time points, cell scattering, and morphology were observed in response to treatment with varying concentrations of mifepristone (Mif). Images were taken at time points 0 (T = 0), 24 h (T = 24 h), and 48 h (T = 48 h) with a microscope (IX70) and digital camera (XM10) at 200×. Compacted colonies of TYS and SAS-H1 cells were observed in response to high concentrations (10 µM and 20 µM) of mifepristone. Cells incubated with serum-free medium (SFM) were used as a control. Green arrows indicate scattered cells in TYS and SAS-H1 control cultures. Blue arrows indicate elongated morphology in response to mifepristone. Experiments were repeated three times; a representative experiment is shown.
Figure 5
Figure 5
Effect of mifepristone (Mif) on levels of phosphorylated Akt Threonine 308 (pAkt T308) (A) (i), phosphorylated Akt Serine 473 (pAkt S473) (A) (ii), and their localisation (B), in HaCaT, TYS, and SAS-H1 cells at 24 and 48. Cells were treated with mifepristone (Mif) concentrations of 1, 5, 10, and 20 µM and incubated for 24 and 48 h. Cells were then lysed, and the lysates were fractionated by SDS-PAGE using 10% acrylamide gels followed by transfer to PVDF membrane by Western blotting. The membranes were probed using primary antibodies for pAkt T308 (1:1000) (A) (i) and pAkt S473 (1:2000) (A) (ii), followed by incubation with goat anti-rabbit secondary antibody (Table 1). The Western blots were normalised against total protein, quantified, and the data were presented as the fold-change in levels of pAkt T308 (A) (i) and pAkt S473 (A) (ii), compared to serum-free medium (SFM) at 24 and 48 h. Full blot images are presented in the Supplementary Materials (Figure S2 = pAkt 308, Figure S3 = pAkt 473). (B) (i) HaCaT, (ii) TYS, and (iii) SAS-H1 were treated with 20 µM mifepristone (Mif) and incubated for 48 h. Cells were then fixed and stained for pAkt T308 and pAkt S473 using primary and fluorescent labelled secondary antibodies to analyse the localisation of pAkt T308 and pAkt S473. The images were captured using a fluorescence microscope (IX70) and digital camera (XM10) at 200× magnification. Cells incubated with SFM were used as a control. Experiments were repeated three times. A representative experiment is shown.
Figure 6
Figure 6
Effect of mifepristone (Mif) on levels of phosphorylated p44/42 mitogen-activated protein kinase (phospho p44/42 MAPK) (A), and its localisation (B), in HaCaT, TYS, and SAS-H1 cells at 24 and 48 h. (A) Cells were treated with mifepristone (Mif) concentrations of 1, 5, 10, and 20 µM and incubated for 24 and 48 h. Cells were then lysed, and the lysates were fractionated by SDS-PAGE using 10% acrylamide gels followed by transfer to a PVDF membrane by Western blotting. The membrane was probed using primary antibody for phospho p44/42 MAPK (1:2000), and goat anti-rabbit secondary antibody (Table 1). The Western blots were normalised against total protein, quantified, and the data were presented as the fold-change in levels of phospho p44/42 MAPK compared to serum-free medium (SFM) at 24 and 48 h. Full blot images are presented in the Supplementary Materials (Figure S3). (B) HaCaT, TYS, and SAS-H1 were treated with 20 µM mifepristone (Mif) and incubated for 48 h. Cells were then fixed for immunofluorescence (IF) and stained for phospho p44/42 MAPK using primary and fluorescent labelled secondary antibodies to analyse the localisation of phospho p44/42 MAPK. The images were captured using a fluorescence microscope (IX70) and a digital camera (XM10) at 200× magnification. Cells incubated with SFM were used as a control. Experiments were repeated three times. A representative experiment is shown.
Figure 7
Figure 7
Effect of mifepristone (Mif) on the expression of E-Cadherin (A) (i), N-Cadherin (A) (ii), and their localisation (B), in HaCaT, TYS, and SAS-H1 cells at 24 and 48 h. Cells were treated with mifepristone (Mif) at concentrations of 1, 5, 10, and 20 µM and incubated for 24 and 48 h. Cells were then lysed, and the lysates were fractionated by SDS-PAGE using 10% acrylamide gels followed by transfer to a PVDF membrane by Western blotting. The membranes were probed using primary antibodies for E-Cadherin (1:1000) (A) (i), N-Cadherin (1:1000) (A) (ii), and goat anti-rabbit secondary antibody (Table 1). The Western blots were normalised against total protein, quantified, and the data are presented as the fold-change in levels of E-Cadherin (A) (i) and N-Cadherin (A) (ii) compared to serum-free medium (SFM), at 24 and 48 h. Full blot images are presented in the Supplementary Materials (Figure S4). (B) HaCaT, TYS, and SAS-H1 were treated with 20 µM mifepristone (Mif) and incubated for 48 h. Cells were then fixed and stained for E-Cadherin and N-Cadherin using primary and fluorescent labelled secondary antibodies to analyse the localisation of E-Cadherin and N-Cadherin. The images were captured using a fluorescence microscope (IX70) and a digital camera (XM10) at 200× magnification. Cells incubated with SFM were used as a control. Experiments were repeated three times. A representative experiment is shown.
Figure 8
Figure 8
Summarizing the effect of mifepristone on the migration and proliferation of oral cancer cells. Cell proliferation and migration are the key hallmarks of cancer and are crucial to metastasis. Cell migration, is in turn, influenced by a transition in cellular morphology from epithelial to mesenchymal, a process known as epithelial–mesenchymal transition (EMT). Dysregulation of the PI3K-Akt and MAPK signalling pathways has been linked to increased cell proliferation and cell migration in HNC (a). The anticancer effects of glucocorticoid receptor antagonists, such as mifepristone, are widely reported for other cancer types with a lack of detailed exploration in oral cancer. This study bridges the gap by investigating the effects of mifepristone on cell migration, proliferation, and the underlying signalling pathways in oral cancer cells. Results showed increased expression of GR in oral cancer cells (b) and highlight the substantial impact of mifepristone (c), demonstrating that high concentrations (20 µM) effectively reduce the migration (d) and proliferation (e) of oral cancer cells. This effect is in accordance with the suppression of the Akt (f) and MAPK (g) signalling pathways, as well as the decreased expression of N-Cadherin (h). Despite the observed elongated cell morphology, which may be associated with the localisation pattern of E-Cadherin in response to mifepristone, the findings underscore the efficacy of mifepristone in inhibiting both the migration and proliferation of oral cancer cells. Further investigation is warranted to explore its impact on EMT markers to fully elucidate its role in HNC. Created with BioRender.com, accessed on 29 July 2024.

Similar articles

Cited by

References

    1. Chen J., Wang J., Shao J., Gao Y., Xu J., Yu S., Liu Z., Jia L. The Unique Pharmacological Characteristics of Mifepristone (RU486): From Terminating Pregnancy to Preventing Cancer Metastasis. Med. Res. Rev. 2014;34:979–1000. doi: 10.1002/med.21311. - DOI - PubMed
    1. Gill R., Ganatra B., Althabe F. WHO Essential Medicines For Reproductive Health. BMJ Glob. Health. 2019;4:1–2. doi: 10.1136/bmjgh-2019-002150. - DOI - PMC - PubMed
    1. Dalm S., Karssen A.M., Meijer O.C., Belanoff J.K., de Kloet E.R. Resetting the Stress System with a Mifepristone Challenge. Cell. Mol. Neurobiol. 2019;39:503–522. doi: 10.1007/s10571-018-0614-5. - DOI - PMC - PubMed
    1. Llaguno-Munive M., Vazquez-Lopez M.I., Jurado R., Garcia-Lopez P. Mifepristone Repurposing in Treatment of High-Grade Gliomas. Front. Oncol. 2021;11:39. doi: 10.3389/fonc.2021.606907. - DOI - PMC - PubMed
    1. Zhong C., Lu Y., Li Y., Xie H., Zhou G., Jia L. Similarities and Differences Between Embryonic Implantation and CTC Invasion: Exploring the Roles of Abortifacients in Cancer Metastasis Chemoprevention. Eur. J. Med. Chem. 2022;237:114416. doi: 10.1016/j.ejmech.2022.114416. - DOI - PubMed

MeSH terms

Substances

Grants and funding