. 2024 Aug 12;25(16):8782.
doi: 10.3390/ijms25168782.

Structural Characterization of Heat Shock Protein 90β and Molecular Interactions with Geldanamycin and Ritonavir: A Computational Study

Affiliations

Structural Characterization of Heat Shock Protein 90β and Molecular Interactions with Geldanamycin and Ritonavir: A Computational Study

Carlyle Ribeiro Lima et al. Int J Mol Sci. .

Abstract

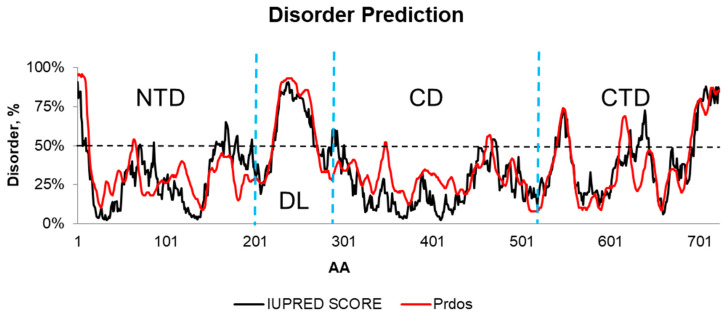
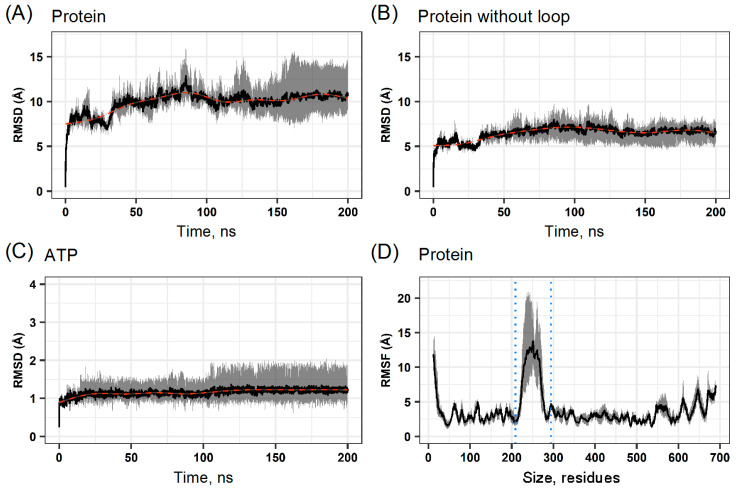
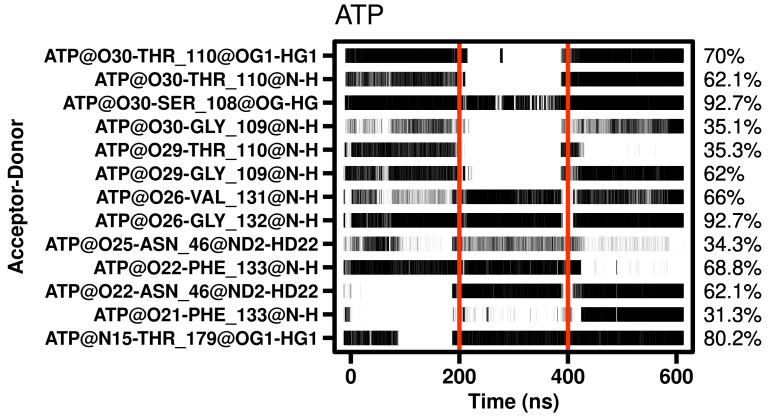
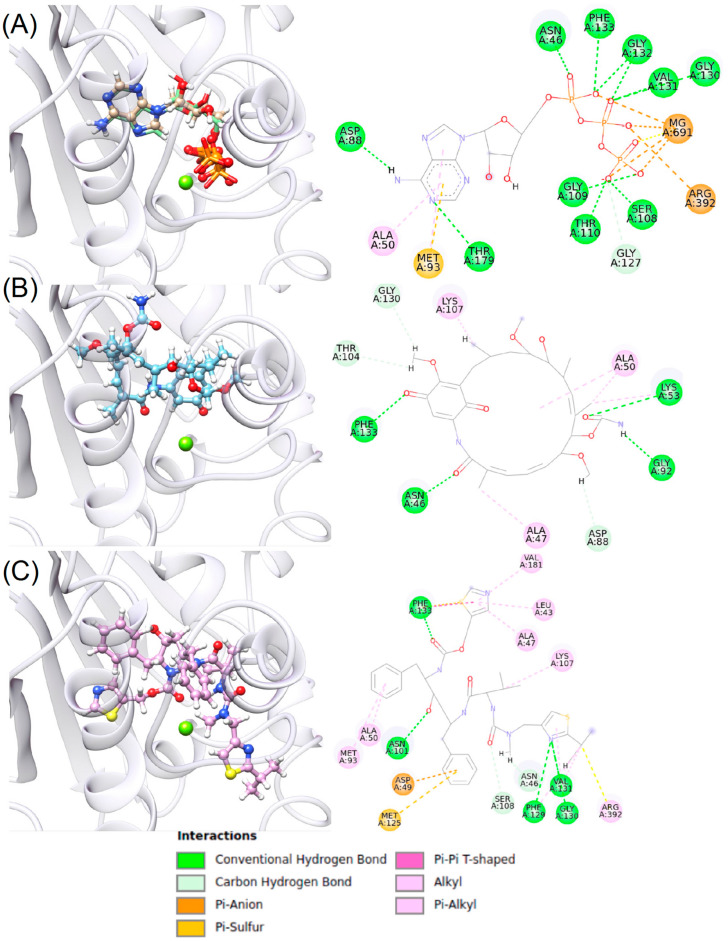
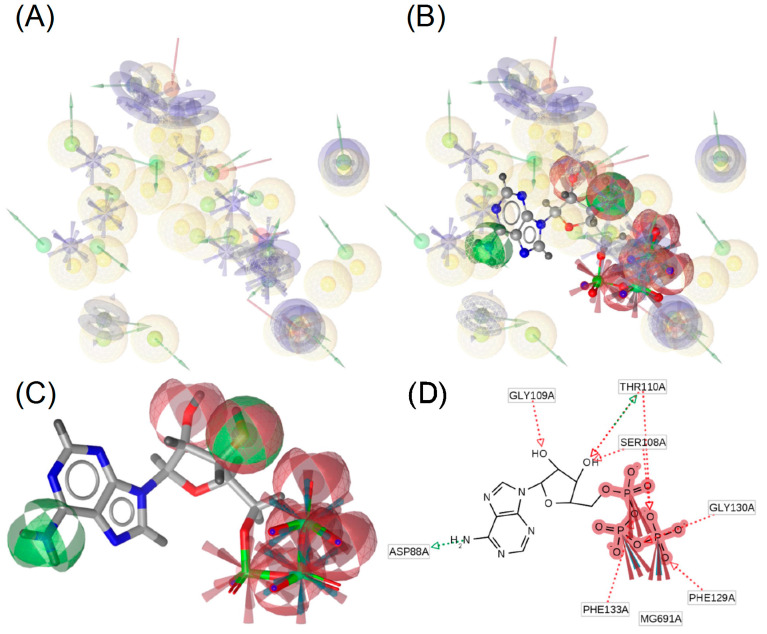
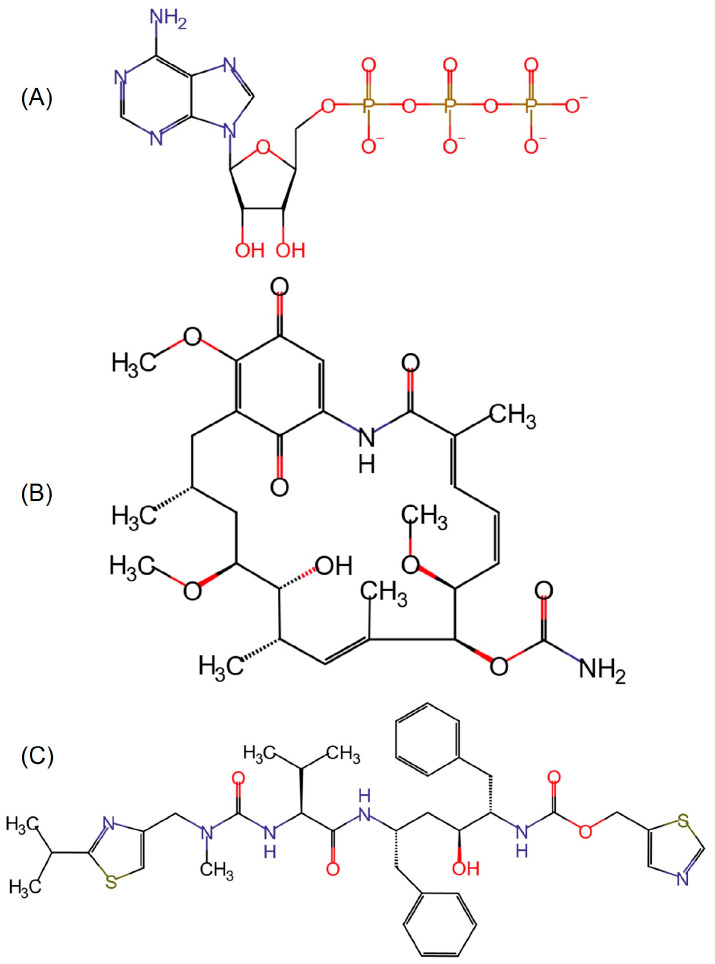
Drug repositioning is an important therapeutic strategy for treating breast cancer. Hsp90β chaperone is an attractive target for inhibiting cell progression. Its structure has a disordered and flexible linker region between the N-terminal and central domains. Geldanamycin was the first Hsp90β inhibitor to interact specifically at the N-terminal site. Owing to the toxicity of geldanamycin, we investigated the repositioning of ritonavir as an Hsp90β inhibitor, taking advantage of its proven efficacy against cancer. In this study, we used molecular modeling techniques to analyze the contribution of the Hsp90β linker region to the flexibility and interaction between the ligands geldanamycin, ritonavir, and Hsp90β. Our findings indicate that the linker region is responsible for the fluctuation and overall protein motion without disturbing the interaction between the inhibitors and the N-terminus. We also found that ritonavir established similar interactions with the substrate ATP triphosphate, filling the same pharmacophore zone.

Keywords: Hsp9β; cancer; chemical ligations; drug repurposing; geldanamycin; molecular docking; molecular dynamics; ritonavir.


Conflict of interest statement

The authors declare no conflicts of interest.

Figures

Figure 1
Figure 1
Profile of order levels of the Hsp90β 3D structure. NTD (N-terminal), DL (disordered loop), CD (central domain), and CTD (C-terminal) regions extend between 1–201, 202–301, 302–504, and 505–724 amino acids, respectively. Regions > 50% (horizontal dotted line) were considered disordered. The dotted blue lines represent the boundaries between the NTD, DL, CD, and CTD.
Figure 2
Figure 2
Quality assessment of Model 5 for Hsp90β. (A) Ramachandran graph of Model 5 with 96.75% favorable angles; (B) Qmean raw; (C) ERRAT plot for Hsp90β. Error-values were plotted as a function of the position of the sliding window of nine residues. Regions of the structure that can be rejected at 95% and 99% confidence levels are shown as yellow and red bars, respectively. White bars indicate regions in which protein folding can be considered reliable.
Figure 3
Figure 3
Root mean square deviation and fluctuation of Hsp90β complexed with ATP. (A) RMSD of Hsp90β with DL domain (loop). (B) RMSD of Hsp90β, disregarding the DL domain. (C) RMSD of ATP. (D) RMSF of Hsp90β in the DL region is highlighted (blue dots interval). The punctuated red lines represent smoothed averages (black) of fluctuations (gray).
Figure 4
Figure 4
Hydrogen bonds identified by MD simulation of the Hsp90–ATP complex as a function of time.
Figure 5
Figure 5
ATP redocking and docking of GDM and RIT ligands in the active site of Hsp90β. (A) ATP redocking, (B) GDM docking, and (C) RIT docking. Left: 3D docking of ligands in the best cluster of the Hsp90β active site; right: 2D interaction map of ligands in the most relevant Hsp90β cluster.
Figure 6
Figure 6
3D interaction analysis of the best cluster of Hsp90β–ATP with its foci in the N-terminal region. (A) Regions that interact with the active site of the best cluster of Hsp90β. (B) Interaction of ATP with the active site. (C) Regions of interaction of ATP: red—acceptor H-bond; green—donor H-bond. (D) 2D representation of ATP interactions. Yellow spheres represent hydrophobic interactions, blue spheres represent aromatic rings, red arrows indicate H-bond acceptors, and green arrows indicate the presence of H-bond donors.
Figure 7
Figure 7
Hsp90β ligands. (A): ATP, (B): geldanamycin, and (C): ritonavir.

Similar articles

References

    1. Sung H., Ferlay J., Siegel R.L., Laversanne M., Soerjomataram I., Jemal A., Bray F. Global Cancer Statistics 2020: GLOBOCAN Estimates of Incidence and Mortality Worldwide for 36 Cancers in 185 Countries. CA Cancer J. Clin. 2021;71:209–249. doi: 10.3322/caac.21660. - DOI - PubMed
    1. Bray F., Ferlay J., Soerjomataram I., Siegel R.L., Torre L.A., Jemal A. Global Cancer Statistics 2018: GLOBOCAN Estimates of Incidence and Mortality Worldwide for 36 Cancers in 185 Countries. CA Cancer J. Clin. 2018;68:394–424. doi: 10.3322/caac.21492. - DOI - PubMed
    1. Diniz C.S.G., Pellini A.C.G., Ribeiro A.G., Tedardi M.V., de Miranda M.J., Touso M.M., Baquero O.S., dos Santos P.C., Chiaravalloti-Neto F. Breast Cancer Mortality and Associated Factors in São Paulo State, Brazil: An Ecological Analysis. BMJ Open. 2017;7:e016395. doi: 10.1136/bmjopen-2017-016395. - DOI - PMC - PubMed
    1. Tilli T.M., Carels N., Tuszynski J.A., Pasdar M. Validation of a Network-Based Strategy for the Optimization of Combinatorial Target Selection in Breast Cancer Therapy: siRNA Knockdown of Network Targets in MDA-MB-231 Cells as an in Vitro Model for Inhibition of Tumor Development. Oncotarget. 2016;7:39. doi: 10.18632/oncotarget.11055. - DOI - PMC - PubMed
    1. Korsching E., Packeisen J., Liedtke C., Hungermann D., Wülfing P., van Diest P.J., Brandt B., Boecker W., Buerger H. The Origin of Vimentin Expression in Invasive Breast Cancer: Epithelial–Mesenchymal Transition, Myoepithelial Histogenesis or Histogenesis from Progenitor Cells with Bilinear Differentiation Potential? J. Pathol. 2005;206:451–457. doi: 10.1002/path.1797. - DOI - PubMed

MeSH terms

LinkOut - more resources