. 2024 Aug 13;25(16):8815.
doi: 10.3390/ijms25168815.

Development of a Bmi1+ Cardiac Mouse Progenitor Immortalized Model to Unravel the Relationship with Its Protective Vascular Endothelial Niche

Affiliations

Development of a Bmi1+ Cardiac Mouse Progenitor Immortalized Model to Unravel the Relationship with Its Protective Vascular Endothelial Niche

Guillermo Albericio et al. Int J Mol Sci. .

Abstract

The adult mammalian heart has been demonstrated to be endowed with low but real turnover capacity, especially for cardiomyocytes, the key functional cell type. The source, however, of that turnover capacity remains controversial. In this regard, we have defined and characterized a resident multipotent cardiac mouse progenitor population, Bmi1+DR (for Bmi1+ Damage-Responsive cells). Bmi1+DR is one of the cell types with the lowest ROS (Reactive Oxygen Species) levels in the adult heart, being particularly characterized by their close relationship with cardiac vessels, most probably involved in the regulation of proliferation/maintenance of Bmi1+DR. This was proposed to work as their endothelial niche. Due to the scarcity of Bmi1+DR cells in the adult mouse heart, we have generated an immortalization/dis-immortalization model using Simian Vacuolating Virus 40-Large Antigen T (SV40-T) to facilitate their in vitro characterization. We have obtained a heterogeneous population of immortalized Bmi1+DR cells (Bmi1+DRIMM) that was validated attending to different criteria, also showing a comparable sensitivity to strong oxidative damage. Then, we concluded that the Bmi1-DRIMM population is an appropriate model for primary Bmi1+DR in vitro studies. The co-culture of Bmi1+DRIMM cells with endothelial cells protects them against oxidative damage, showing a moderate depletion in non-canonical autophagy and also contributing with a modest metabolic regulation.

Keywords: Bmi1; Bmi1-DR; SV40-T; autophagy; endothelial; heart; immortalization; metabolism; niche; oxidative damage; progenitor; senescence.


Conflict of interest statement

The authors declare no conflicts of interest.

Figures
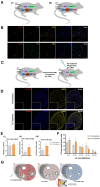
Figure 1
Figure 1
Endogenous Bmi1+DR population shows a clear perivascular location regulated by oxidative stress. (A) Linage tracing Bmi1CreERT/+Rosa26YFP/+ (I) and Bmi1CreERT/+Rosa26tdTomato/+ (II) mouse models. (B) Representative images showing double-positive Tomato+ Sca1+ Bmi1+DR cell juxtaposed localization to vascular structures (αSMA+) in Bmi1CreERT/+Rosa26tdTomato/+ mice 5d post-Tx induction. Bars, 71 μm. (C) Scheme of in vivo single-dose Pq treatment (48h) in Bmi1CreERT/+Rosa26tdTomato/+ mice 5d post-Tx induction. (D) Total and partial (inset) mosaic (maps) images of transverse heart cryosections of single-dose Pq-treated (up) and non-treated Bmi1CreERT/+Rosa26tdTomato/+ mice (down) showing Tomato+ Bmi1+DR cell number and localization with respect to vascular structures (αSMA+). Bars in partial and total mosaic images, 100 and 500 μm respectively. (E) Analysis of TOMATO mean signal (I), Tomato+ cell numbers (II), and relativized total Tomato+ cell (Tomato+/Dapi+) numbers (III) in single-dose Pq-treated (Pq Treatment) compared to non-treated (homeostasis) Bmi1CreERT/+Rosa26tdTomato/+ mice on maps of transverse heart cryosections (n = 3; >1000 Bmi1+ cells/heart). (F) Distribution of Bmi1+DR cells in relation to coronary vasculature of single-dose Pq-treated (Pq Treatment) compared to non-treated (homeostasis) Bmi1CreERT/+Rosa26tdTomato/+ mice on maps of transverse heart cryosections (n = 3; >1000 Bmi1+ cells/heart). (G) Graphical model of how oxidative stress affects Bmi1+ vascular niche. Low oxidative stress (Low-ROS G6PDtg mice) distorts Bmi1+DR cell localization on vascular structures, while high oxidative stress (Pq treatment) increases proximity and numbers.
Figure 2
Figure 2
Generation and characterization of a conditionally immortalized Bmi1+DR population. (A) Representation of the SV40-T/TK immortalization vector used in the generation of the immortalized Bmi1+DR cell population. (B) Scheme of the procedure followed for the generation of the immortalized Bmi1+DR population through transduction of the SV40-T/TK lentiviral vector. (C) Cumulative population doubling rate (Y axis) after successive passes (p; X axis) of primary Bmi1+DR cells transduced with the different indicated MOIs. (D) Comparative SV40-T and TK expression by RT-qPCR analysis (relative to GusB) in primary Bmi1+DR cells treated with the different MOIs evaluated. (E) SV40-T protein expression by Western Blot in Bmi1+DR cells transduced with MOI 5 and 10 (I) and the corresponding analysis relative to αTUBULIN protein as control (II). (F) Evaluation of different membrane markers characterized by the Bmi1+DR population in the immortalized line by flow cytometry. (G) Comparative RT-qPCR analysis evaluating the expression relative to the endogenous GusB control of genes defining the Bmi1+DR population comparing early passage (p6) primary Bmi1+DR cells, control Bmi1+DR cells maintained during the immortalization process (p16), and final Bmi1+DRIMM population (p16) (n = 3); SV40-T expression was evaluated as confirmation of immortalized nature. (H) Bmi1 expression analysis by RT-qPCR after stimulation of Bmi1+DRIMM cells with different recombinant proteins (VEGFA, EPHRINB2, EPHB4); untreated Bmi1+DRIMM cells as control (n = 6). Statistical analyses: ** p < 0.01, *** p < 0.001; one-way ANOVA Bonferroni post-test.
Figure 3
Figure 3
Bmi1+DRIMM dis-immortalization provokes a sudden senescent phenotype. (A) Scheme of the procedure followed for Bmi1+DRIMM cell dis-immortalization (Bmi1+DRIMM-REV) through transduction with an adenoviral vector that induces the expression of the Cre recombinase. (B) Comparative SV40-T and TK expression by RT-qPCR, relative to endogenous GusB gene expression, in Bmi1+DRIMM cells treated in the dis-immortalization process with different MOIs of Cre adenoviral vector. (C) SV40-T protein expression by Western Blot in the Bmi1+DRIMM cell line transduced in the process of dis-immortalization with different MOIs of Cre adenoviral vector and after negative selection with Ganciclovir (GCV). (D) Bright field representative images showing cellular morphology (left) and quantification of the percentage of proliferating cells by incorporating EdU for 12 h (right) in Bmi1+DRIMM cell line before (up) and after (down) the dis-immortalization process. Scale bar, 200 μm. (E) β-galactosidase-based staining for senescent cells (blue color) comparing Bmi1+DRIMM (left) and Bmi1+DRIMM-REV (right) cells and the corresponding quantification of senescent cells observed per field in each of the cell types analyzed (red dot line highlighting difference between cell types). Scale bar, 200 μm.
Figure 4
Figure 4
Co-culture with cardiac endothelium reduces the impact of oxidative stress damage in Bmi1+DRIMM cells. (A) Cell death caused by Pq treatment at different concentrations in primary Bmi1+DR (DAPI+) and Bmi1+DRIMM (PI+) cells analyzed by flow cytometry; cell damage labels compatible with the fluorescent proteins expressed by each line. (B) Evaluation by RT-qPCR of marker gene expression in response to oxidative damage induced by Pq treatment (5 mM; 12 h) on primary Bmi1+DR (I) and Bmi1+DRIMM (II) cells; expression represented as values relative to control untreated Bmi1+DR cells (homeostasis) (n = 3). (C) Timeline of the procedure followed to evaluate the severe oxidative damage response induced by in vitro Pq treatment on Bmi1+DRIMM cells co-cultured with different cell types. (D) Cellular separation by flow cytometry of the co-cultured Violet+ cells (Bmi1+DRIMM cells) and Violet- cells (other specific cell type). (E) Representative independent flow cytometry analysis of percentage of dead (PI+) Violet- cells and Violet+ cells (Bmi1+DRIMM cells) under co-culture conditions and oxidative stress exposure (Pq treatment; 5 mM, 8 mM). Percentage of PI-labeled dead Bmi1+DRIMM cells (% Bmi1+DRIMM/PI+) observed under oxidative damage conditions (5 mM or 8 mM Pq treatment; 12h) in the co-cultures carried out on (F) 1g11 cells; (G) MEFs; (H) HL-1 cell line; and (I) primary cardiac endothelial cells (pCECs) (n ≥ 3). Statistical analyses: * p-value < 0.05; ** p-value < 0.01; *** p-value < 0.001; Mann–Whitney U-Test.
Figure 4
Figure 4
Co-culture with cardiac endothelium reduces the impact of oxidative stress damage in Bmi1+DRIMM cells. (A) Cell death caused by Pq treatment at different concentrations in primary Bmi1+DR (DAPI+) and Bmi1+DRIMM (PI+) cells analyzed by flow cytometry; cell damage labels compatible with the fluorescent proteins expressed by each line. (B) Evaluation by RT-qPCR of marker gene expression in response to oxidative damage induced by Pq treatment (5 mM; 12 h) on primary Bmi1+DR (I) and Bmi1+DRIMM (II) cells; expression represented as values relative to control untreated Bmi1+DR cells (homeostasis) (n = 3). (C) Timeline of the procedure followed to evaluate the severe oxidative damage response induced by in vitro Pq treatment on Bmi1+DRIMM cells co-cultured with different cell types. (D) Cellular separation by flow cytometry of the co-cultured Violet+ cells (Bmi1+DRIMM cells) and Violet- cells (other specific cell type). (E) Representative independent flow cytometry analysis of percentage of dead (PI+) Violet- cells and Violet+ cells (Bmi1+DRIMM cells) under co-culture conditions and oxidative stress exposure (Pq treatment; 5 mM, 8 mM). Percentage of PI-labeled dead Bmi1+DRIMM cells (% Bmi1+DRIMM/PI+) observed under oxidative damage conditions (5 mM or 8 mM Pq treatment; 12h) in the co-cultures carried out on (F) 1g11 cells; (G) MEFs; (H) HL-1 cell line; and (I) primary cardiac endothelial cells (pCECs) (n ≥ 3). Statistical analyses: * p-value < 0.05; ** p-value < 0.01; *** p-value < 0.001; Mann–Whitney U-Test.
Figure 5
Figure 5
Direct contact with primary cardiac endothelial cells alters autophagic flux in Bmi1+DR cells. (A) Scheme and timeline of the procedure followed to evaluate the effect of the co-culture with primary cardiac endothelial cells (pCECs) on Bmi1+DR cell autophagy by LC3B detection and comparative transcriptional analysis. (B) Representative analysis of the L3CB detection by flow cytometry using LC3B antibody comparing control Bmi1+DR cells cultured independently (I) vs. Bmi1+DR cells co-cultured with pCEC in direct contact conditions (II) and (C) the corresponding quantitative analysis of the total (I), canonical (II), and non-canonical (III) autophagy flux (n = 3). (D) Expression by RT-qPCR in Bmi1+DRIMM cells of genes involved in canonical and non-canonical autophagy represented as values relative to control Bmi1+DRIMM cells cultured independently vs. Bmi1+DRIMM cells co-cultured with pCEC separated by a transwell or in direct contact conditions. (n = 4) Statistical analyses: *** p-value < 0.001; one-way ANOVA Bonferroni post-test.
Figure 6
Figure 6
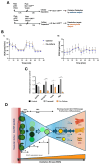
Direct contact with primary cardiac endothelial cells might reduce metabolic activity in Bmi1+DRIMM cells. (A) Scheme and timeline of the procedure followed to evaluate the effect of the co-culture with primary cardiac endothelial cells (pCECs) on Bmi1+DRIMM cells metabolic activity by Seahorse XF96 metabolic flux analyses and comparative transcriptional analysis. (B) Seahorse analysis profile of glycolysis and mitochondrial function by measuring (I) percentage of oxygen consumption rate (OCR) and (II) percentage of extracellular acidification rate (ECAR), both comparing Bmi1+DRIMM cells cultured independently (control) and in direct contact with pCEC (co-culture) (n = 3). (C) Expression in Bmi1+DRIMM cells of relevant genes involved in metabolism analyzed by RT-qPCR; expression was represented as values relative to control Bmi1+DRIMM cells cultured independently vs. Bmi1+DRIMM cells co-cultured with primary cardiac endothelial cells (pCEC) separated by a transwell or in direct contact conditions (n = 4). Statistical analyses: ** p-value < 0.01, *** p-value < 0.001; one-way ANOVA Bonferroni post-test. (D) Working model: The proposed vascular niche allows the protection of Bmi1+DR cells, maintaining them mostly in a non-proliferation state with a low rate of differentiation.

Similar articles

References

    1. Garbern J.C., Lee R.T. Heart regeneration: 20 years of progress and renewed optimism. Dev. Cell. 2022;57:424–439. doi: 10.1016/j.devcel.2022.01.012. - DOI - PMC - PubMed
    1. Mollova M., Bersell K., Walsh S., Savla J., Das L.T., Park S.Y., Silberstein L.E., Dos Remedios C.G., Graham D., Colan S., et al. Cardiomyocyte proliferation contributes to heart growth in young humans. Proc. Natl. Acad. Sci. USA. 2013;110:1446–1451. doi: 10.1073/pnas.1214608110. - DOI - PMC - PubMed
    1. Gabisonia K., Prosdocimo G., Aquaro G.D., Carlucc L., Zentilin L., Secco I., Ali H., Braga L.N., Bernini F. MicroRNA therapy stimulates uncontrolled cardiac repair after myocardial infarction in pigs. Nature. 2019;569:418–422. doi: 10.1038/s41586-019-1191-6. - DOI - PMC - PubMed
    1. Eschenhagen T., Bolli R., Braun T., Field L.J., Fleischmann B.K., Frisén J., Giacca M., Hare J.M., Houser S. Cardiomyocyte Regeneration: A Consensus Statement. Circulation. 2017;136:680–686. doi: 10.1161/CIRCULATIONAHA.117.029343. - DOI - PMC - PubMed
    1. Senyo S.E., Steinhauser M.L., Pizziment C.L., Yang V.K., Cai L., Wang M., Wu T.D., Guerquin-Kern J.L., Lechene C.P., Lee R.T. Mammalian heart renewal by pre-existing cardiomyocytes. Nature. 2013;493:433–436. doi: 10.1038/nature11682. - DOI - PMC - PubMed

LinkOut - more resources