. 2024 Aug 13;25(16):8829.
doi: 10.3390/ijms25168829.

Activation of the TRPML1 Ion Channel Induces Proton Secretion in the Human Gastric Parietal Cell Line HGT-1

Affiliations

Activation of the TRPML1 Ion Channel Induces Proton Secretion in the Human Gastric Parietal Cell Line HGT-1

Alina Ulrike Mueller et al. Int J Mol Sci. .

Abstract

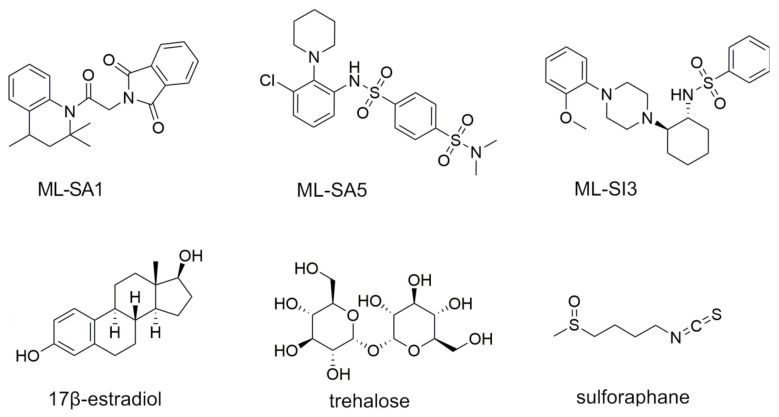
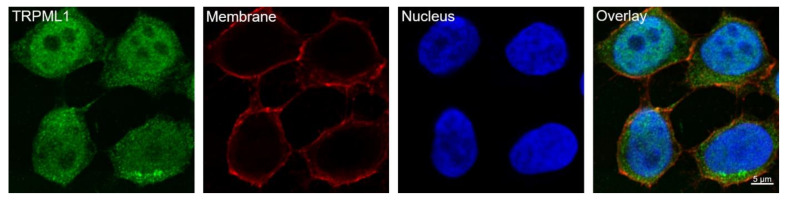
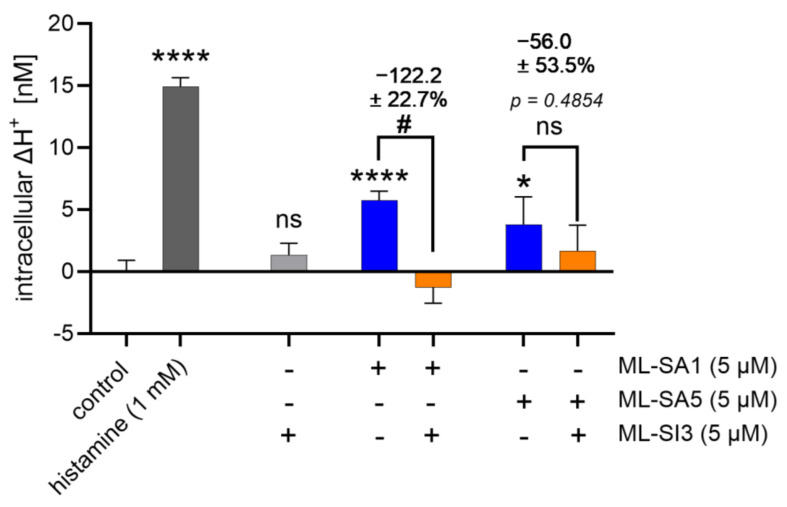
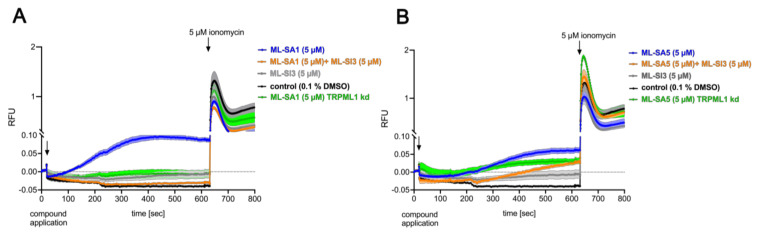
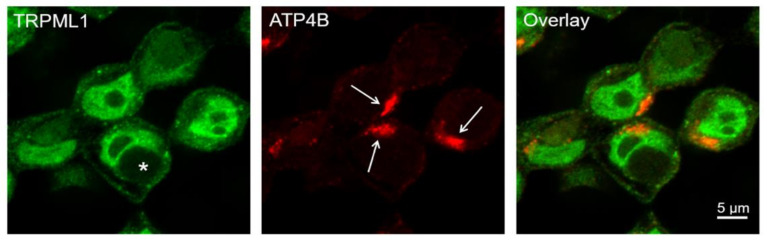
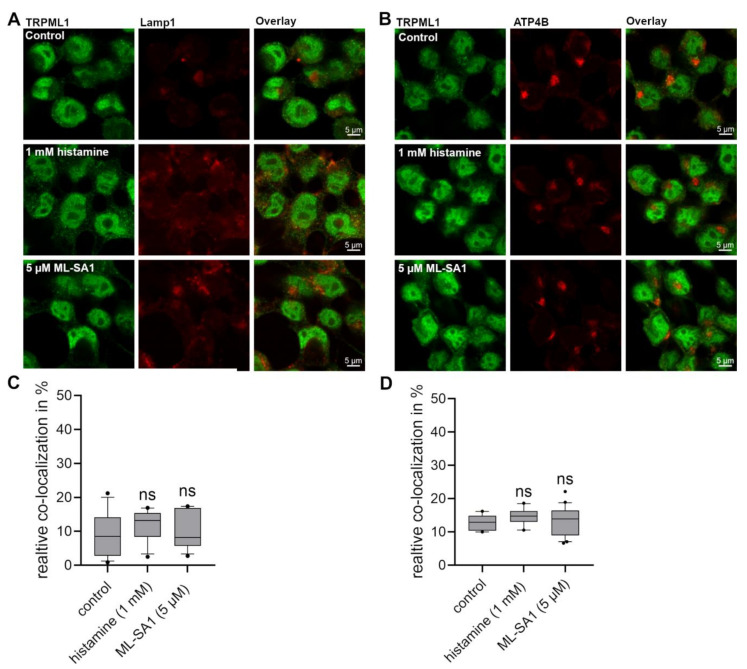
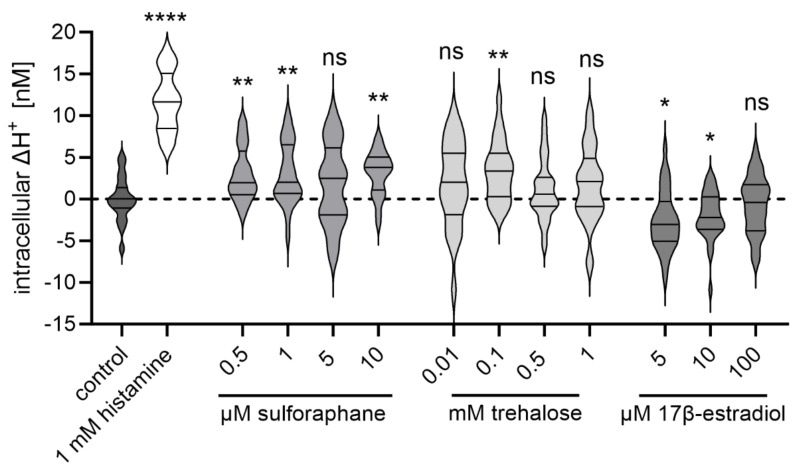
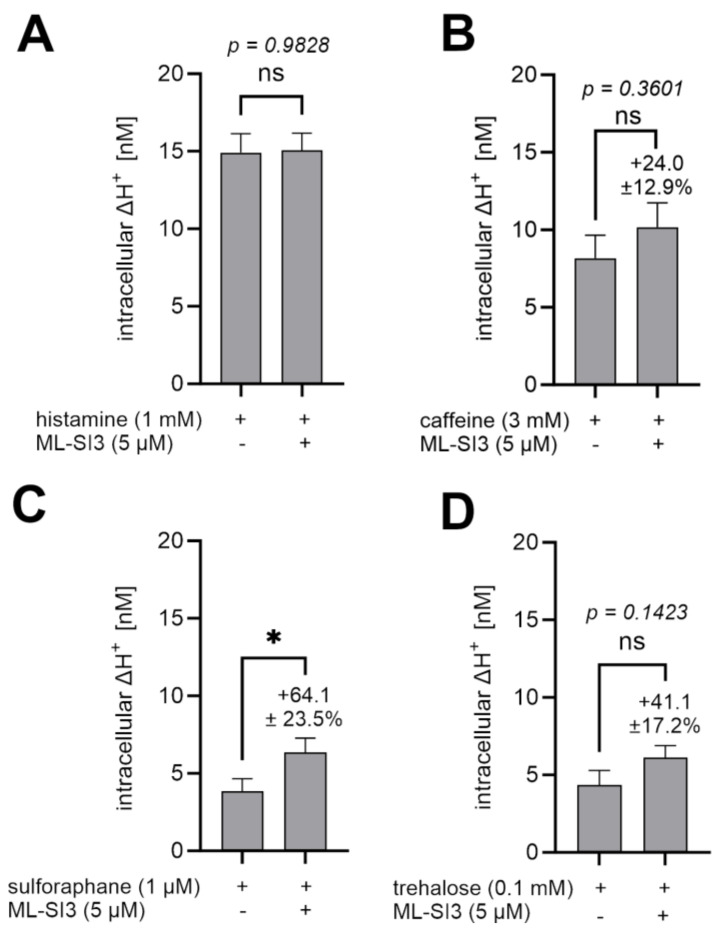
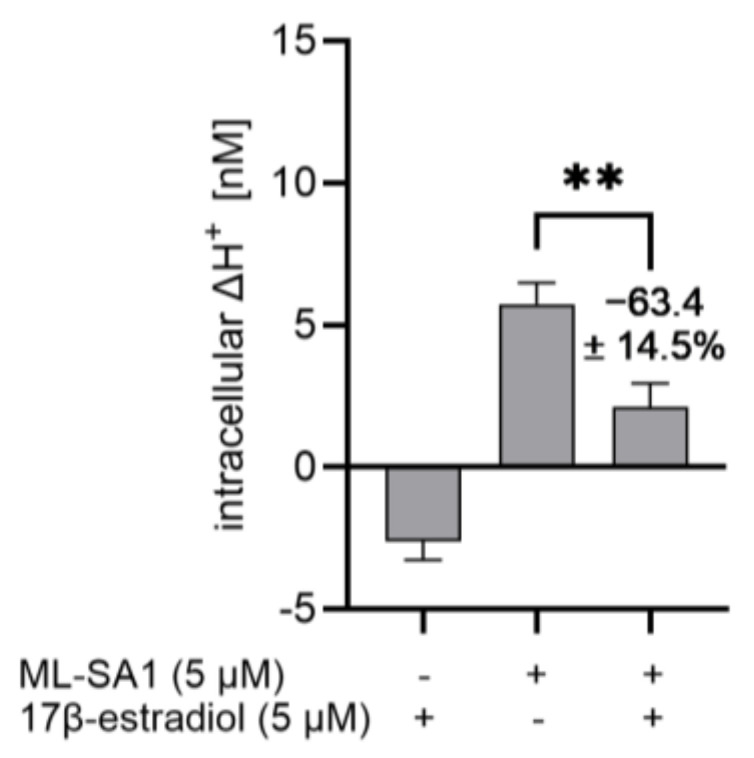
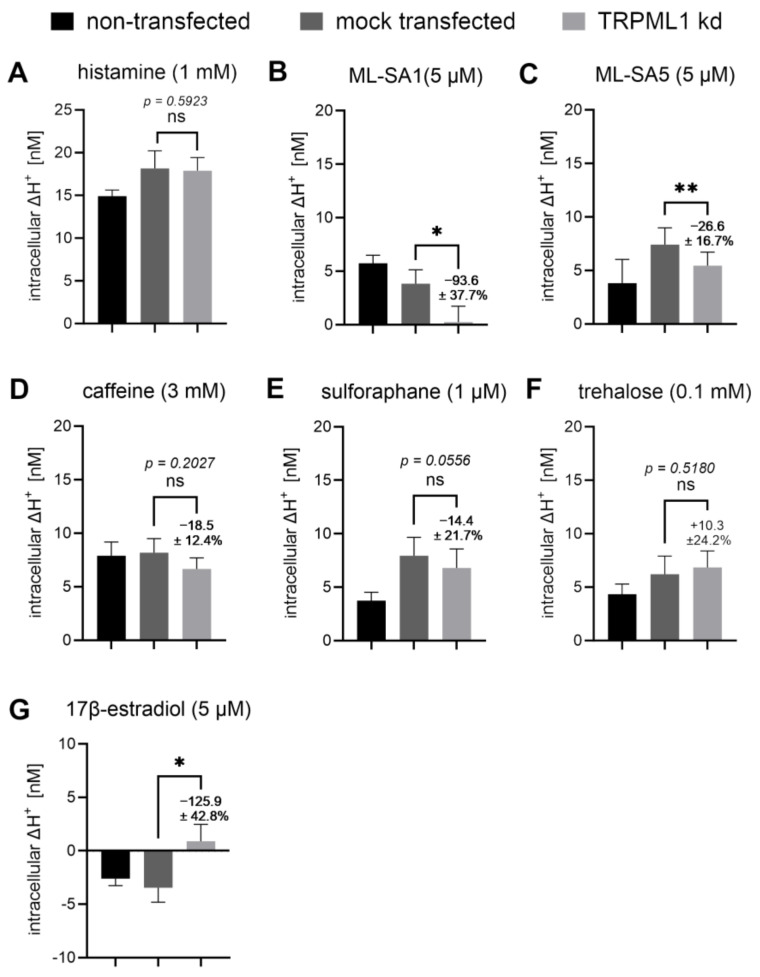
The lysosomal Ca2+ channel TRPML1 was found to be responsible for gastric acid secretion in murine gastric parietal cells by inducing the trafficking of H+/K+-ATPase containing tubulovesicles to the apical membrane. Therefore, we hypothesized a similar role of TRPML1 in regulating proton secretion in the immortalized human parietal cell line HGT-1. The primary focus was to investigate the involvement of TRPML1 in proton secretion using the known synthetic agonists ML-SA1 and ML-SA5 and the antagonist ML-SI3 and, furthermore, to identify food-derived compounds that target the channel. Proton secretion stimulated by ML-SA1 was reduced by 122.2 ± 22.7% by the antagonist ML-SI3. The steroid hormone 17β-estradiol, present in animal-derived foods, diminished the proton secretory effect of ML-SA1 by 63.4 ± 14.5%. We also demonstrated a reduction in the proton secretory effects of ML-SA1 and ML-SA5 on TRPML1 knock-down cells. The food-derived compounds sulforaphane and trehalose promoted proton secretion in HGT-1 cells but may act independently of TRPML1. Also, histamine- and caffeine-induced proton secretion were affected by neither the TRPML1 antagonist ML-SI3 nor the TRPML1 knock-down. In summary, the results obtained suggest that the activation of TRPML1 promotes proton secretion in HGT-1 cells, but the channel may not participate in canonical signaling pathways.

Keywords: Lamp1; MCOLN1; Mucolipin1; TRPML1; calcium.


Conflict of interest statement

The authors declare no conflicts of interest.

Figures

Figure 1
Figure 1
Chemical structures of the synthetic TRPML1 agonists ML-SA1 and ML-SA5, the antagonist ML-SI3, and the potential food-derived TRPML1 activity modulators sulforaphane, trehalose, and 17β-estradiol.
Figure 2
Figure 2
TRPML1 is expressed in HGT-1 cells detected with super-resolution imaging. Fluorescent-labeled TRPML1 channels with anti-TRPML1 antibody and anti-Rabbit IgG with Alexa Fluor 488 fluorophore (green) are localized in the cell membrane, cytoplasm, and nucleus, in contrast to membrane staining with ConA and streptavidin-Alexa Fluor 633 (red) and nucleus staining with Hoechst-33342 (blue). The Zeiss LSM 780 microscope (Carl Zeiss AG, Munich, Germany) with airyscan detection (Carl Zeiss AG, Munich, Germany) and a 40×/1.2 Imm Korr DIC M27 objective lens (Carl Zeiss AG, Munich, Germany) was used for image acquisition. Scale bar: 5 μm.
Figure 3
Figure 3
Effect on proton secretion in HGT-1 cells incubated with 5 µM of the synthetic TRPML1 agonists ML-SA1 and ML-SA5 and the antagonist ML-SI3. Intracellular ΔH+ concentrations in nM are shown as mean ± SEM, n = 4–5, t. r. = 4–6. Statistics: Student’s t-test of untreated compared to treated cells (two-tailed, unpaired); significant differences are indicated with ns = not significant, * = p ≤ 0.05, and **** = p ≤ 0.0001. Student’s t-test of activator-only treated cells compared to cells treated with the co-incubation of ML-SI3 with ML-SA1 or ML-SA5 (two-tailed, unpaired); significant differences are indicated with ns = not significant; # = p ≤ 0.05.
Figure 4
Figure 4
Inhibitory effect of ML-SI3 on ML-SA1- and ML-SA5-stimulated HGT-1 cells in the calcium mobilization assay. (A): Co-incubation of ML-SA1 with ML-SI3 in the calcium mobilization assay. The ML-SA1 signal in TRPML1 kd cells is shown in green. (B): Co-incubation of ML-SA5 with ML-SI3 in the calcium mobilization assay. The ML-SA5 signal in TRPML1 kd cells is shown in green. A 5 µM ionomycin was applied as a positive control. Data are shown as relative fluorescence (RFU) normalized to baseline fluorescence n = 3, t. r. = 2.
Figure 5
Figure 5
Super-resolution image of 5 µM ML-SA1-incubated HGT-1 cells stained for TRPML1 (green) and the β-subunit of H+/K+-ATPase ATP4B (red) obtained with an airyscan detector: For image acquisition, a Zeiss LSM 780 microscope equipped with airyscan detection and a 40×/1.2 Imm Korr DIC M27 objective lens was used. Airyscan image processing was performed using the ZEN 2.3 SP1 black program. The scale bar represents 5 μm. The H+/K+-ATPase accumulation is indicated in the direction of the arrow. The vacuolar apical compartment formation is displayed with the star.
Figure 6
Figure 6
Co-localization of TRPML1 channels Lamp-1 and β-subunit of H+/K+-ATPase (ATP4B) in HGT-1 cells. Cells were incubated with either 1 mM histamine or 5 µM ML-SA1 for 10 min before staining with anti-TRPML1 antibody (green) and anti-human-CD107a (A in red) for Lamp-1. The β-subunit of H+/K+-ATPase was stained with anti-ATP4B antibody (B in red). Scale bar represents 5 μm. The co-localization was calculated for TRPML1 with Lamp-1 (C) and ATP4B (D) based on the pixel count. Data is presented as box plots with 10th and 90th percentiles. Data points outside of this range are indicated as dots, n = 1–2, t. r. = 10–20. Statistics: Student’s t-test of control compared treated cells (two-tailed, paired); ns: not significant.
Figure 7
Figure 7
Proton secretion-inducing effect of sulforaphane, trehalose, and 17β-estradiol on HGT-1 cells. Intracellular ΔH+ concentrations in nM are shown as a violin plot, n = 4–5, t. r. = 4–6. Statistics: Student’s t-test (two-tailed, unpaired); significant differences are indicated with ns = not significant; * = p ≤ 0.05; ** = p ≤ 0.01; **** = p ≤ 0.0001.
Figure 8
Figure 8
Effect of ML-SI3 on histamine-, caffeine-, trehalose-, and sulforaphane-induced proton secretion. Intracellular ΔH+ concentrations in nM are shown as mean ± SEM, n = 4–5, t. r. = 4–6. Statistics: Student’s t-test (two-tailed, unpaired); significant differences are indicated with ns = not significant; * = p ≤ 0.05. (AD): Co-incubation of 5 µM ML-SI3 with 1 mM histamine, 3 mM caffeine, 1 µM sulforaphane, and 0.1 mM trehalose.
Figure 9
Figure 9
Inhibitory effect of 17β-estradiol on ML-SA1-stimulated proton secretion. Intracellular ΔH+ concentrations in nM are shown as mean ± SEM, n = 4–5, t. r. = 4–6. Statistics: Student’s t-test (two-tailed, unpaired); significant difference is indicated with ** = p ≤ 0.01.
Figure 10
Figure 10
Histamine, caffeine, and TRPML1-targeting compounds and the influence on the proton-secreting effect in TRPML1 kd cells compared to mock-transfected and non-transfected HGT-1 cells. Intracellular ΔH+ concentrations in nM are shown for the comparison of non-transfected (black bar), mock-transfected (dark grey bar), and TRPML1 kd (light grey bar) cells incubated with 1 mM histamine (A), 5 µM ML-SA1 (B), 5 µM ML-SA5 (C), 3 mM caffeine (D), 1 µM sulforaphane (E), 0.1 mM trehalose (F), and 5 µM 17β-estradiol (G). Data are shown as mean ± SEM, n = 3–4, t. r. = 6; statistics: Student’s t-test (two-tailed, paired [mock vs. TRPML1 kd], unpaired [non-transfected vs. mock]); significant differences are indicated with ns = not significant; * = p ≤ 0.05; ** = p ≤ 0.01.

Similar articles

Cited by

References

    1. Nilius B., Owsianik G. The transient receptor potential family of ion channels. Genome Biol. 2011;12:218. doi: 10.1186/gb-2011-12-3-218. - DOI - PMC - PubMed
    1. Wang W., Zhang X., Gao Q., Xu H. TRPML1: An ion channel in the lysosome. Handb. Exp. Pharmacol. 2014;222:631–645. doi: 10.1007/978-3-642-54215-2_24. - DOI - PubMed
    1. Zhang X., Li X., Xu H. Phosphoinositide isoforms determine compartment-specific ion channel activity. Proc. Natl. Acad. Sci. USA. 2012;109:11384–11389. doi: 10.1073/pnas.1202194109. - DOI - PMC - PubMed
    1. Dong X.-P., Shen D., Wang X., Dawson T., Li X., Zhang Q., Cheng X., Zhang Y., Weisman L.S., Delling M., et al. PI(3,5)P2 controls membrane trafficking by direct activation of mucolipin Ca2+ release channels in the endolysosome. Nat. Commun. 2010;1:38. doi: 10.1038/ncomms1037. - DOI - PMC - PubMed
    1. Zhang X., Chen W., Gao Q., Yang J., Yan X., Zhao H., Su L., Yang M., Gao C., Yao Y., et al. Rapamycin directly activates lysosomal mucolipin TRP channels independent of mTOR. PLoS Biol. 2019;17:e3000252. doi: 10.1371/journal.pbio.3000252. - DOI - PMC - PubMed

MeSH terms

LinkOut - more resources