. 2024 Aug 14;25(16):8853.
doi: 10.3390/ijms25168853.

Role of Extracellular Vesicles in Crohn's Patients on Adalimumab Who Received COVID-19 Vaccination

Affiliations

Role of Extracellular Vesicles in Crohn's Patients on Adalimumab Who Received COVID-19 Vaccination

Maria De Luca et al. Int J Mol Sci. .

Abstract

Crohn's disease (CD) is a type of inflammatory bowel disease (IBD) affecting the gastrointestinal tract that can also cause extra-intestinal complications. Following exposure to the mRNA vaccine BNT162b2 (Pfizer-BioNTech) encoding the SARS-CoV-2 Spike (S) protein, some patients experienced a lack of response to the biological drug Adalimumab and a recrudescence of the disease. In CD patients in progression, resistant to considered biological therapy, an abnormal increase in intestinal permeability was observed, more often with a modulated expression of different proteins such as Aquaporin 8 (AQP8) and in tight junctions (e.g., ZO-1, Claudin1, Claudin2, Occludin), especially during disease flares. The aim of this study is to investigate how the SARS-CoV-2 vaccine could interfere with IBD therapy and contribute to disease exacerbation. We investigated the role of the SARS-CoV-2 Spike protein, transported by extracellular vesicles (EVs), and the impact of various EVs components, namely, exosomes (EXOs) and microvesicles (MVs), in modulating the expression of molecules involved in the exacerbation of CD, which remains unknown.

Keywords: Adalimumab; Crohn’s disease; SARS-Cov-2; exosomes; ions channel; microvesicles.


Conflict of interest statement

The authors declare no conflicts of interest.

Figures
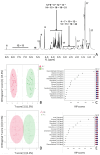
Figure 1
Figure 1
The 1D 1H CPMG spectrum of serum (Bruker Avance 400 MHz, D2O). The assignment of NMR signals was performed by comparison with standard compounds. The residual water signal (4.78 ppm) is hidden. The signals assigned to the metabolites are indicated with increasing numbers according to the same criterion adopted in Table S1 (A). OPLS-DA was applied to the 72 spectra by using UV-scaled 0.04 ppm-sized bucketing. Scores plot for the selected components, where the observations are indicated according to the vaccine time as follows: “▲” before the first dose and “■” before the third dose. The ellipse shows the 95% confidence interval using statistics from the Hotelling T-square test (T2). The ellipses are colored according to the class of samples they include, i.e. pink for the samples before the first dose of vaccine and green for the samples before the third dose of vaccine (B). Analysis of the Variable Importance in Projection (VIP) identified by OPLS-DA. The colored boxes on the right indicate the relative concentrations of the corresponding metabolite in each group under study. The samples class is indicated as blue and red squares for serum samples collected before the first dose of vaccine (T0) and before the third (T2), respectively (C). OPLS-DA was applied to the 72 spectra using UV-scaled 0.04 ppm-sized bucketing. Scores plot for the selected components, where the observations are indicated according to the responsiveness to the therapy administered as follows: “∆” non-responder and “+” responder. The ellipse shows the 95% confidence interval using statistics from the Hotelling T-square test (T2). The ellipses are colored according to the class of samples they include, i.e. pink for the non-responder and green for the responder (D). Analysis of the Variable Importance in Projection (VIP) identified by OPLS-DA. The colored boxes on the right indicate the relative concentrations of the corresponding metabolite in each group under study. The samples class is indicated as blue and red squares for serum samples collected from patients who responded to the therapy and those who did not respond, respectively (E).
Figure 2
Figure 2
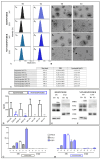
EV chemical–physical characterization. EXOs and MVs extracted from the sera of patients with CD, including responders and non-responders to Adalimumab, treated with the BNT162b2 mRNA-Pfizer COVID-19 vaccine at baseline, before the first dose (T0), and before the third dose (T2). Representative intensity size distribution by DLS analysis (A) and TEM micrographs. Scale bar: 200 nm (B). The recorded average hydrodynamic diameter and polydispersity index (PDI) obtained by DLS analysis and the ζ-potential value (mean ± SD) are reported in the provided table (C). Evaluation of Adalimumab in the two EV subpopulations (EXOs and MVs) derived from R and NR patients, at T0 and T2. NR T2 vs. R T2 (D). Evaluation of MV and EXO proteins isolated from serum specimens derived from patients with CD and treated with the BNT162b2 mRNA-Pfizer COVID-19 vaccine at baseline (T0, before the first dose) and before the third dose (T2), responders or non-responders to Adalimumab before the third dose. Representative Western blotting of different proteins (Spike, ACE, AQP8) and housekeeping protein (Annexin 1 for MV and CD81 for EXO) (E,F). Semiquantitative evaluation of the considered protein expression levels in MVs and EXOs obtained from patients with CD after the BNT162b2 mRNA-Pfizer COVID-19 vaccine, both Rs and NRs to Adalimumab by video-densitometry analysis of Spike, ACE2, and AQP8 bands on Western blotting. The Annexin 1 and CD81 protein bands were used to normalize the protein band for each subject. (**) p < 0.001 T2 vs. T0 for R and NR conditions, respectively (G,H).
Figure 3
Figure 3
Cell permeability assay of HCEC-1CT cell layers as a function of time upon challenging with EVs derived from the serum of R and NR patients (AC). The control was untreated cells. For each diagram (BD), the error bars represent the standard deviation of the mean over five experiments with different EVs. (B) TEER of HCEC-1CT cell layers during challenges with EXO T0 and T2 and MV T0 and T2 derived from R patients’ sera. (D) TEER of HCEC-1CT cell layers during challenges with EXO T0 and T2 and MV T0 and T2 derived from NR patients’ sera. ** p < 0.001. Scale bar: 100 μm.
Figure 4
Figure 4
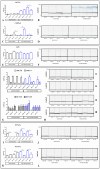
Droplet digital PCR analysis of OCLN, CLDN2, ACE, ABCC8 (SUR), ABCC9 (SUR2), KCNJ8, KCNJ11, SCN5A, and SCN2A. HCEC-1CT cells treated with serum-derived EXOs and MVs from patients with CD, R and NR patients at T0 (before the first dose of the BNT162b2 mRNA-Pfizer COVID-19 vaccine at baseline) and before the third dose (T2). The value of copies/μL for OCLN is reported in (A). Average values are reported in (B). The value of copies/μL for CLDN2 is reported in (C). Average values are reported in (D). The value of copies/μL ACE is reported in (E). Average values are reported in (F). The value of copies/μL for ABCC8 (SUR), ABCC9 (SUR2), KCNJ8, and KCNJ11 are reported in (G). Average values are reported in (H). The value of copies/μL for SCN2A is reported in (I). Average values are reported in (J). The value of copies/μL for SCN5A are reported in (K). Average values are reported in (L). The p-value was determined by one-way ANOVA, * p < 0.005 and ** p < 0.001.
Figure 5
Figure 5
Evaluation of several proteins involved in tight junction formation, adherent junctions, and water channels in HCEC-1CT cells treated with different concentrations of urea or with MVs and EXOs isolated from serum specimens derived from patients with CD and treated with the BNT162b2 mRNA-Pfizer COVID-19 vaccine at baseline (T0, before the first dose) and before the third dose (T2), responders or non-responders to Adalimumab before the third dose. Representative Western blotting of different proteins (ZO-1, OCLN, CLDN1 CLDN2, E-CAD, and AQP8) and the housekeeping protein (GAPDH) (A) after treatment with urea. Semiquantitative evaluation of considered protein expression levels in HCEC-1CT (B). Representative Western blotting of cells treated with EXOs and MVs for the same proteins (C) and semiquantitative evaluation of the considered proteins. The GAPDH protein band was used to normalize the protein band in each subject. (*) p < 0.005 and (**) p < 0.001 T2 vs. T0 (D). Representative confocal microscopy images of HCEC-1CT cells for the detection of ZO-1, OCLN, CLDN-2, and E-CAD by immunofluorescence. Blue channel: nuclei; green channel: labeled ZO-1, OCLN, CLDN-2, and E-CAD in overlay images for treatment with EVs derived from R patients (E) and NR patients (F). Scale bar: 50 μm. Magnification: ×20. Semiquantitative evaluation of ZO-1, OCLN, CLDN-2, and E-CAD expression levels in HCEC-1CT treated with EVs extracted from R patients (G) and NR patients (H) by fluorescence expression levels, quantitatively evaluated as the mean green intensity index in cells by immunofluorescence. (*) p < 0.005 and (**) p < 0.001 T2 vs. T0.

Similar articles

References

    1. Dolinger M., Torres J., Vermeire S. Crohn’s Disease. Lancet. 2024;403:1177–1191. doi: 10.1016/S0140-6736(23)02586-2. - DOI - PubMed
    1. Coward S., Benchimol E.I., Kuenzig M.E., Windsor J.W., Bernstein C.N., Bitton A., Jones J.L., Lee K., Murthy S.K., Targownik L.E., et al. The 2023 Impact of Inflammatory Bowel Disease in Canada: Epidemiology of IBD. J. Can. Assoc. Gastroenterol. 2023;6:256. doi: 10.1093/jcag/gwad004. - DOI - PMC - PubMed
    1. Desai D., Dhoble P. Rapidly Changing Epidemiology of Inflammatory Bowel Disease: Time to Gear up for the Challenge before It Is Too Late. Indian J. Gastroenterol. 2024;43:15–17. doi: 10.1007/s12664-023-01453-6. - DOI - PubMed
    1. Clinton J.W., Cross R.K. Personalized Treatment for Crohn’s Disease: Current Approaches and Future Directions. Clin. Exp. Gastroenterol. 2023;16:249–276. doi: 10.2147/CEG.S360248. - DOI - PMC - PubMed
    1. Cho C.W., You M.W., Oh C.H., Lee C.K., Moon S.K. Long-Term Disease Course of Crohn’s Disease: Changes in Disease Location, Phenotype, Activities, and Predictive Factors. Gut Liver. 2022;16:157–170. doi: 10.5009/gnl210118. - DOI - PMC - PubMed

LinkOut - more resources