. 2024 Aug 16;25(16):8938.
doi: 10.3390/ijms25168938.

Antifungal Synergy: Mechanistic Insights into the R-1-R Peptide and Bidens pilosa Extract as Potent Therapeutics against Candida spp. through Proteomics

Affiliations

Antifungal Synergy: Mechanistic Insights into the R-1-R Peptide and Bidens pilosa Extract as Potent Therapeutics against Candida spp. through Proteomics

Yerly Vargas-Casanova et al. Int J Mol Sci. .

Abstract

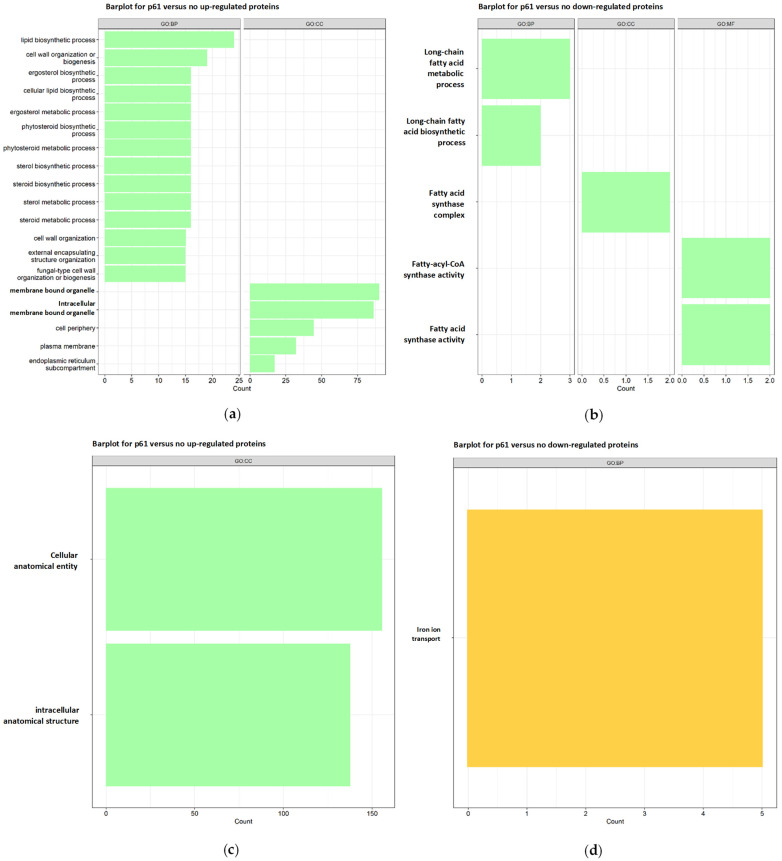
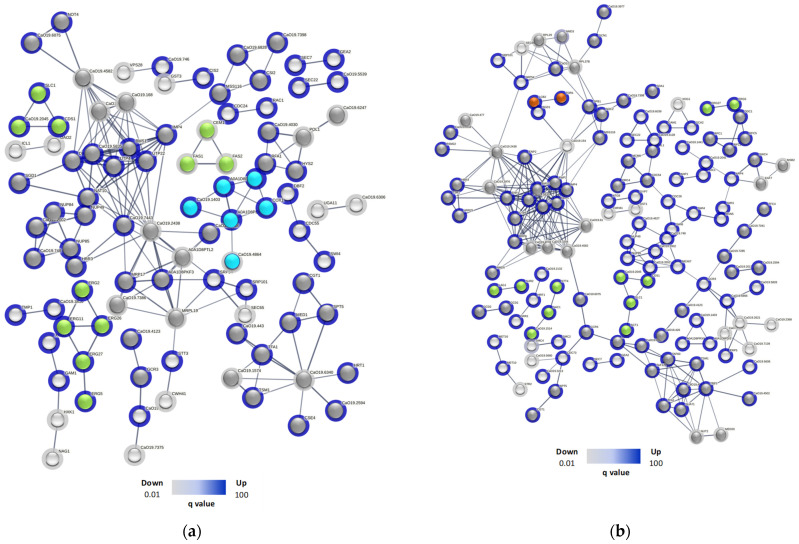
Previous reports have demonstrated that the peptide derived from LfcinB, R-1-R, exhibits anti-Candida activity, which is enhanced when combined with an extract from the Bidens pilosa plant. However, the mechanism of action remains unexplored. In this research, a proteomic study was carried out, followed by a bioinformatic analysis and biological assays in both the SC5314 strain and a fluconazole-resistant isolate of Candida albicans after incubation with R-1-R. The proteomic data revealed that treatment with R-1-R led to the up-regulation of most differentially expressed proteins compared to the controls in both strains. These proteins are primarily involved in membrane and cell wall biosynthesis, membrane transport, oxidative stress response, the mitochondrial respiratory chain, and DNA damage response. Additionally, proteomic analysis of the C. albicans parental strain SC5314 treated with R-1-R combined with an ethanolic extract of B. pilosa was performed. The differentially expressed proteins following this combined treatment were involved in similar functional processes as those treated with the R-1-R peptide alone but were mostly down-regulated (data are available through ProteomeXchange with identifier PXD053558). Biological assays validated the proteomic results, evidencing cell surface damage, reactive oxygen species generation, and decreased mitochondrial membrane potential. These findings provide insights into the complex antifungal mechanisms of the R-1-R peptide and its combination with the B. pilosa extract, potentially informing future studies on natural product derivatives.

Keywords: Bidens pilosa; Candida albicans; ROS; antifungal resistance; bovine lactoferricin peptides; disfunction mitochondrial; proteomics.


Conflict of interest statement

The authors declare no conflicts of interest.

Figures

Figure 1
Figure 1
Susceptibility of homozygous mutant strains after incubation with the combination of R-1-R peptide and B. pilosa extract. Data are means ± SD from three experiments. ** p < 0.01, and **** p ≤ 0.0001.
Figure 2
Figure 2
Venn diagram of the total and exclusive proteins obtained after treatment with R-1-R in (a) SC5314 and (b) 256. (c) Up- and down-regulated proteins in SC5314 and 256 treated with R-1-R, grouped according to their biological function.
Figure 3
Figure 3
Bar plots of functional analyses for (a) up- and (b) down-regulated proteins for strain SC5314 and (c) up- and (d) down-regulated proteins in strain 256 treated with R-1-R. The green bars represent terms associated with the membrane or cell wall, yellow bars represent terms associated with membrane transporters, dark gray bars are terms associated with the nucleus or DNA/RNA, and light gray bars are the terms associated with other cellular processes.
Figure 4
Figure 4
The STRING protein–protein interaction network of up- and down-regulated proteins in (a) SC5314 and (b) 256 after treatment with R-1-R. The nodes of the network are proteins identified by gene name, while the lines are edges that represent functional associations based on different types of evidence. The haloes of the nodes, in blue, belong to up-regulated proteins and the gray halos to down-regulated ones. The colors in the nodes represent biological processes, such as those related to the membrane (green), nucleic acids (dark gray), mitochondrial membrane potential (light blue), autophagy and endocytosis (orange), and others (light gray).
Figure 5
Figure 5
(a) Venn diagram of the total and exclusive proteins obtained in SC5314 after treatment with the combination between R-1-R and B. pilosa extract. (b) Up- and down-regulated proteins in SC5314 treated with the combination, grouped according to their biological function.
Figure 6
Figure 6
Bar plots of functional analyses for (a) up- and (b) down-regulated proteins for strain SC5314 treated with the combination. (c) The STRING protein–protein interaction network of SC5314 treated with the combination. The nodes of the network are proteins identified by gene name; the lines are edges that represent functional associations based on different types of evidence. The haloes of the nodes, in blue, belong to up-regulated proteins and the gray halos to down-regulated ones. The colors in the nodes represent biological processes, such as those related to the membrane (green), oxidative stress (lilac), mitochondrial respiration (blue), nuclide acids (dark gray), and others (light gray).
Figure 7
Figure 7
STEM images of C. albicans SC5314 without treatment (a) and after 2 h of incubation with R-1-R (b,c), B. pilosa extract (d,e), or a combination of peptide and extract (fi), where there was a synergistic effect; R-1-R (25 µg/mL) and extract B. pilosa (250 µg/mL). The arrows indicate the cytoplasmic microbodies.
Figure 8
Figure 8
STEM images of C. albicans 256 without treatment (a,b) and after 2 h of incubation with R-1-R (c,d), B. pilosa extract (e,f), or a combination of peptide and extract (g,h), where there was a synergistic effect; R-1-R (50 µg/mL) and extract B. pilosa (62.25 µg/mL).
Figure 9
Figure 9
Rhodamine 6G (R6G) efflux over time in (a) C. albicans SC5314 and (b) C. albicans 256. Colored lines indicate the concentration of R6G released after the addition of 20 mM glucose (Glu); black lines correspond to the controls without Glu. Data are means ± SD from three experiments. * p < 0.05, ** p < 0.01, and *** p < 0.001.
Figure 10
Figure 10
(a) ROS accumulation on C. albicans. ROS production was assessed via staining with H2DCFDA; cells were pretreated with varying concentrations of R-1-R, (SC5314 and mutant strains: MIC: 100 µg/mL, SUB MIC: 25 µg/mL; 256: MIC: 100 µg/mL, SUB MIC: 50 µg/mL) and extract (SC5314 and mutant strains: MIC: 500 µg/mL, SUB MIC: 250 µg/mL; 256: MIC: 500 µg/mL, SUB MIC: 62.5 µg/mL), and Amphotericin B (SC5314 and mutant strains: 4 µg/mL; 256: 64 µg/mL) was used as the positive control. MFI, mean fluorescence intensity; A.U., arbitrary units. The results were obtained as means ± SD from three experiments. * p < 0.05, *** p < 0.001, and **** p ≤ 0.0001 compared with SC5314 in each group treated; ### p < 0.001, and #### p ≤ 0.0001 compared with SC5314 without treatment. (b) The effect of ROS scavenger, NAC, on the candidacidal activity of R-1-R (100 µg/mL) was also examined.
Figure 11
Figure 11
Mitochondrial membrane potential was measurement using rhodamine 123 staining. Cells were treated with R-1-R, (SC5314 and mutant strains: MIC: 100 µg/mL, SUB MIC: 25 µg/mL; 256: MIC: 100 µg/mL, SUB MIC: 50 µg/mL) and extract (SC5314 and mutant strains: MIC: 500 µg/mL, SUB MIC: 250 µg/mL; 256: MIC: 500 µg/mL, SUB MIC: 62.5 µg/mL), and sodium azide (NaN3; 5 mM) was used as the positive control. MFI, mean fluorescence intensity; A.U., arbitrary units. The results were obtained as means ± SD from three experiments. * p < 0.05, ** p < 0.01, and **** p ≤ 0.0001 compared with SC5314 in each group treated; ### p < 0.001, and #### p ≤ 0.0001 compared with SC5314 without treatment.
Figure 12
Figure 12
Scheme of the up-regulated (red letters) and down-regulated (blue letters) proteins by the action of the R-1-R peptide and its combination (orange bubbles) with an extract of B. pilosa against the cell wall and membrane of both strains of C. albicans SC5314 and C. albicans 256 (gray bubbles) or exclusively in each strain [C. albicans SC5314 (green bubbles) and C. albicans 256 (red bubbles)].
Figure 13
Figure 13
Scheme of the up-regulated (red letters) and down-regulated (blue letters) proteins by the action of the R-1-R peptide and its combination (orange bubbles) with an extract of B. pilosa against both strains (gray bubbles) of C. albicans SC5314 (green bubbles) and C. albicans 256 (red bubbles) or exclusively in each strain.

Similar articles

Cited by

References

    1. Lopes J.P., Lionakis M.S. Pathogenesis and Virulence of Candida albicans. Virulence. 2022;13:89–121. doi: 10.1080/21505594.2021.2019950. - DOI - PMC - PubMed
    1. Mayer F.L., Wilson D., Hube B. Candida albicans Pathogenicity Mechanisms. Virulence. 2013;4:119–128. doi: 10.4161/viru.22913. - DOI - PMC - PubMed
    1. Dadar M., Tiwari R., Karthik K., Chakraborty S., Shahali Y., Dhama K. Candida albicans—Biology, Molecular Characterization, Pathogenicity, and Advances in Diagnosis and Control—An Update. Microb. Pathog. 2018;117:128–138. doi: 10.1016/j.micpath.2018.02.028. - DOI - PubMed
    1. Lamoth F., Lockhart S.R., Berkow E.L., Calandra T. Changes in the Epidemiological Landscape of Invasive Candidiasis. J. Antimicrob. Chemother. 2018;73:i4–i13. doi: 10.1093/jac/dkx444. - DOI - PMC - PubMed
    1. Wilson D. Candida albicans. Trends Microbiol. 2019;27:188–189. doi: 10.1016/j.tim.2018.10.010. - DOI - PubMed

MeSH terms