. 2024 Aug 16;25(16):8943.
doi: 10.3390/ijms25168943.

Different Prostatic Tissue Microbiomes between High- and Low-Grade Prostate Cancer Pathogenesis

Affiliations

Different Prostatic Tissue Microbiomes between High- and Low-Grade Prostate Cancer Pathogenesis

Jae Heon Kim et al. Int J Mol Sci. .

Abstract

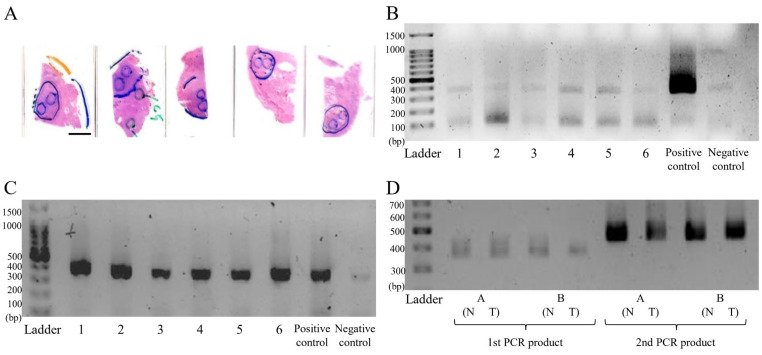
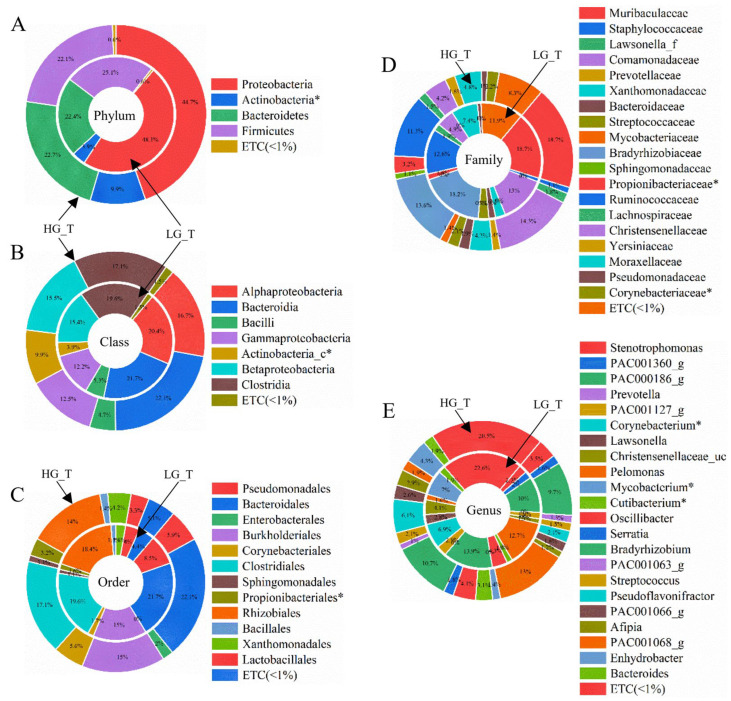
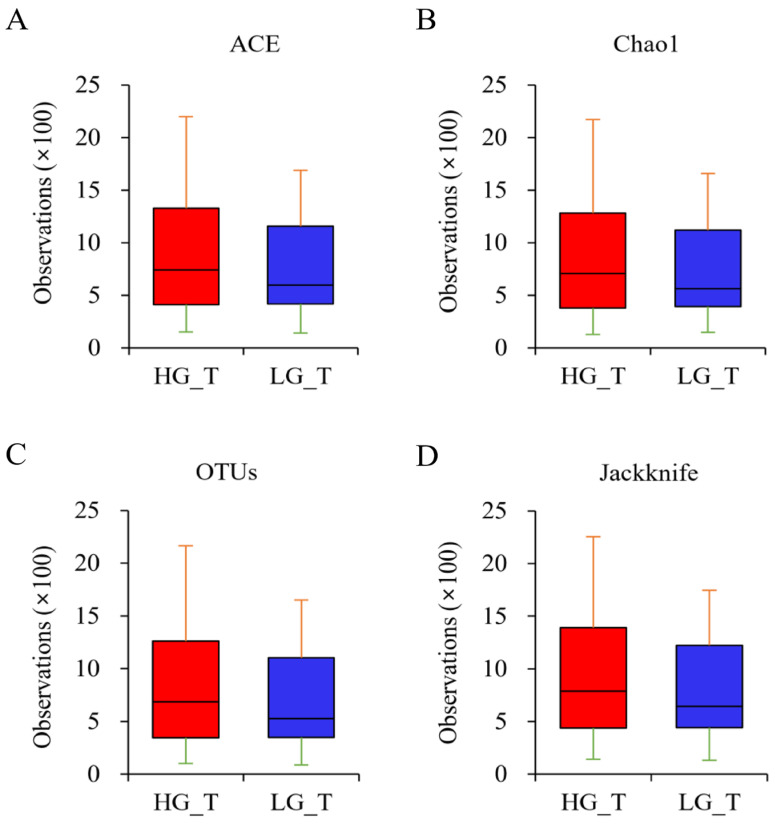
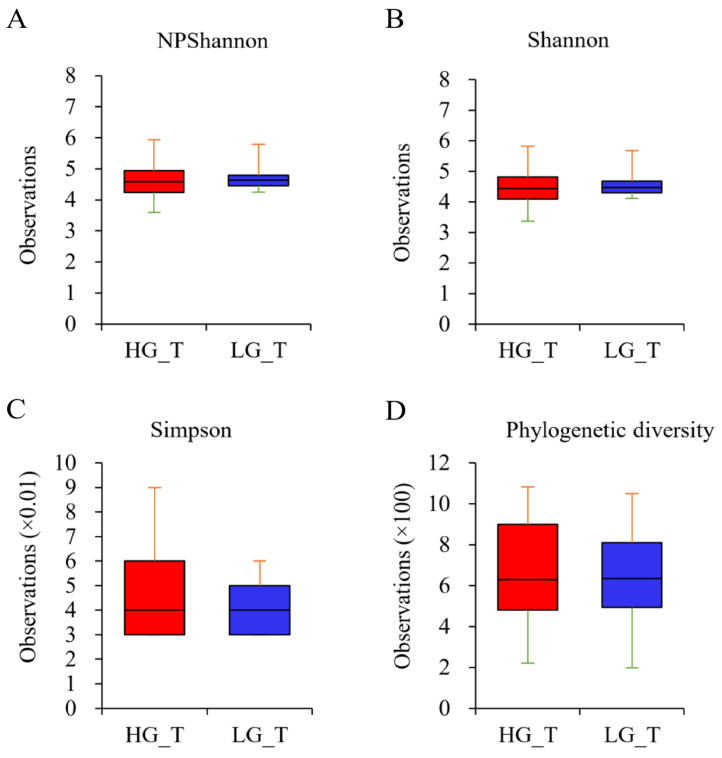
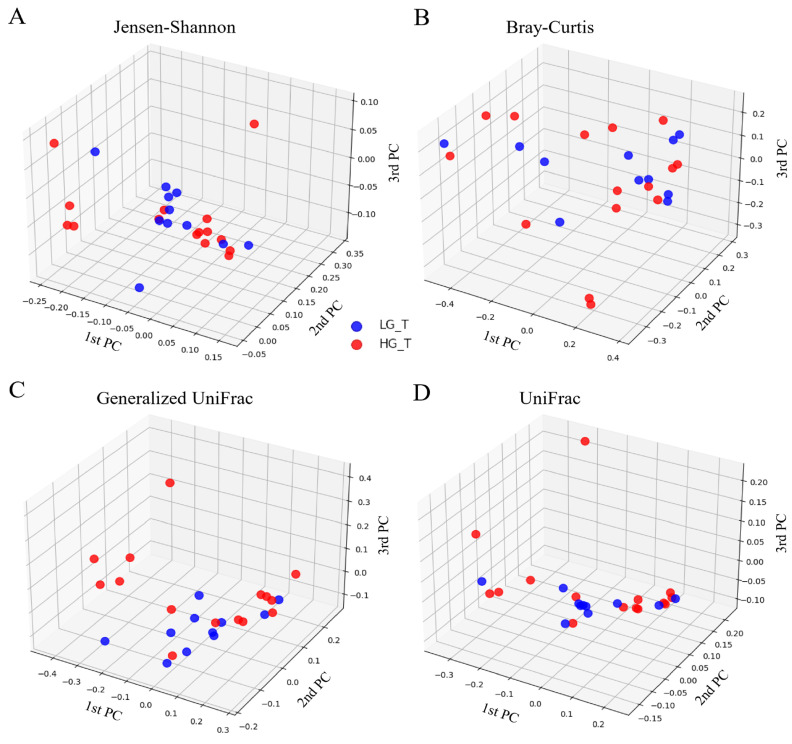
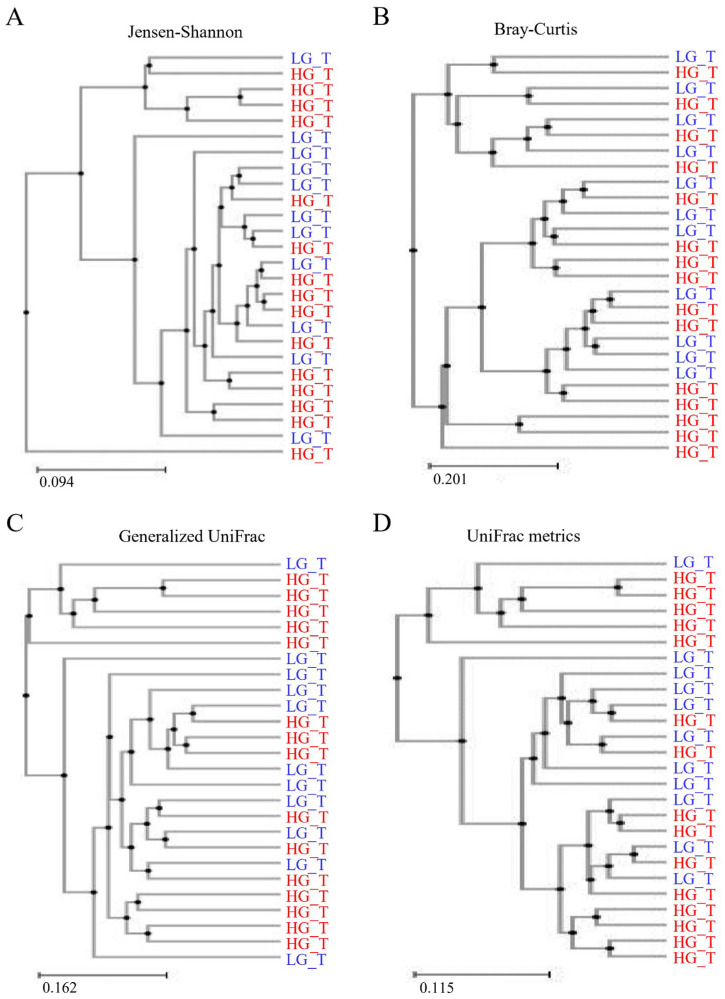
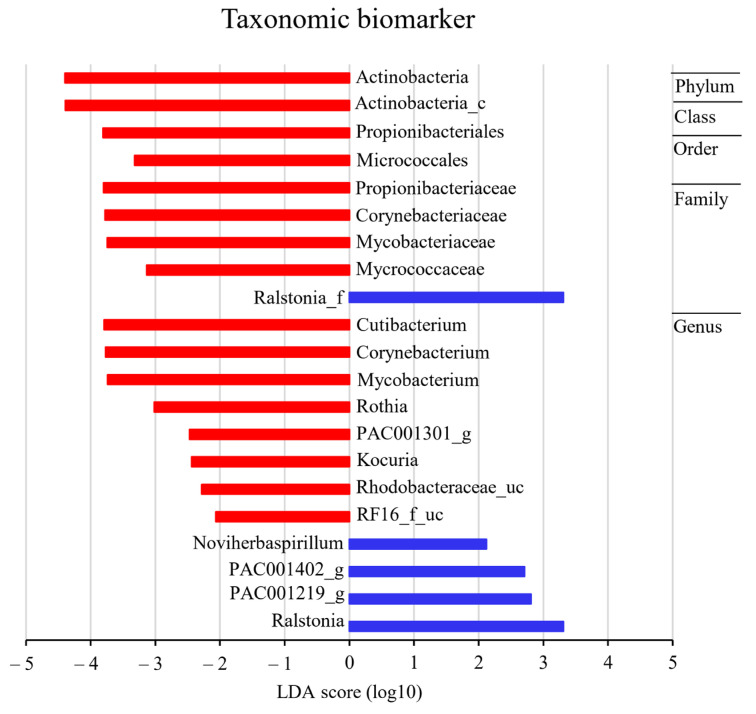
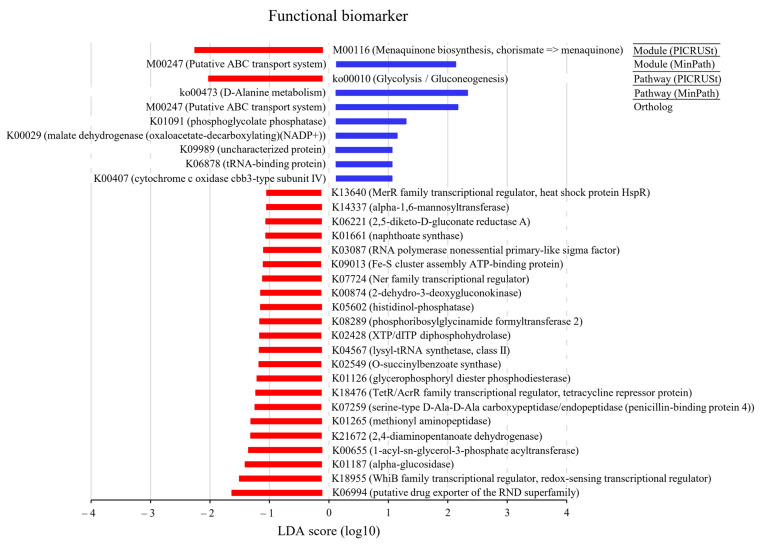
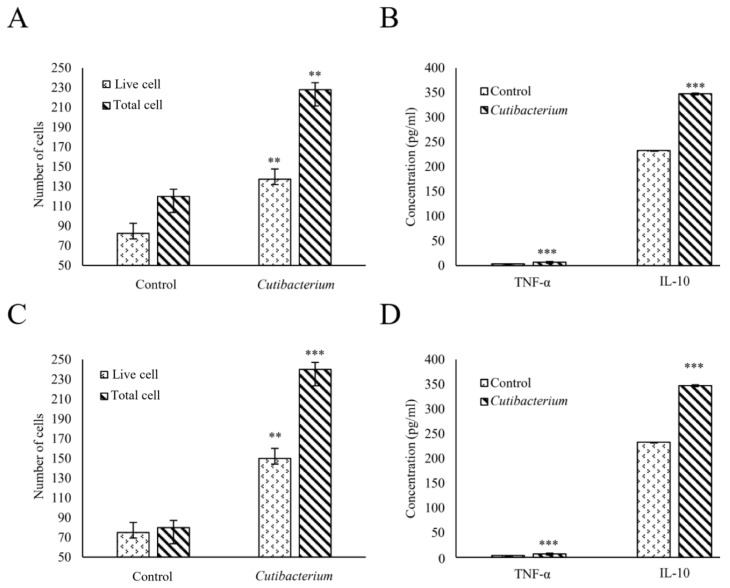
Numerous human pathologies, such as neoplasia, are related to particular bacteria and changes in microbiome constituents. To investigate the association between an imbalance of bacteria and prostate carcinoma, the microbiome and gene functionality from tissues of patients with high-grade prostate tumor (HGT) and low-grade prostate tumor (LGT) were compared utilizing next-generation sequencing (NGS) technology. The results showed abnormalities in the bacterial profiles between the HGT and LGT specimens, indicating alterations in the make-up of bacterial populations and gene functionalities. The HGT specimens showed higher frequencies of Cutibacterium, Pelomonas, and Corynebacterium genera than the LGT specimens. Cell proliferation and cytokine assays also showed a significant proliferation of prostate cancer cells and elevated cytokine levels in the cells treated with Cutibacterium, respectively, supporting earlier findings. In summary, the HGT and LGT specimens showed differences in bacterial populations, suggesting that different bacterial populations might characterize high-grade and low-grade prostate malignancies.

Keywords: Cutibacterium; biomarker; high-grade prostate tumor (HGT); low-grade prostate tumor (LGT); prostate cancer; therapeutic targets.


Conflict of interest statement

The authors have no conflicts of interest relevant to this study to disclose.

Figures

Figure 1
Figure 1
Metagenomic library construction for next-generation sequencing. (A) DNA was extracted from the formalin-fixed paraffin-embedded (FFPE) prostate tissue specimens. (B) Following this, amplicon PCR was conducted, showing poor visibility of the expected band. (C) Consequently, the PCR was repeated, showing the expected PCR size of 359 bp, similar to amplified DNA from the mice stool sample used as a positive control. (D) Subsequently, index PCR was conducted, showing the expected size of 457 bp (right panel of the image). Throughout the experiments, in every step from DNA extraction to metagenomic library construction and sequencing, all the DNA samples were quantified, adjusted, and qualified in contamination-free conditions to ensure the quality control of our experimental procedures. The scale bar on the FFPE images represents 3 cm.
Figure 2
Figure 2
Averaged taxonomic composition for tumor regions in high-grade tumor (HGT, 2–4) or low-grade tumor (LGT, 0–1) groups. The taxonomic relative abundance in the HGT and LGT groups was further classified at levels of (A) phylum, (B) class, (C) order, (D) family, and (E) genus. The data showed a significant difference in the taxonomic relative abundance between the HGT and LGT groups at the following levels: phylum, Actinobacteria; class, Actinobacteria_c; order, Propionibacteriales; family, Corynebacteriaceae and Propionibacteriaceae; and genus, Corynebacterium, Mycobacterium, and Cutibacterium. The Wilcoxon rank-sum test was used to analyze the significance of the difference between the groups (*, p < 0.05). A relative abundance of less than 1% was expressed as ETC.
Figure 3
Figure 3
Boxplot of species richness indices. The species richness in the specimens from the HGT and LGT groups was analyzed with (A) Ace, (B) Chao1, (C) OTUs, and (D) Jackknife metrics. The data showed that the richness of the bacterial community was increased in the HGT samples compared to the LGT samples, although the difference was not statistically significant. The horizontal thick black band represents the median value. The margins of the boxplot indicate the first and third quartiles.
Figure 4
Figure 4
Boxplot of species diversity indices. The species diversity was investigated for samples from the HGT and LGT groups using the (A) NPShannon, (B) Shannon, (C) Simpson, and (D) Phylogenetic diversity metrics. The diversity of the bacterial community in the LGT samples was increased compared to that in the HGT samples. However, the difference was not statistically significant. The horizontal thick black band represents the median value. The margins of the boxplot indicate the first and third quartiles.
Figure 5
Figure 5
Principal coordinate analysis (PCoA) of the bacterial communities present in the low-grade tumor group (LGT) and high-grade tumor group (HGT). The extent of the diversity of the bacterial communities was analyzed using (A) Jansen–Shannon, (B) Bray–Curtis, (C) generalized UniFrac, and (D) UniFrac metrics at the OTU level. The data showed no apparent differences in the bacterial communities between the two groups.
Figure 6
Figure 6
Clustering utilizing the Unweighted Pair Group Method with Arithmetic mean (UPGMA). The low-grade tumor (LGT) and high-grade tumor (HGT) groups were analyzed using (A) Jansen–Shannon, (B) Bray–Curtis, (C) Generalized UniFrac, and (D) UniFrac metrics. The findings suggest no significant structural difference in the bacterial communities between the HGT and LGT groups, as they did not cluster separately.
Figure 7
Figure 7
Discovery of taxonomic biomarkers for tumor (T) regions in the high-grade tumor (HGT, 2–4) or low-grade tumor (LGT, 0–1) groups using linear discriminant analysis effect size (LEfSe). The microbiota pattern between the HGT and LGT groups was analyzed using a linear discriminant analysis coupled with LEfSe. The results show the most differentially abundant taxa enriched in the microbiota, in blue for the LGT group and in red for the HGT group.
Figure 8
Figure 8
Discovery of functional biomarkers for tumor regions in the high-grade tumor (HGT, 2–4) and low-grade tumor (LGT, 0–1) groups using linear discriminant analysis effect size (LEfSe). Functional biomarkers were analyzed using ortholog, module, and pathway profiles. For module and pathway, the PICRUSt (Phylogenetic Investigation of Communities by Reconstruction of Unobserved States) and MinPath (Minimal set of Pathways) methods were applied, respectively. The KEGG (Kyoto Encyclopedia of Genes and Genomes) Database was used for the functional biomarker analysis. The data showed more abundance of the super pathway of glycolysis/gluconeogenesis in HGT than in LGT (LDA score ≤ −2). The red area indicates more abundance in the HGT group, and the blue area indicates more abundance in the LGT group.
Figure 9
Figure 9
Evaluating the impact of Cutibacterium on prostate cancer cells. The effect of Cutibacterium on prostate cancer cells was explored using DU-145 and PC-3 cells. Cutibacterium-treated (A) DU-145 cells and (C) PC-3 cells were counted using a hemocytometer, showing significantly more proliferation than the untreated cells. Concurrently, the cytokine levels were also measured, revealing significant increases in TNF-α and IL-10 in the treated (B) DU-145 and (D) PC-3 cells compared to the untreated cells. The experiments were conducted in triplicate. The results are expressed as the mean ± standard deviation. The significance between groups was determined using an unpaired Student t-test (**, p < 0.01; ***, p < 0.001).

Similar articles

Cited by

References

    1. Kudo Y., Tada H., Fujiwara N., Tada Y., Tsunematsu T., Miyake Y., Ishimaru N. Oral environment and cancer. Genes Environ. 2016;38:13. doi: 10.1186/s41021-016-0042-z. - DOI - PMC - PubMed
    1. Malvezzi M., Carioli G., Bertuccio P., Rosso T., Boffetta P., Levi F., La Vecchia C., Negri E. European cancer mortality predictions for the year 2016 with focus on leukaemias. Ann. Oncol. 2016;27:725–731. doi: 10.1093/annonc/mdw022. - DOI - PubMed
    1. Sfanos K.S., Isaacs W.B., De Marzo A.M. Infections and inflammation in prostate cancer. Am. J. Clin. Exp. Urol. 2013;1:3–11. - PMC - PubMed
    1. De Marzo A.M., Platz E.A., Sutcliffe S., Xu J.F., Grönberg H., Drake C.G., Nakai Y., Isaacs W.B., Nelson W.G. Inflammation in prostate carcinogenesis. Nat. Rev. Cancer. 2007;7:256–269. doi: 10.1038/nrc2090. - DOI - PMC - PubMed
    1. Peisch S.F., Van Blarigan E.L., Chan J.M., Stampfer M.J., Kenfield S.A. Prostate cancer progression and mortality: A review of diet and lifestyle factors. World J. Urol. 2017;35:867–874. doi: 10.1007/s00345-016-1914-3. - DOI - PMC - PubMed

LinkOut - more resources