. 2024 Aug 18;25(16):8989.
doi: 10.3390/ijms25168989.

Expression and Functional Identification of SPL6/7/9 Genes under Drought Stress in Sugarbeet Seedlings

Affiliations

Expression and Functional Identification of SPL6/7/9 Genes under Drought Stress in Sugarbeet Seedlings

Hui Wang et al. Int J Mol Sci. .

Abstract

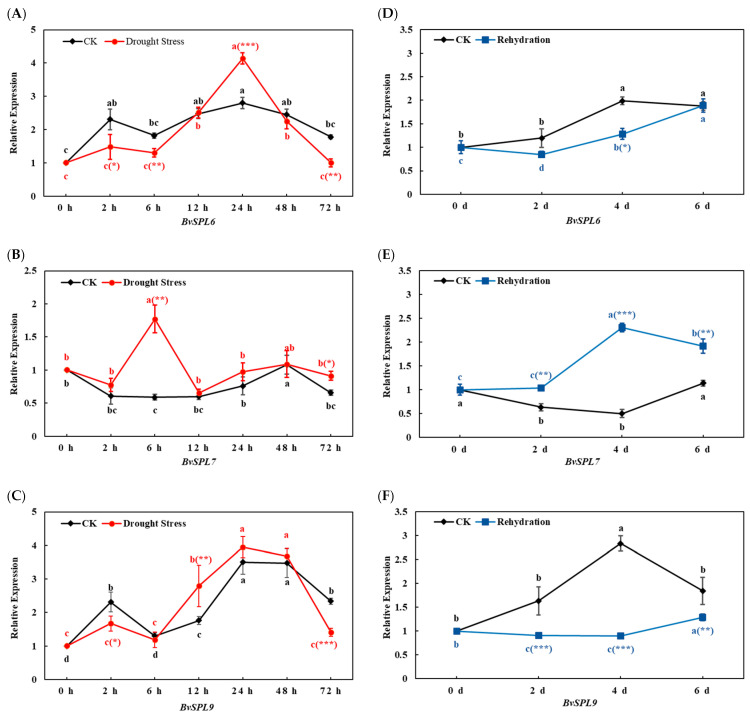
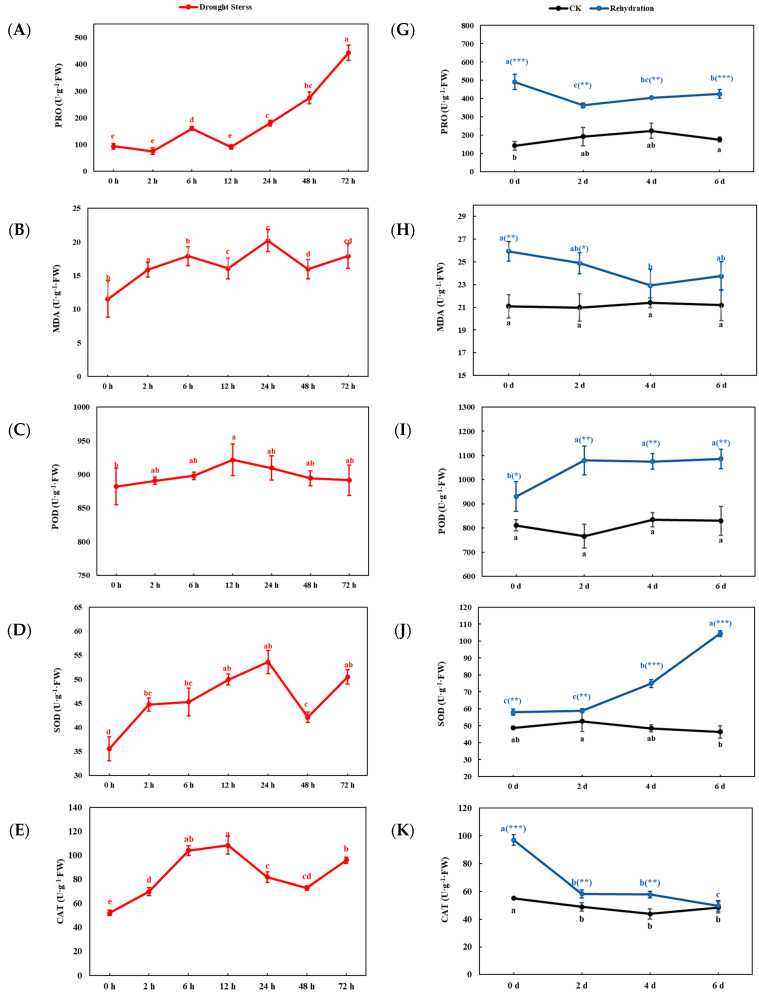
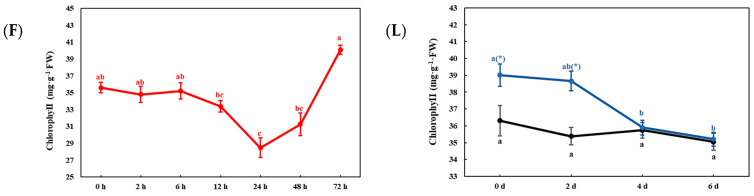
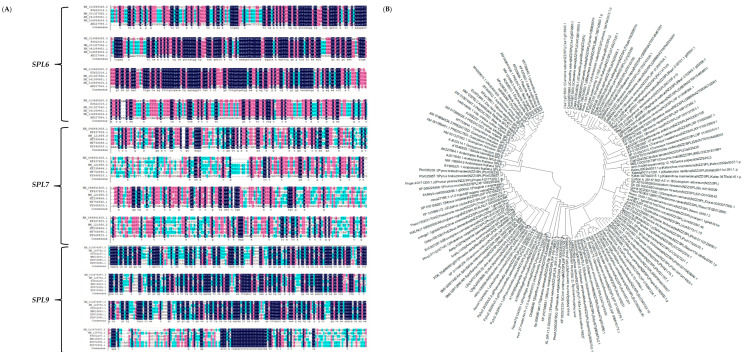
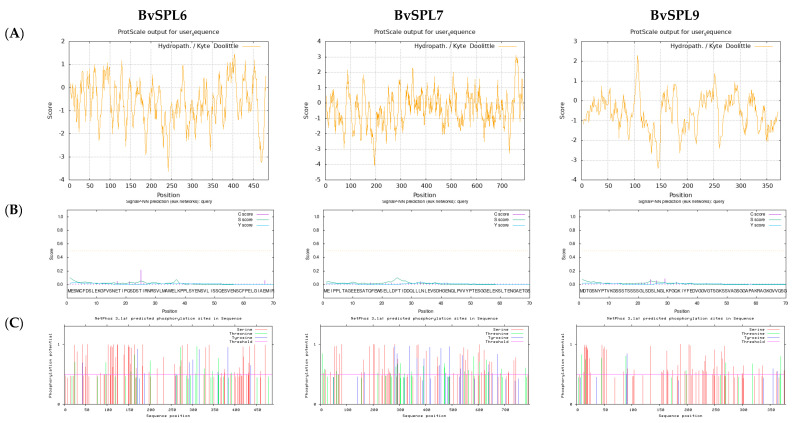
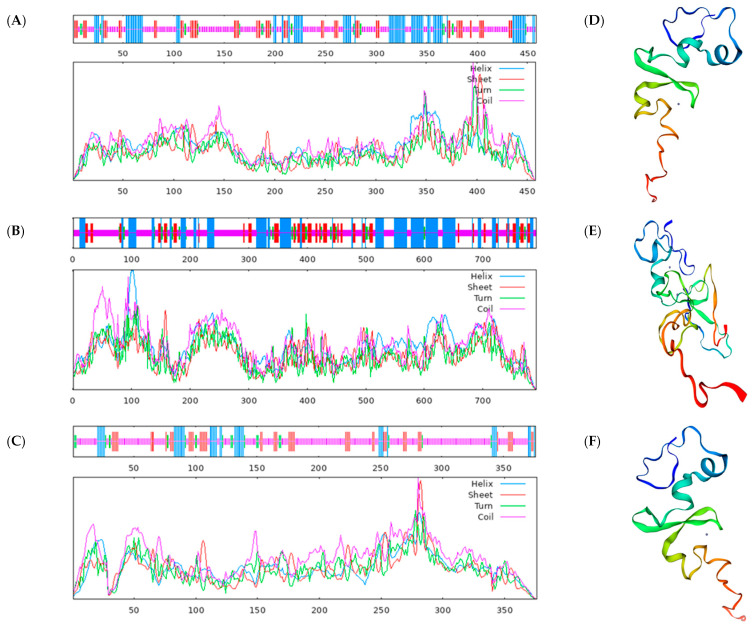
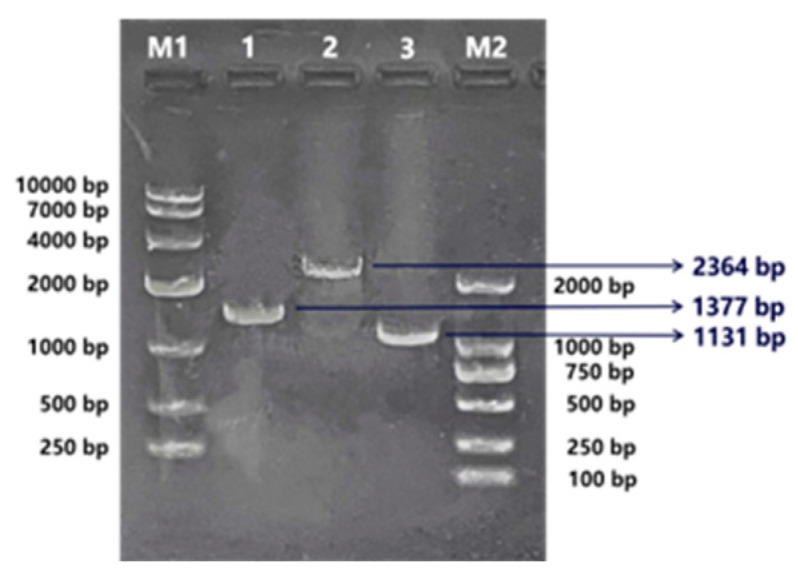
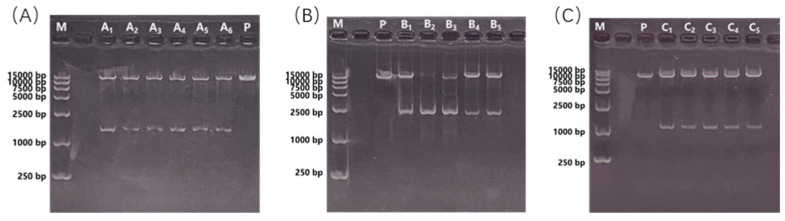
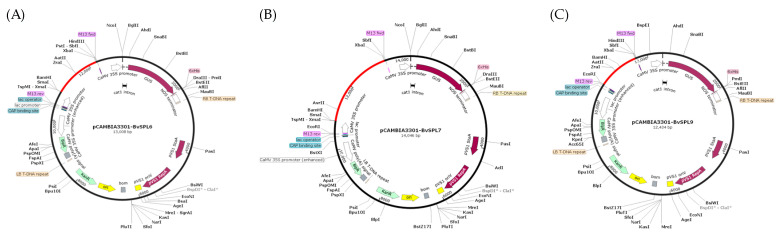
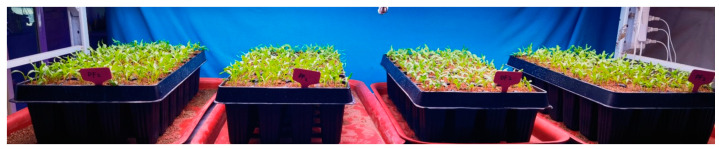
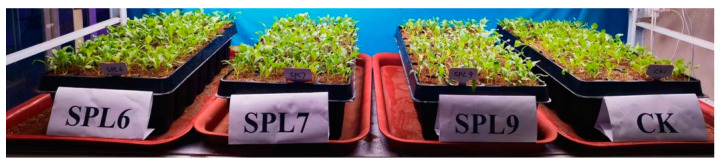
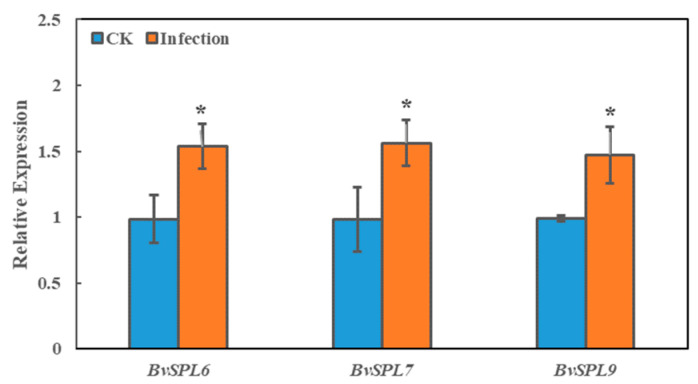
Sugar beet is a significant sugar crop in China, primarily cultivated in arid regions of the north. However, drought often affects sugar beet cultivation, leading to reduced yield and quality. Therefore, understanding the impact of drought on sugar beets and studying their drought tolerance is crucial. Previous research has examined the role of SPL (SQUAMOSA promoter-binding protein-like) transcription factors in plant stress response; however, the precise contribution of SPLs to the drought stress response in sugar beets has yet to be elucidated. In this study, we identified and examined the BvSPL6, BvSPL7, and BvSPL9 genes in sugar beets, investigating their performance during the seedling stage under drought stress. We explored their drought resistance characteristics using bioinformatics, quantitative analysis, physiological experiments, and molecular biology experiments. Drought stress and rehydration treatments were applied to sugar beet seedlings, and the expression levels of BvSPL6, BvSPL7, and BvSPL9 genes in leaves were quantitatively analyzed at 11 different time points to evaluate sugar beets' response and tolerance to drought stress. Results indicated that the expression level of the BvSPL6/9 genes in leaves was upregulated during the mid-stage of drought stress and downregulated during the early and late stages. Additionally, the expression level of the BvSPL7 gene gradually increased with the duration of drought stress. Through analyzing changes in physiological indicators during different time periods of drought stress and rehydration treatment, we speculated that the regulation of BvSPL6/7/9 genes is associated with sugar beet drought resistance and their participation in drought stress response. Furthermore, we cloned the CDS sequences of BvSPL6, BvSPL7, and BvSPL9 genes from sugar beets and conducted sequence alignment with the database to validate the results. Subsequently, we constructed overexpression vectors, named 35S::BvSPL6, 35S::BvSPL7, and 35S::BvSPL9, and introduced them into sugar beets using Agrobacterium-mediated methods. Real-time fluorescence quantitative analysis revealed that the expression levels of BvSPL6/7/9 genes in transgenic sugar beets increased by 40% to 80%. The drought resistance of transgenic sugar beets was significantly enhanced compared with the control group.

Keywords: Beta vulgaris L.; SPL; drought stress; plant stress resistance.


Conflict of interest statement

The authors declare no conflicts of interest.

Figures

Figure 1
Figure 1
Analysis of BvSPL6/7/9 gene expression in sugar beets under drought stress and rehydration treatment. Expression analysis of (A) BvSPL6, (B) BvSPL7, and (C) BvSPL9 in sugar beets under drought stress. Expression analysis of (D) BvSPL6, (E) BvSPL7, and (F) BvSPL9 in sugar beets under rehydration. The error line represents the standard deviation of three biological repetitions. Letter labeling and asterisk labeling are used to analyze, respectively, the intra-group and inter-group data significant differences. There is no significant difference among the same letter groups (p > 0.05), but there are significant differences among different letter groups (p < 0.05). *, **, and *** represent significant differences at p < 0.05, 0.01, and 0.001 levels between the CK (without drought treatment) group and the treatment groups at the same time point.
Figure 2
Figure 2
Effect of drought stress and rehydration treatment on PRO, MDA, POD, SOD, CAT, and chlorophyll content in beet leaves. (AF) The PRO, MDA, POD, SOD, CAT, and chlorophyll content in beet leaves under 0–72 h drought stress (red line). (GL) The PRO, MDA, POD, SOD, CAT, and chlorophyll content in beet leaves within 0–6 d rehydration (blue line)/CK (black line). The error line represents the standard deviation of three biological repetitions. The data of the CK group (without drought treatment) and the rehydration group at different time points are marked by the letter method of significant difference. There is no significant difference among the same letter groups (p > 0.05), but there are significant differences among different letter groups (p < 0.05). *, **, and *** represent significant differences at p < 0.05, 0.01, and 0.001 levels, respectively, between the CK group and the rehydration group at common moments.
Figure 2
Figure 2
Effect of drought stress and rehydration treatment on PRO, MDA, POD, SOD, CAT, and chlorophyll content in beet leaves. (AF) The PRO, MDA, POD, SOD, CAT, and chlorophyll content in beet leaves under 0–72 h drought stress (red line). (GL) The PRO, MDA, POD, SOD, CAT, and chlorophyll content in beet leaves within 0–6 d rehydration (blue line)/CK (black line). The error line represents the standard deviation of three biological repetitions. The data of the CK group (without drought treatment) and the rehydration group at different time points are marked by the letter method of significant difference. There is no significant difference among the same letter groups (p > 0.05), but there are significant differences among different letter groups (p < 0.05). *, **, and *** represent significant differences at p < 0.05, 0.01, and 0.001 levels, respectively, between the CK group and the rehydration group at common moments.
Figure 3
Figure 3
Sequence alignment analysis of BvSPL6/7/9 genes in sugar beets. (A) Multiple alignment of amino acid sequences encoded by miR156 target genes BvSPL6/7/9 and other plant miR156 target genes. (B) Phylogenetic tree analysis of BvmiR156 target gene and other plants miR156 target gene family.
Figure 4
Figure 4
Prediction of hydrophobicity, signal peptide and amino acid processing modification. (A) Hydrophobic analysis, (B) Signaling peptides prediction, and (C) Predicted phosphorylation sites for transcription factors BvSPL6/7/9, respectively.
Figure 5
Figure 5
Prediction of protein secondary and tertiary structures. Prediction of the secondary structure of the three transcription factors (A) BvSPL6, (B) BvSPL7, and (C) BvSPL9. Prediction of the tertiary structure of the three transcription factors (D) BvSPL6, (E) BvSPL7, and (F) BvSPL9. Blue represents α-spiral structure, red represents β-sheet, green represents β-turn and purple represents random coil.
Figure 6
Figure 6
Electrophoresis results of PCR products of cloned BvSPL6/7/9 genes. M1 is markerDL10000, M2 is markerDL2000, and 1–3 lanes are samples of cloned results. 1: BvSPL6, 2: BvSPL7, 3: BvSPL9.
Figure 7
Figure 7
Double enzyme digestion electrophoresis results of BvSPL6/7/9 gene expression vectors. M is 15,000 bp Maker, P is an empty plasmid pCAMBIA3301 as a control, A1–A6, B1–B5, and C1–C5 are double enzyme digestion results. (A) BvSPL6, (B) BvSPL7, (C) BvSPL9.
Figure 8
Figure 8
Map of BvSPL6/7/9 gene expression vectors (A) pCAMBIA3301-BvSPL6, (B) pCAMBIA3301-BvSPL7, and (C) pCAMBIA3301-BvSPL9.
Figure 9
Figure 9
Sugar beet seedlings before transient infection by Agrobacterium tumefaciens.
Figure 10
Figure 10
Sugar beet seedlings infected by Agrobacterium tumefaciens for 7 days.
Figure 11
Figure 11
Overexpression of BvSPL6/7/9 genes in leaves of transgenic sugar beet seedlings. The error line and * represent the standard deviation of the three biological repetitions and a significant difference at the p < 0.05 level, respectively.
Figure 12
Figure 12
Phenotypes of transgenic sugar beet seedlings under drought stress treatment. (AC) represent drought treatment with 15% PEG6000 for 0 h, 24 h, and 48 h, respectively. The four sugar beet seedlings from left to right corresponded to CK seedling, BvSPL6, BvSPL7, and BvSPL9 overexpressing seedlings, respectively.

Similar articles

Cited by

References

    1. Zou C., Liu D., Wu P., Wang Y., Gai Z., Liu L., Yang F., Li C., Guo G. Transcriptome analysis of sugarbeet (Beta vulgaris L.) in response to alkaline stress. Plant Mol. Biol. 2020;102:645–657. doi: 10.1007/s11103-020-00971-7. - DOI - PubMed
    1. Zhang Q., Yao Y., Li Y., Huang J., Ma Z., Wang Z., Wang S., Wang Y., Zhang Y. Causes and Changes of Drought in China: Research Progress and Prospects. J. Meteorol. Res. 2020;34:460–481. doi: 10.1007/s13351-020-9829-8. - DOI
    1. Yu X., Zhang L., Zhou T., Zhang X. Long-term changes in the effect of drought stress on ecosystems across global drylands. Sci. China Earth Sci. 2023;66:146–160. doi: 10.1007/s11430-022-1001-0. - DOI
    1. He F., Long R., Wei C., Zhang Y., Li M., Kang J., Yang Q., Wang Z., Chen L. Genome-wide identification, phylogeny and expression analysis of the SPL gene family and its important role in salt stress in Medicago sativa L. BMC Plant Biol. 2022;22:295. doi: 10.1186/s12870-022-03678-7. - DOI - PMC - PubMed
    1. Wang H., Wang H. The miR156/SPL Module, a Regulatory Hub and Versatile Toolbox, Gears up Crops for Enhanced Agronomic Traits. Mol. Plant. 2015;8:677–688. doi: 10.1016/j.molp.2015.01.008. - DOI - PubMed

MeSH terms

LinkOut - more resources