. 2024 Aug 19;25(16):9006.
doi: 10.3390/ijms25169006.

A Simple Expression for the Screening of Excitonic Couplings between Chlorophylls as Inferred for Photosystem I Trimers

Affiliations

A Simple Expression for the Screening of Excitonic Couplings between Chlorophylls as Inferred for Photosystem I Trimers

Matthias Eder et al. Int J Mol Sci. .

Abstract

The Coulomb coupling between transition densities of the pigments in photosynthetic pigment-protein complexes, termed excitonic coupling, is a key factor for the description of optical spectra and energy transfer. A challenging question is the quantification of the screening of the excitonic coupling by the optical polarizability of the environment. We use the equivalence between the sophisticated quantum chemical polarizable continuum (PCM) model and the simple electrostatic Poisson-TrEsp approach to analyze the distance and orientation dependence of the dielectric screening between chlorophylls in photosystem I trimers. On the basis of these calculations we find that the vacuum couplings Vmn(0) and the couplings in the dielectric medium Vmn=fmnVmn(0) are related by the empirical screening factor fmn=0.60+39.6θ(|κmn|-1.17)exp(-0.56Rmn/Å), where κmn is the usual orientational factor of the dipole-dipole coupling between the pigments, Rmn is the center-to-center distance, and the Heaviside-function θ(|κmn|-1.17) ensures that the exponential distance dependence only contributes for in-line type dipole geometries. We are confident that the present expression can be applied also to other pigment-protein complexes with chlorophyll or related pigments of similar shape. The variance between the Poisson-TrEsp and the approximate coupling values is found to decrease by a factor of 8 and 3-4 using the present expression, instead of an exponential distance dependent or constant screening factor, respectively, assumed previously in the literature.

Keywords: chlorophylls; dielectric screening; excitonic couplings; light-harvesting antenna.


Conflict of interest statement

The authors declare no conflicts of interest.

Figures
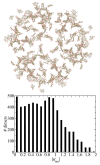
Figure 1
Figure 1
(Upper part): Chlorophyll pigments of PSI trimer [12]. (Lower part): Number of pigment pairs in PSI as a function of the absolute magnitude of their orientational factor κmn (Equation (1)). Structure drawn with Blender [13].
Figure 2
Figure 2
Illustration of two-cavity model (left part) and many-cavity model (right part). When the excitonic coupling between pigments m and n is calculated in the two-cavity model, the whole environment is being treated as a homogeneous dielectric. In the many-cavity model the remaining pigment cavities of the photosystem are treated as non-polarizable. For further explanation see text.
Figure 3
Figure 3
Screening factors fmn of excitonic couplings Vmn between chlorophylls in PSI trimer as a function of center-to-center distance Rmn, obtained in the many-cavity model (upper part) are compared to those obtained in the two-cavity model (lower part). The points are color-coded according to their excitonic coupling Vmn(0) obtained without environment, as quantified in the legend.
Figure 4
Figure 4
Same as in Figure 3, but sorted according to pigment orientations in the pairs, upper panels: group 1, middle panels: group 2, lower panels: group 3. Groups are defined in Table 2. The left and the right colums contain the results obtained in the two- and the many-cavity model, respectively (lower and upper panel in Figure 3). The black-dashed lines in the middle and lower panels describe a fit of the data with Equations (23) and (24), respectively.
Figure 5
Figure 5
Variance σ2 between Poisson-TrEsp coupling Vmn(PTrEsp) and the approximate coupling Vmn(ϵ=1)fmn(4) (Equation (26)), obtained for different values κ0. The lowest σ2 value is obtained for κ0=1.17, marked by a horizontal dashed line. This value is used in the screening function fmn(4) in Equation (26), as indicated by the lowest horizontal blue-dashed line. The remaining screening functions fmn(2) (Equation (23)) and fmn(3) (Equation (24)) follow for the limiting situations κ0=2 and κ0=0, respectively, as shown by the middle and upper horizontal blue-dashed lines.
Figure 6
Figure 6
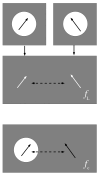
Illustration of two spherical-cavity models, with point-transition dipoles in the center, representing two pigments. In the first model (upper and middle panels) both dipoles (black arrows) are situated in empty spherical cavities, but in the solution of the Poisson equation for the electrostatic potential only one cavity is taken into account (top panel). The two cavity dipoles are then mapped onto two effective dipoles (white arrows) without cavity and the coupling of the latter in the dielectric medium is considered (middle panel), revealing the screening factor fL (Equation (30)). The second model neglects the spherical cavity of one pigments in, both, the solution of the Poisson equation and the calculation of the screening (lower panel), resulting in the screening factor fC (Equation (31)).
Figure 7
Figure 7
Two chlorophyll a pigments in in-line (upper part) and sandwich (lower part) configurations. The purple arrows indicate directions in which one pigment is translated in the model calculations without changing the orientational factor. The yellow arrow in the lower figure denotes an alternative translation direction, also investigated in the coupling calculations. The solid blue line in the right pigment of the upper part and the upper pigment in the lower part indicates a rotation axis, used to investigate further intermolecular orientations. The dashed black arrow in the center of the pigments indicates the direction of transition dipole moment.
Figure 8
Figure 8
(Upper part): Screening factors fmn calculated for different configurations (center-to-center distances Rmn) of the model dimer, obtained from the sandwich and the in-line dimer in Figure 7 by displacing one pigment along the vector connecting the pigment centers (the violet arrows in Figure 7). (Lower left part): Same as in upper part but for conformations obtained by rotating one pigment by an angle φ around an axis perpendicular to its transition dipole moment (the blue line in the upper and lower part of Figure 7), where φ=0 refers to the original orientation. The dashed lines show the screening factor obtained by using the empirical expression in Equation (26). (Lower right part): Excitonic couplings in vacuum (Vmn(0)=Vmn(ϵ=1), black line) and dielectric medium (Vmn=Vmn(ϵ=2), red line) and screening factors (fmn, blue dots) calculated for different configurations, obtained from the lower dimer in Figure 7 by displacing the upper pigment along the yellow arrow by ΔXmn, where ΔXmn=0 corresponds to the sandwich geometry shown in this figure. The vertical dashed lines mark the positions of the singularities of fmn, where Vmn(0)=0 and Vmn0.
Figure 9
Figure 9
Screening factors fmn as a function of inter molecular distance, obtained for in-line (black curves) and sandwich (red curves) geometries of transition dipole moments, using different approximations for the shape and number of molecular cavities and the transition density. Solid lines are obtained for two spherical cavities with two point dipoles, dotted lines for one molecular cavity with one point dipole and another point dipole without cavity, dashed lines for two molecular cavities with extended dipoles, and dot-dashed lines for one extended dipole in a molecular cavity and another extended dipole without cavity. A dipole extend of 8.7 Å and a cavity radius of 5.8 Å were used, as inferred from electrostatic calculations of dispersive transition energy shifts on a related molecule (bacteriochlorophyll a) [61].

References

    1. Nogales E. The development of cryo-EM into a mainstream structural biology technique. Nat. Methods. 2016;13:24–27. doi: 10.1038/nmeth.3694. - DOI - PMC - PubMed
    1. Cheng Y. Single-particle cryo-EM—How did it get here and where will it go. Science. 2018;361:876–880. doi: 10.1126/science.aat4346. - DOI - PMC - PubMed
    1. Croce R., van Amerongen H. Light harvesting in oxygenic photosynthesis: Structural biology meets spectroscopy. Science. 2020;369:933. doi: 10.1126/science.aay2058. - DOI - PubMed
    1. Pi X., Zhao S.H., Wang W.D., Liu D.S., Xu C.Z., Han G.Y., Kuang T.Y., Sui S.F., Shen J.R. The pigment-protein network of a diatom photosystem II-light-harvesting antenna supercomplex. Science. 2019;365:463. doi: 10.1126/science.aax4406. - DOI - PubMed
    1. Xie H., Lyratzakis A., Khera R., Kountantou M., Welsch S., Michel H., Tsiotis G. Cryo-EM structure of the whole photosynthetic reaction center apparatus from the green sulfur bacterium Chlorobaculum tepidum. Proc. Natl. Acad. Sci. USA. 2023;120:e2216734120. doi: 10.1073/pnas.2216734120. - DOI - PMC - PubMed

MeSH terms

LinkOut - more resources