. 2024 Aug 20;25(16):9024.
doi: 10.3390/ijms25169024.

A Fungicide, Fludioxonil, Formed the Polyploid Giant Cancer Cells and Induced Metastasis and Stemness in MDA-MB-231 Triple-Negative Breast Cancer Cells

Affiliations

A Fungicide, Fludioxonil, Formed the Polyploid Giant Cancer Cells and Induced Metastasis and Stemness in MDA-MB-231 Triple-Negative Breast Cancer Cells

Ryeo-Eun Go et al. Int J Mol Sci. .

Abstract

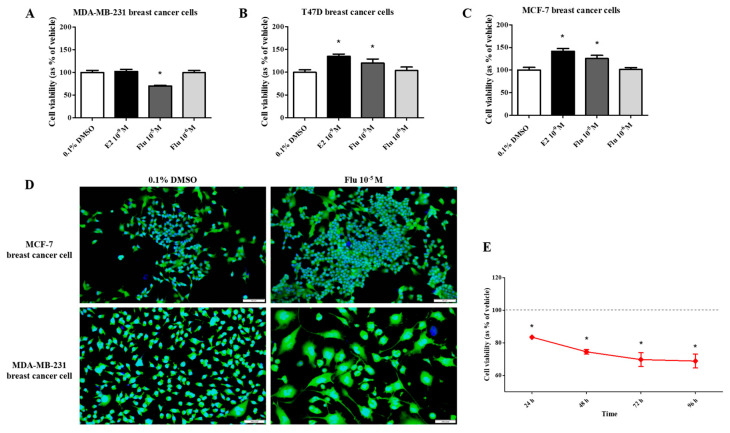
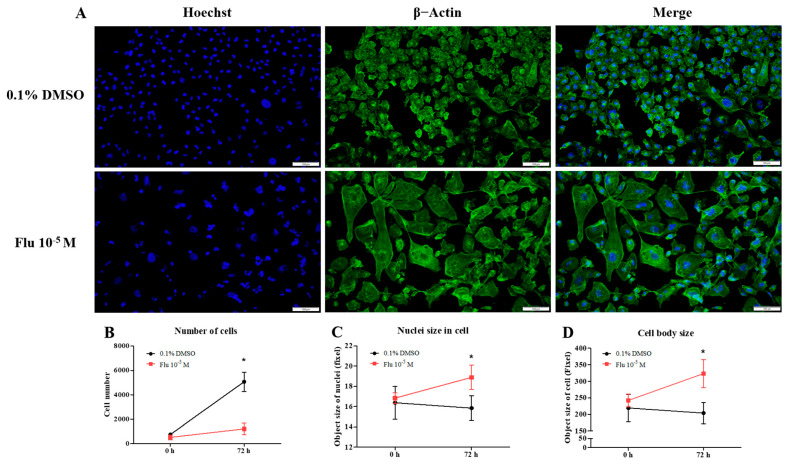
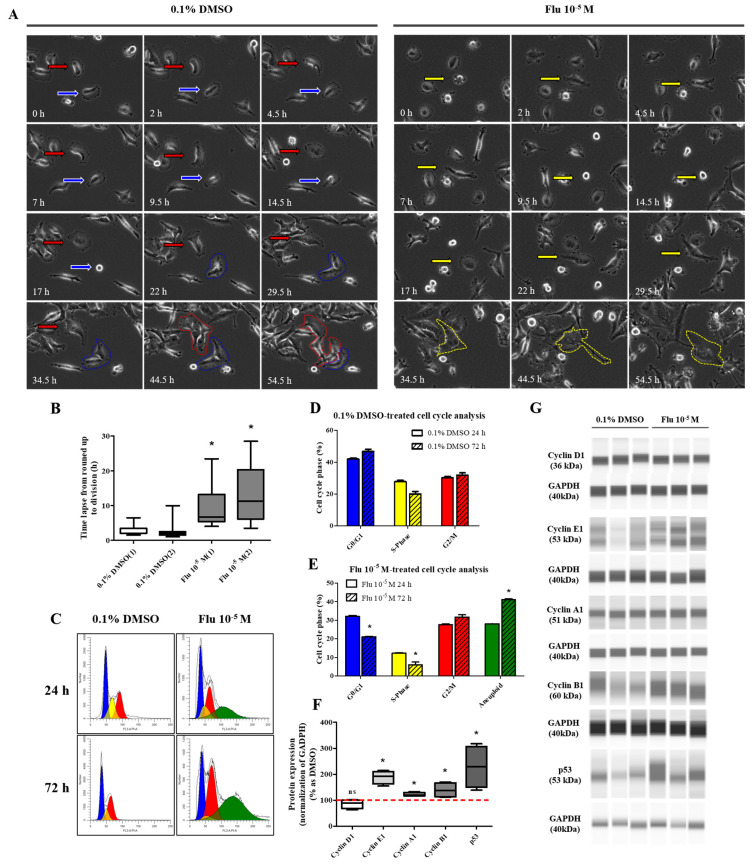
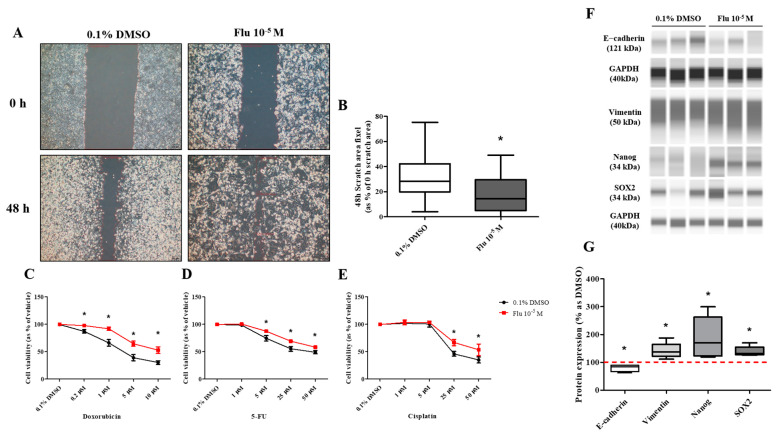
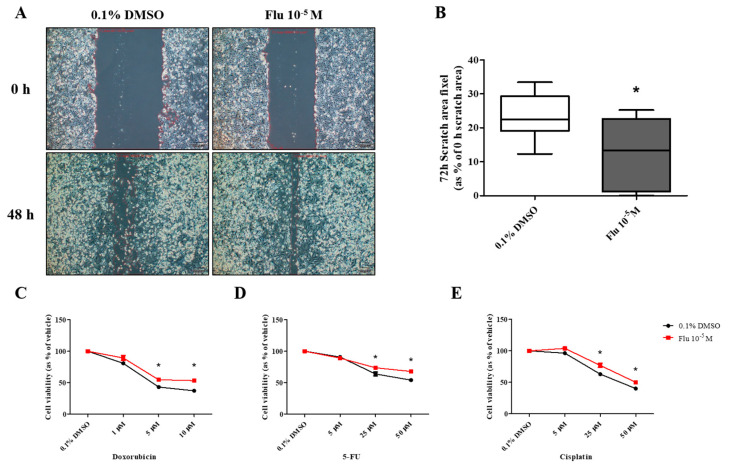
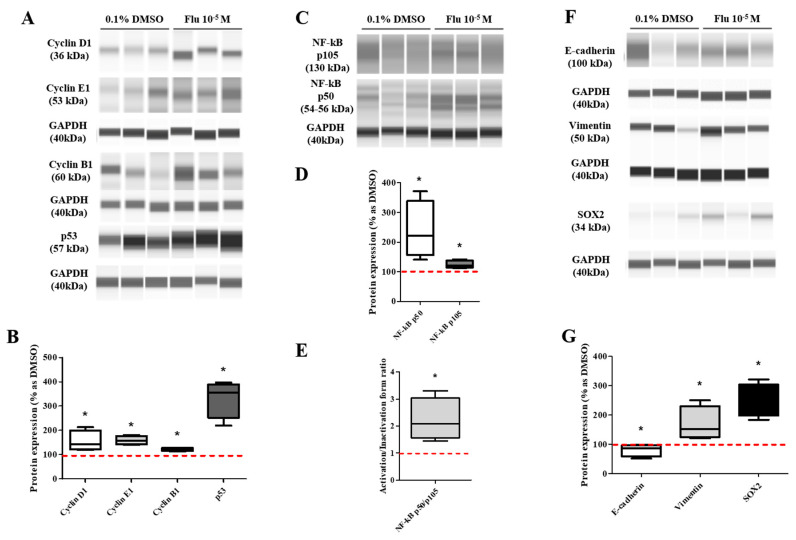
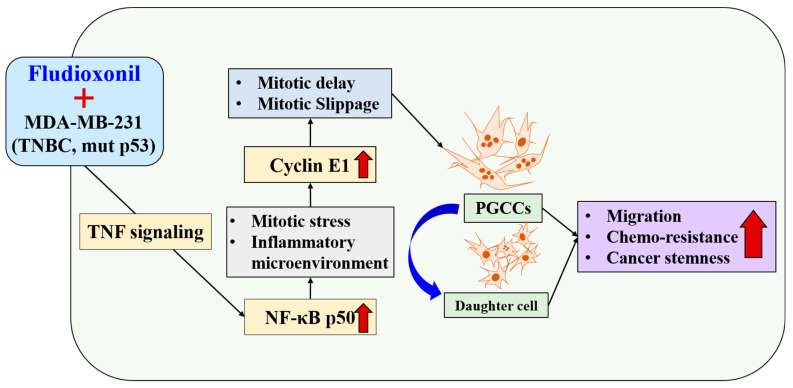
Fludioxonil, an antifungal agent used as a pesticide, leaves a measurable residue in fruits and vegetables. It has been identified to cause endocrine disruption, interrupt normal development, and cause various diseases such as cancers. In this study, fludioxonil was examined for its effects on the development and metastasis of breast cancer cells. On fludioxonil exposure (10-5 M) for 72 h, mutant p53 (mutp53) MDA-MB-231 triple-negative breast cancer (TNBC) cells significantly inhibited cell viability and developed into polyploid giant cancer cells (PGCCs), with an increase in the number of nuclei and expansion in the cell body size. Fludioxonil exposure disrupted the normal cell cycle phase ratio, resulting in a new peak. In addition, PGCCs showed greater motility than the control and were resistant to anticancer drugs, i.e., doxorubicin, cisplatin, and 5-fluorouracil. Cyclin E1, nuclear factor kappa B (NF-κB), and p53 expressions were remarkably increased, and the expression of cell cycle-, epithelial-mesenchymal-transition (EMT)-, and cancer stemness-related proteins were increased in the PGCCs. The daughter cells obtained from PGCCs had the single nucleus but maintained their enlarged cell size and showed greater cell migration ability and resistance to the anticancer agents. Consequently, fludioxonil accumulated Cyclin E1 and promoted the inflammatory cytokine-enriched microenvironment through the up-regulation of TNF and NF-κB which led to the transformation to PGCCs via abnormal cell cycles such as mitotic delay and mitotic slippage in mutp53 TNBC MDA-MB-231 cells. PGCCs and their daughter cells exhibited significant migration ability, chemo-resistance, and cancer stemness. These results strongly suggest that fludioxonil, as an inducer of potential genotoxicity, may induce the formation of PGCCs, leading to the formation of metastatic and stem cell-like breast cancer cells.

Keywords: TNBC; fludioxonil; fungicide; polyploid giant cancer cell.


Conflict of interest statement

The authors do not have any conflicts of interest to declare.

Figures

Figure 1
Figure 1
Effect of cell viability by applying the WST assay and DAPI and actin staining after treatment with fludioxonil in MDA-MB-231, T-47D, and MCF-7 breast cancer cells. The cell viability assay was conducted after treatment with fludioxonil for 72 h in (A) MDA-MB-231, (B) T-47D, and (C) MCF-7 breast cancer cells. (D) The image presents the difference in cell viability by treatment with fludioxonil for 72 h in MCF-7 and MDA-MB-231 breast cancer cells. (E) The cell viability of MDA-MB-231 breast cancer cells by treatment with fludioxonil was changed in a time-dependent manner. Flu: fludioxonil; E2: 17β-estradiol. DMSO was used as the vehicle control, and the value of the control containing 0.1% DMSO was set as 100%. Data in the graphs are obtained from at least three repeated experiments and are presented as the mean ± SEM. Statistical analysis was determined by (AC) one-way ANOVA followed by Dunnett’s multiple comparison and (E) two-way ANOVA followed by the Bonferroni posttests using the GraphPad Prism 5.01 software. p < 0.05 was considered statistically significant. *: p < 0.05 compared to control. Scale bar = 100 μm or 200 pixels.
Figure 2
Figure 2
Change of cell morphology after treatment with fludioxonil in MDA-MB-231 breast cancer cells. (A) The cell morphology of MDA-MB-231 breast cancer cells after they were treated with fludioxonil for 72 h and were stained with DAPI and actin. These images were analyzed to count (B) nuclei number and to measure the (C) size of nuclei and (D) cell body. Flu: fludioxonil; E2: 17β-estradiol. DMSO was used as the vehicle control, and the value of the control containing 0.1% DMSO was set as 100%. Data in the graphs are obtained from at least three repeated experiments and are presented as the mean ± SEM. Statistical analysis was determined by (BD) two-way ANOVA followed by Bonferroni posttests using the GraphPad Prism 5.01 software. *: p < 0.05 compared to control. Scale bar = 100 μm or 200 pixels.
Figure 3
Figure 3
Display of live-cell images in time-dependent manner, as well as the change in cell-cycle and related proteins of MDA-MB-231 breast cancer cells after exposed of 0.1% DMSO or fludioxonil. (A) The cells after seeding were treated with fludioxonil for 72 h. During that time, the real-time videos of cells were recorded using BioTek Lionheart FX automated microscope. Blue arrow and line: normal cell division. Red arrow and line: temporarily abnormal cell division. Yellow arrow and line: production of PGCC. (B) Based on these videos, the time lapse from cells’ round-up to division was counted and displayed on the graph. (C) The cells were analyzed for the cell cycle after being treated with the 0.1% DMSO or fludioxonil for 72 h, which were displayed in the graph (D,E). The change of cell cycle-related proteins was analyzed using Jess from Protein Simple (F,G). Flu: fludioxonil. DMSO was used as the vehicle control, and the value of the control containing 0.1% DMSO was set as 100%. Data in the graphs are obtained from at least three repeated experiments and are presented as the mean ± SEM. Statistical analysis was determined by (B) one-way ANOVA followed by Dunnett’s multiple comparison, (D,E) two-way ANOVA followed by Bonferroni posttests, and (F) t-test (paired test) using the GraphPad Prism 5.01 software. p < 0.05 was considered statistically significant. *: p < 0.05 compared to control.
Figure 4
Figure 4
Effects of cell migration ability and chemo-resistance by applying the scratch assay and WST assay after treatment with 0.1% DMSO or fludioxonil in MDA-MB-231 breast cancer cells. (A) Cells were incubated for 2 days after seeding and scratched using a 1000 μL tip. After washing twice, the cells were treated by 0.1% DMSO or fludioxonil in the media for 48 h. (B) The value was presented in the graph. Cells were incubated for 2 days after seeding and treated each with (C) doxorubicin, (D) 5-FU, and (E) cisplatin for 72 h to confirm the chemo-resistance. (F,G) The changes of epithelial marker-related proteins were analyzed using Jess from Protein Simple. Flu: fludioxonil, DMSO was used as the vehicle control, and the value of the control containing 0.1% DMSO was set as 100%. Data in the graphs are obtained from at least three repeated experiments and are presented as the mean ± SEM. Data in the graphs are obtained from at least three repeated experiments and are presented as the mean ± SEM. Statistical analysis was determined by (B) one-way ANOVA followed by Dunnett’s multiple comparison, (CE) two-way ANOVA followed by Bonferroni posttests, and (G) t-test (paired test) using the GraphPad Prism 5.01 software. p < 0.05 was considered statistically significant. *: p < 0.05 compared to control. Scale bar = 200 μm.
Figure 5
Figure 5
Gene Ontology enrichment analysis of DEGs and qPCR of related genes, and the expression change of TNF pathway-related proteins after treatment with 0.1% DMSO or fludioxonil in MDA-MB-231 breast cancer cells. The DEGs treated with 0.1% DMSO or fludioxonil were analyzed for enrichment in three ontologies: (A,B) GO biological process and (C,D) KEGG pathway using Shiny GO 0.77. (E) The change in TNF signaling-related gene expression was confirmed using real-time PCR. (F) Based on the results of DEGs, the cancer-related gene with a high expression of fold change was confirmed using real-time PCR. (G,H) The change in major pathway-related proteins expression was confirmed using Jess from Protein Simple. (I) The activity of 1/2ERK and NF-κB was separately graphed as the ratio of inactivation form to active form. Flu: fludioxonil, DMSO was used as the vehicle control, and the value of the control containing 0.1% DMSO was set as 100%. Data in the graphs are obtained from at least three repeated experiments and are presented as the mean ± SEM. Statistical analysis was determined by (E,F) t-test (paired test) using the GraphPad Prism 5.01 software. p < 0.05 was considered statistically significant. *: p < 0.05 compared to control.
Figure 6
Figure 6
The acquisition process and morphology changes of daughter cells after treatment with 0.1% DMSO or fludioxonil in MDA-MB-231 breast cancer cells. (A) The daughter cells were passage-3 cells after being exposed to 0.1% DMSO or fludioxonil for 72 h. The cells were subcultured 1.0 × 10⁵ cells/dish and incubated for 7 days. This process was repeated twice. The yellow line is borderline of small colony that newly formed after treatment of fludioxonil for 72h. (B) The images of daughter cells were of morphology following different cell densities. (C) The graph was present the difference of nuclear size after subculturing three times following exposure of 0.1% DMSO or fludioxonil. Flu: fludioxonil, DMSO was used as the vehicle control, and the value of the control containing 0.1% DMSO was set as 100%. Data in the graphs are obtained from at least three repeated experiments and are presented as the mean ± SEM. Statistical analysis was determined by (C) one-way ANOVA followed by Dunnett’s multiple comparison using the GraphPad Prism 5.01 software. p < 0.05 was considered statistically significant. *: p < 0.05 compared to control. Upper image scale bar = 200 μm, lower image scale bar = 50 μm.
Figure 7
Figure 7
Effects of cell migration ability and chemo-resistance by applying the scratch assay and WST assay on daughter cells of MDA-MB-231 breast cancer cells after treatment with 0.1% DMSO or fludioxonil for 72 h. (A) Cells were incubated for 2 days after seeding and scratched using a 1000 μL tip. After washing twice, the cells were incubated for 48 h, (B) and the value was presented in the graph. To establish the chemo-resistance, cells were incubated for 2 days after seeding and treated each with (C) doxorubicin, (D) 5-FU, and (E) cisplatin for 72 h. Flu: fludioxonil, DMSO was used as the vehicle control, and the value of the control containing 0.1% DMSO was set as 100%. Data in the graphs are obtained from at least three repeated experiments and are presented as the mean ± SEM. Statistical analysis was determined by (B) one-way ANOVA followed by Dunnett’s multiple comparison and (CE) two-way ANOVA followed by Bonferroni posttests using the GraphPad Prism 5.01 software. p < 0.05 was considered statistically significant. *: p < 0.05 compared to control. Scale bar = 50 μm or 100 pixels.
Figure 8
Figure 8
Effects of protein expression on daughter cells of MDA-MB-231 breast cancer cells. These cells were analyzed for protein expressions such as cell cycle-related (A,B), NF-κB-related (CE), EMT-related and stemness-related proteins (F,G). Flu: fludioxonil, DMSO was used as the vehicle control, and the value of the control containing 0.1% DMSO was set as 100%. Data in the graphs are obtained from at least three repeated experiments and are presented as the mean ± SEM. Statistical analysis was determined by (BG) t-test (paired test) compare with 0.1% DMSO using the GraphPad Prism 5.01 software. p < 0.05 was considered statistically significant. *: p < 0.05 compared to control.
Figure 9
Figure 9
Fludioxonil induced the transformation process to PGCCs on p53mut MDA-MB-231 breast cancer cells via TNF with NF-κB signaling. Fludioxonil caused accumulation of the Cyclin E1 and promotion of the inflammatory cytokine-enriched microenvironment via up-regulation of TNF and NF-κB, and it led to the transformation to PGCCs via mitotic delay and mitotic slippage in mut p53mut TNBC MDA-MB-231 cells. PGCCs and their daughter cells had outstanding migration ability, chemo-resistance, and cancer stemness (red arrow: increasing of expression or ability, blue arrow: production of daughter cell in PGCCs).

Similar articles

Cited by

References

    1. Davoli T., de Lange T. The causes and consequences of polyploidy in normal development and cancer. Annu. Rev. Cell Dev. Biol. 2011;27:585–610. doi: 10.1146/annurev-cellbio-092910-154234. - DOI - PubMed
    1. Liu Z., Yue S., Chen X., Kubin T., Braun T. Regulation of Cardiomyocyte Polyploidy and Multinucleation by CyclinG1. Circ. Res. 2010;106:1498–1506. doi: 10.1161/CIRCRESAHA.109.211888. - DOI - PubMed
    1. Song Y., Zhao Y., Deng Z., Zhao R., Huang Q. Stress-Induced Polyploid Giant Cancer Cells: Unique Way of Formation and Non-Negligible Characteristics. Front. Oncol. 2021;11:724781. doi: 10.3389/fonc.2021.724781. - DOI - PMC - PubMed
    1. Vasan N., Toska E., Scaltriti M. Overview of the relevance of PI3K pathway in HR-positive breast cancer. Ann. Oncol. 2019;30((Suppl. 10)):x3–x11. doi: 10.1093/annonc/mdz281. - DOI - PMC - PubMed
    1. Erenpreisa J., Ivanov A., Wheatley S.P., Kosmacek E.A., Ianzini F., Anisimov A.P., Mackey M., Davis P.J., Plakhins G., Illidge T.M. Endopolyploidy in irradiated p53-deficient tumour cell lines: Persistence of cell division activity in giant cells expressing Aurora-B kinase. Cell Biol. Int. 2008;32:1044–1056. doi: 10.1016/j.cellbi.2008.06.003. - DOI - PMC - PubMed

MeSH terms

LinkOut - more resources