. 2024 Aug 21;25(16):9048.
doi: 10.3390/ijms25169048.

Genome-Wide Characterization of the BTB Gene Family in Poplar and Expression Analysis in Response to Hormones and Biotic/Abiotic Stresses

Affiliations

Genome-Wide Characterization of the BTB Gene Family in Poplar and Expression Analysis in Response to Hormones and Biotic/Abiotic Stresses

Jing Yue et al. Int J Mol Sci. .

Abstract

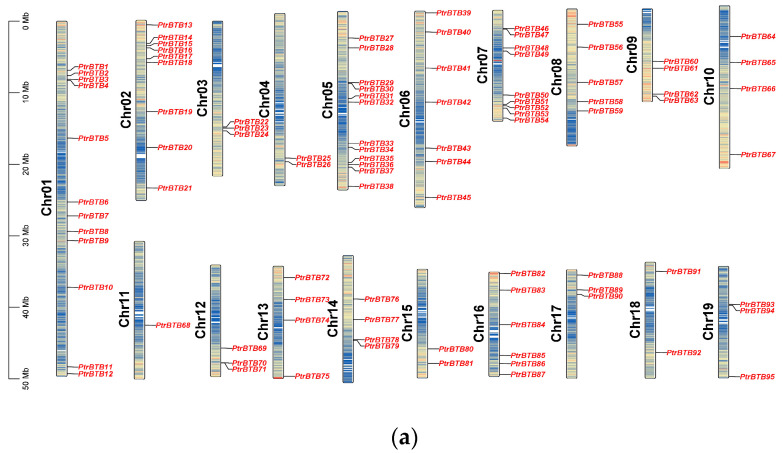
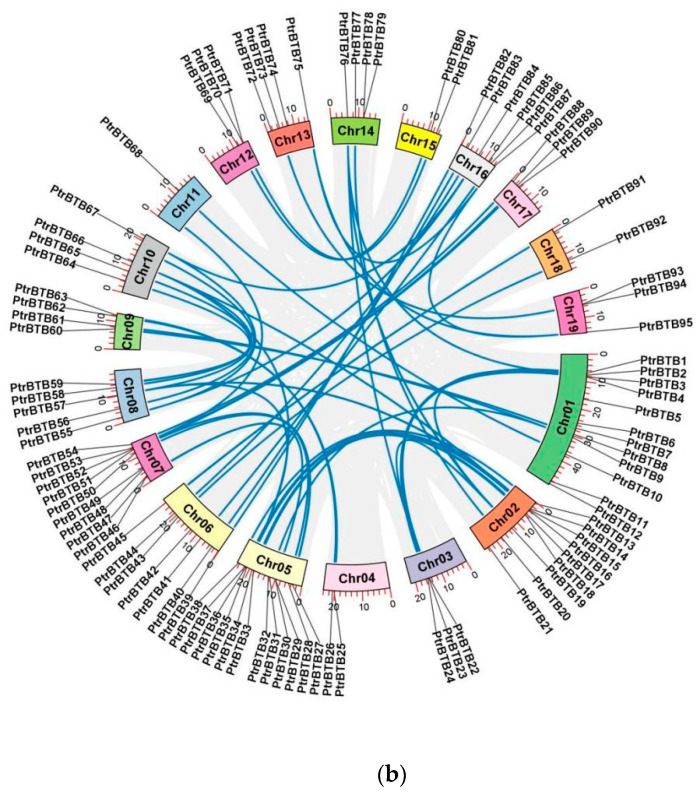
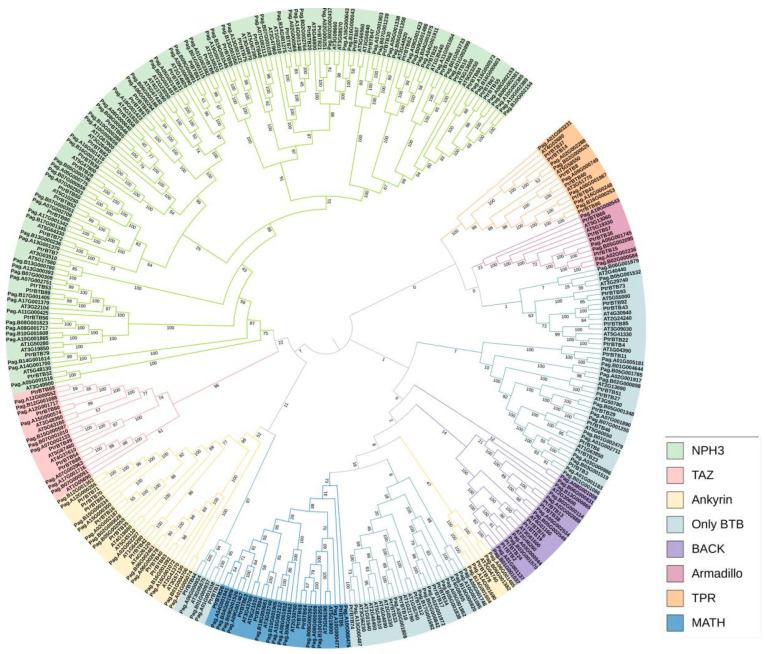
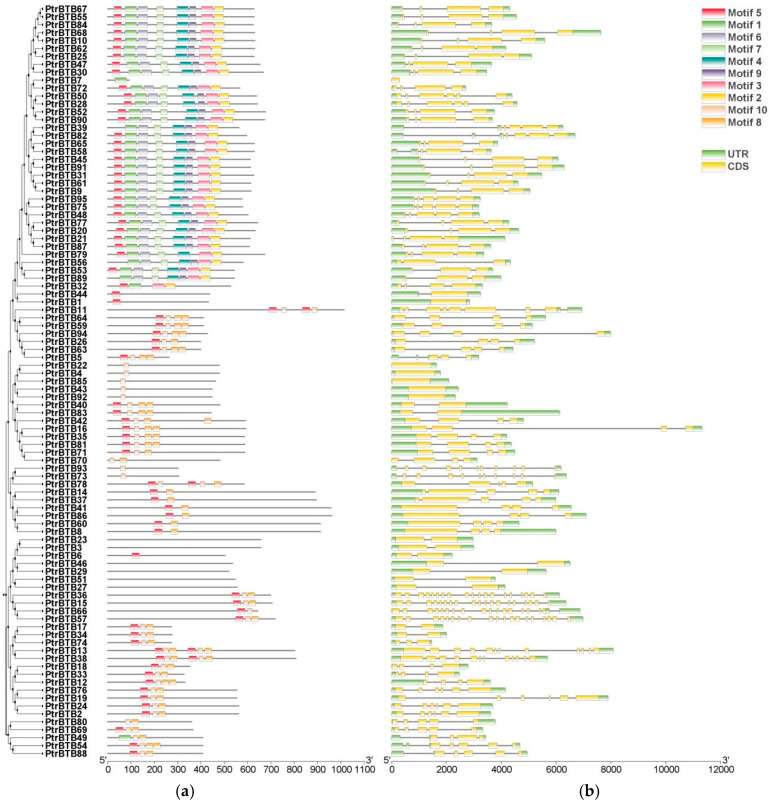
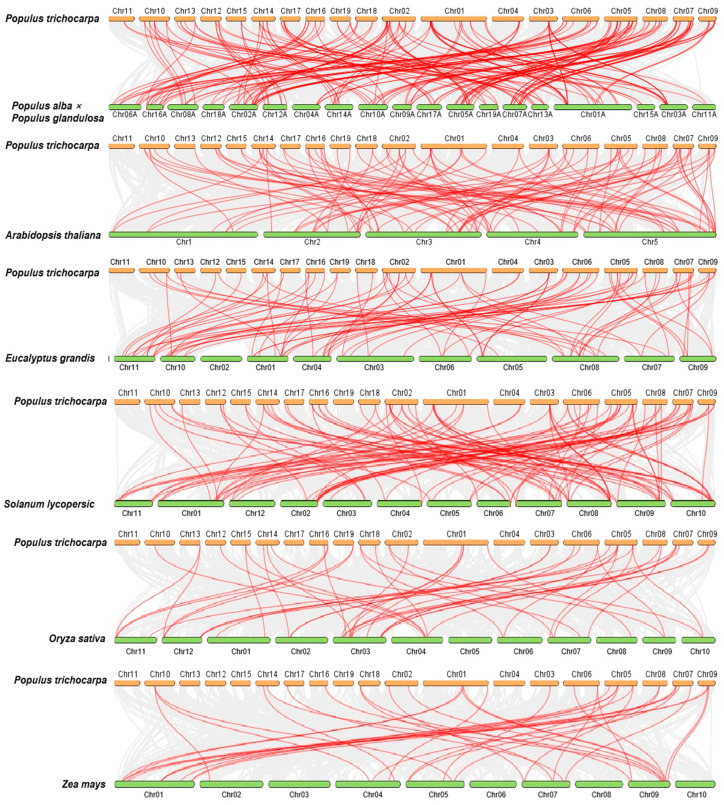
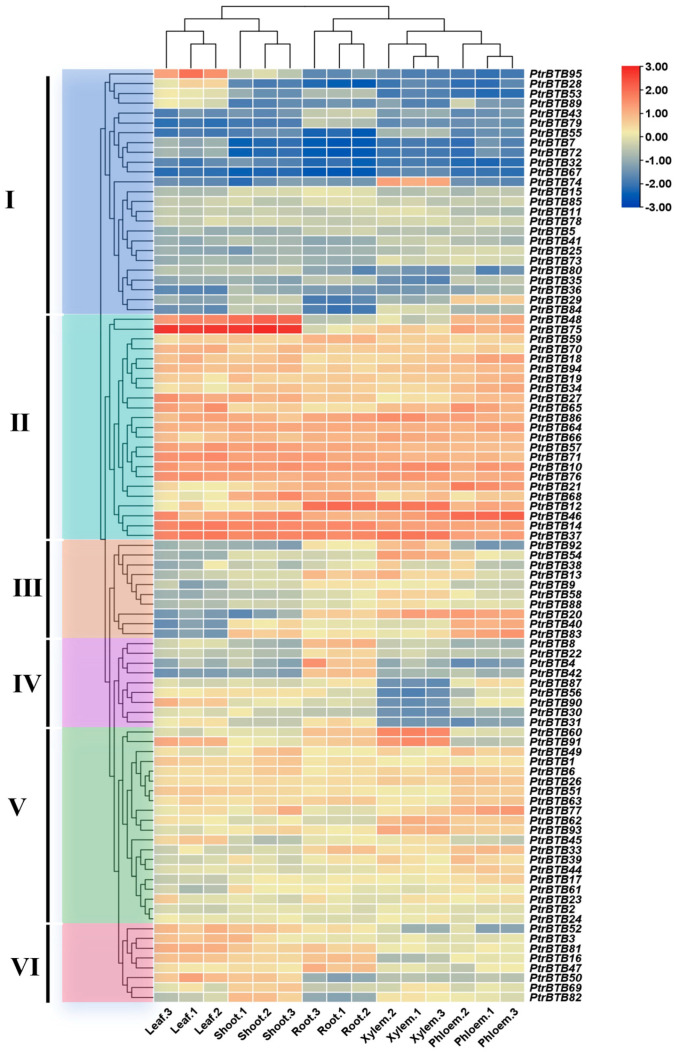
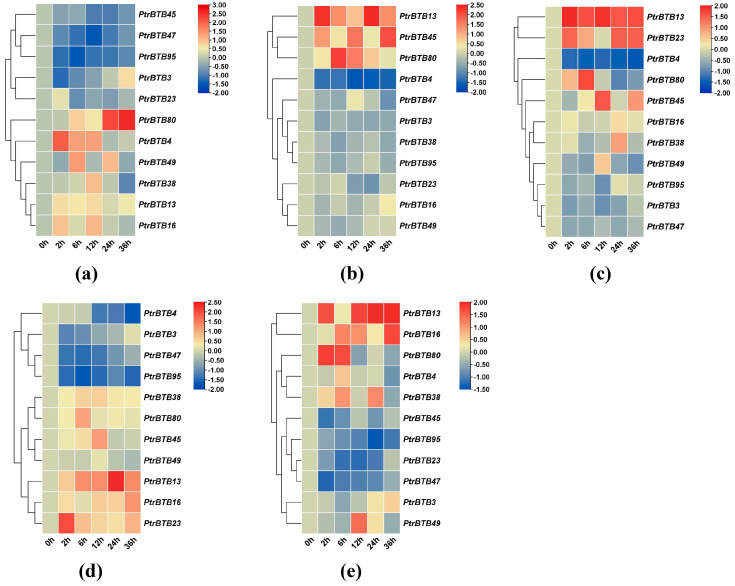
The BTB (Broad-complex, tramtrack, and bric-a-brac) gene family, characterized by a highly conserved BTB domain, is implicated in a spectrum of biological processes, encompassing growth and development, as well as stress responses. Characterization and functional studies of BTB genes in poplar are still limited, especially regarding their response to hormones and biotic/abiotic stresses. In this study, we conducted an HMMER search in conjunction with BLASTp and identified 95 BTB gene models in Populus trichocarpa. Through domain motif and phylogenetic relationship analyses, these proteins were classified into eight families, NPH3, TAZ, Ankyrin, only BTB, BACK, Armadillo, TPR, and MATH. Collinearity analysis of poplar BTB genes with homologs in six other species elucidated evolutionary relationships and functional conservations. RNA-seq analysis of five tissues of poplar identified BTB genes as playing a pivotal role during developmental processes. Comprehensive RT-qPCR analysis of 11 BTB genes across leaves, roots, and xylem tissues revealed their responsive expression patterns under diverse hormonal and biotic/abiotic stress conditions, with varying degrees of regulation observed in the results. This study marks the first in-depth exploration of the BTB gene family in poplar, providing insights into the potential roles of BTB genes in hormonal regulation and response to stress.

Keywords: BTB gene family; Populus trichocarpa; biotic/abiotic stresses; expression patterns; hormones treatment.


Conflict of interest statement

The authors declare no conflicts of interest.

Figures

Figure 1
Figure 1
Chromosome distribution and synteny analysis of BTB genes in P. trichocarpa. (a) The chromosomal mapping of PtrBTB genes across all 19 chromosomes of P. trichocarpa. (b) Comparative analysis of the distribution and syntenic relationships within the PtrBTB gene family, with syntenic gene pairs visually represented by blue connecting lines.
Figure 1
Figure 1
Chromosome distribution and synteny analysis of BTB genes in P. trichocarpa. (a) The chromosomal mapping of PtrBTB genes across all 19 chromosomes of P. trichocarpa. (b) Comparative analysis of the distribution and syntenic relationships within the PtrBTB gene family, with syntenic gene pairs visually represented by blue connecting lines.
Figure 2
Figure 2
A phylogenetic tree of BTB proteins from three plant species, P. trichocarpa, P. alba × P. glandulosa, and Arabidopsis. The analysis shows that 340 BTB proteins are classified into eight subgroups: MATH, Armadillo, BTB-only, TAZ, BACK, Ankyrin, TPR, and NPH3. The phylogenetic tree was constructed using MEGA-X 10.2 software using the neighbor-joining method at 1000 bootstrap replicates.
Figure 3
Figure 3
Analysis of the conserved motifs and gene structures within the PtrBTB gene family. The clustering is performed according to the results of phylogenetic analysis. (a) Conserved motifs within PtrBTB proteins, identified by the MEME tool (version 5.5.6), yielding 10 distinct motifs, labeled as Motif 1 through 10. 100 aa is indicated by the scale bar. (b) Gene structure analysis of PtrBTB genes revealed the organization of UTR, intron, and exon regions, with UTR in green, exons in yellow, and introns in grey. The scale bar corresponds to 2 kb.
Figure 4
Figure 4
Analysis of cis-elements in the 2000 bp upstream promoter of PtrBTB genes. The clustering is performed according to the results of phylogenetic analysis. Within the predicted promoter region of the PtrBTB genes, a total of 14 distinct regulatory motifs have been identified. These motifs are distinguished by a spectrum of colors, each representing a unique class of transcription factor binding sites.
Figure 5
Figure 5
Collinear analysis of PtrBTB genes from P. trichocarpa with four dicotyledons (P. alba × P. glandulosa, A. thaliana, S. lycopersicum, and E. grandis) and two monocotyledons (O. sativa and Z. mays).
Figure 6
Figure 6
Expression profiles of PtrBTB genes in different tissues, shoots, roots, leaves, xylem and phloem. Ⅰ−VI represent different clusters. All data of RNA−seq analysis was deposited in GEO (accession number: GSE81077). The color scale represents the FPKM values normalized by log2FPKM. Red represents highly expressed genes and blue represents low expressed genes.
Figure 7
Figure 7
Expression profiles of BTB genes under exogenous hormones in P. alba × P. glandulosa. Color scale represents log2 expression values, red represents highly expressed genes and blue represents low expressed genes. (a) JA treatment, (b) ABA treatment, (c) GA treatment, (d) NAA treatment, (e) SA treatment. All samples were collected from leaf tissues at specified time points, with three biological replicates for each treatment. Error bars indicate ± SE of the means (n = 3).
Figure 8
Figure 8
Expression profiles of PagBTB genes under different biotic/abiotic stress in poplar 84K. Color scale represents log2 expression values, red represents highly expressed genes and blue represents low expressed genes. (a) NaCl−root, (b) NaCl−leaf, (c) F. solani stress−leaf, (d) Drought treatment−xylem. All samples were collected at the indicated time intervals from three biological replicates of each treatment. Error bars indicate ± SE of the means (n = 3).

Similar articles

Cited by

References

    1. Chaharbakhshi E., Jemc J.C. Broad-complex, tramtrack, and bric-à-brac (BTB) proteins: Critical regulators of development. Genesis. 2016;54:505–518. doi: 10.1002/dvg.22964. - DOI - PubMed
    1. Stogios P.J., Downs G.S., Jauhal J.J., Nandra S.K., Privé G.G. Sequence and structural analysis of BTB domain proteins. Genome Biol. 2005;6:R82. doi: 10.1186/gb-2005-6-10-r82. - DOI - PMC - PubMed
    1. Cheng D., Qian W., Meng M., Wang Y., Peng J., Xia Q. Identification and expression profiling of the BTB domain-containing protein gene family in the silkworm, Bombyx mori. Int. J. Genom. 2014;2014:865065. doi: 10.1155/2014/865065. - DOI - PMC - PubMed
    1. Stogios P.J., Privé G.G. The BACK domain in BTB-kelch proteins. Trends Biochem. Sci. 2004;29:634–637. doi: 10.1016/j.tibs.2004.10.003. - DOI - PubMed
    1. Michaely P., Bennett V. The ANK repeat: A ubiquitous motif involved in macromolecular recognition. Trends Cell Biol. 1992;2:127–129. doi: 10.1016/0962-8924(92)90084-Z. - DOI - PubMed

LinkOut - more resources