. 2024 Aug 21;25(16):9053.
doi: 10.3390/ijms25169053.

Serum TLR2 and TLR9 in Prostate Cancer Patients in Relation to EBV Status

Affiliations

Serum TLR2 and TLR9 in Prostate Cancer Patients in Relation to EBV Status

Dominika Sikora et al. Int J Mol Sci. .

Abstract

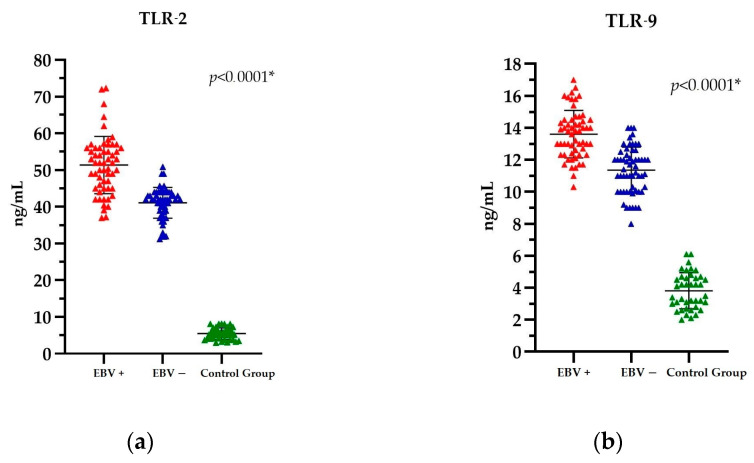
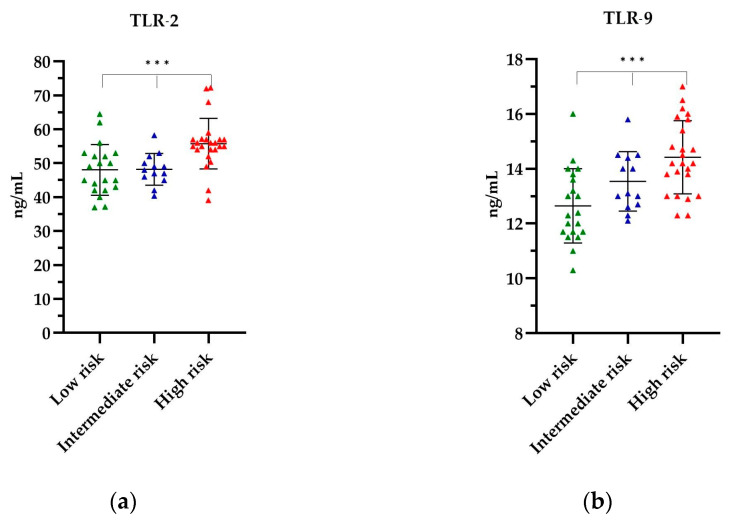
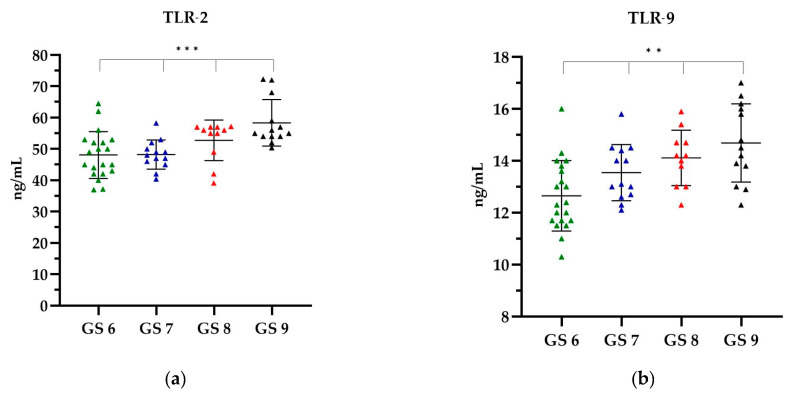
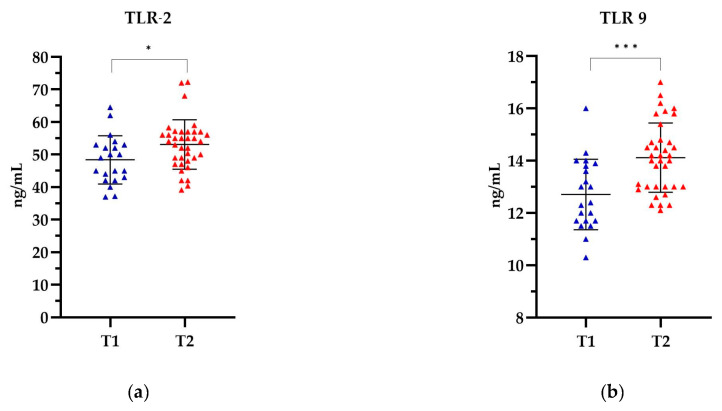
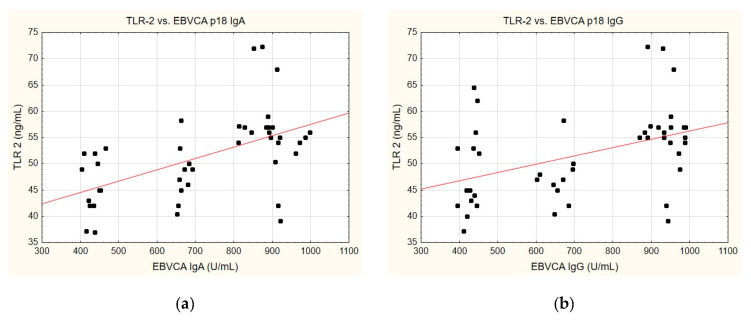
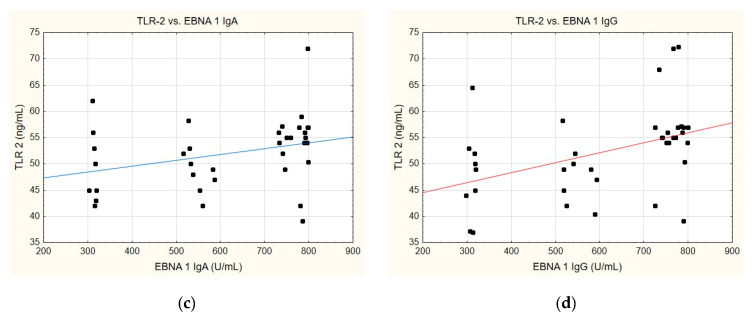
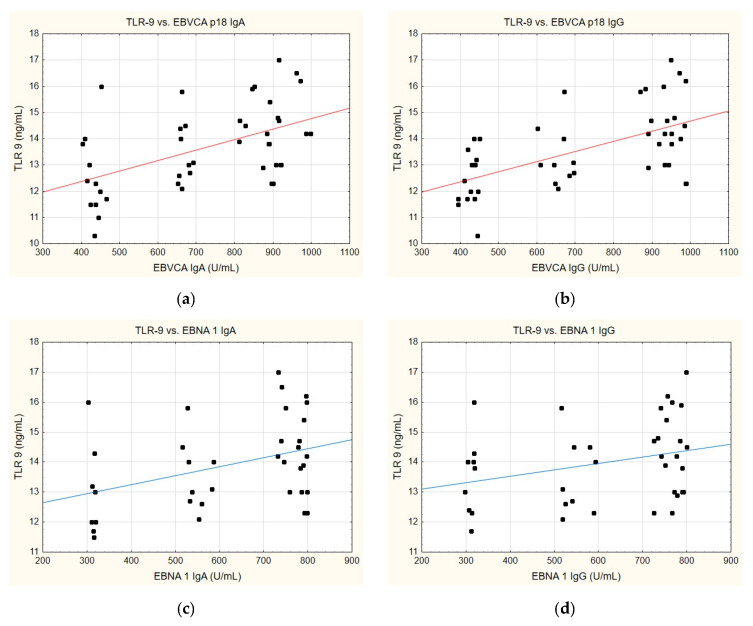
The relationship between Toll-like receptors (TLRs) and prostate cancer (PCa) is complex due to the presence of the Epstein-Barr virus (EBV) infection, which has been identified as a predisposing factor for some cancers, including PCa. The present study aims to investigate these complex links by examining the levels of selected TLRs and the potential impact of EBV infection on PCa. Therefore, we examined the serum of patients with PCa. The study compared EBV(+) patients to risk groups, the Gleason score (GS), and the T-trait. Additionally, the correlation between TLR and antibody levels was examined. The results indicated that higher levels of TLR-2 and TLR-9 were observed in more advanced PCa. The findings of this study may contribute to a deeper understanding of the role of viral infections in PCa and provide information on future strategies for the diagnosis, prevention, and treatment of these malignancies.

Keywords: Epstein–Barr virus; TLR-2; TLR-9; prostate cancer.


Conflict of interest statement

The authors declare no conflicts of interest.

Figures

Figure 1
Figure 1
The immune response and TLR signalling pathway [18].
Figure 2
Figure 2
The level of (a) TLR-2 and (b) TLR-9 in PCa patients EBV(+), EBV(−), and the Control Group. The Kruskal-Wallis test was used to analyse the data; * statistically significant (10−1). The results are presented in colour, with red representing PCa EBV(+) patients, blue representing PCa EBV(−) patients, and green representing the Control Group.
Figure 3
Figure 3
The level of (a) TLR-2 and (b) TLR-9 in relation to the risk group. The Kruskal–Wallis test was used to analyse the data: (a) p = 0.0003 and (b) p = 0.0005; *** statistically significant (10−3). The results are presented in color, with green representing low-risk group, blue representing intermediate risk group and red representing the high-risk group.
Figure 4
Figure 4
The level of (a) TLR-2 and (b) TLR-9 in relation to the GS. The Kruskal–Wallis test was used to analyse the data: (a) p = 0.0006 and (b) p = 0.0013; ** statistically significant (10−2); *** statistically significant (10−3). The results are presented in colour, with green representing the GS 6, blue representing the GS 7, red representing the GS 8 and black representing the GS 9.
Figure 5
Figure 5
The level of (a) TLR-2 and (b) TLR-9 in relation to the T stage. The Mann Whitney test was used to analyse the data: (a) p= 0.0175 and (b) p = 0.0003; * statistically significant (10−1); *** statistically significant (10−3). The results are presented in colour, with blue representing T1 and red representing T2.
Figure 6
Figure 6
Correlation between TLR-2 and (a) EBVCA IgA, (b) EBVCA IgG, (c) EBNA 1 IgA, (d) EBNA 1 IgG the serum levels. Spearman’s rank correlation test (EBVCA IgA and TLR-2 p = 0.0003; EBVCA IgG and TLR-2 p = 0.0019; EBNA 1 IgA and TLR-2 p = 0.0589; EBNA 1 IgG and TLR-2 p = 0.0036).
Figure 6
Figure 6
Correlation between TLR-2 and (a) EBVCA IgA, (b) EBVCA IgG, (c) EBNA 1 IgA, (d) EBNA 1 IgG the serum levels. Spearman’s rank correlation test (EBVCA IgA and TLR-2 p = 0.0003; EBVCA IgG and TLR-2 p = 0.0019; EBNA 1 IgA and TLR-2 p = 0.0589; EBNA 1 IgG and TLR-2 p = 0.0036).
Figure 7
Figure 7
Correlation between TLR-9 and (a) EBVCA IgA, (b) EBVCA IgG, (c) EBNA 1 IgA, (d) EBNA 1 IgG the serum levels. Spearman’s rank correlation test (EBVCA IgA and TLR-9 p = 0.0007; EBVCA IgG and TLR-9 p = 0.0002; EBNA 1 IgA and TLR-9 p = 0.1463; EBNA 1 IgG and TLR-9 p = 0.0697).

Similar articles

Cited by

References

    1. World Health Organization The Global Cancer Observatory—All Rights Reserved. December 2020. [(accessed on 20 April 2024)]. Available online: https://gco.iarc.fr/today/data/factsheets/cancers/27-Prostate-fact-sheet....
    1. Bray F., Laversanne M., Sung H., Ferlay J., Siegel R.L., Soerjomataram I., Jemal A. Global cancer statistics 2022: GLOBOCAN estimates of incidence and mortality worldwide for 36 cancers in 185 countries. CA Cancer J. Clin. 2024;74:229–263. - PubMed
    1. Prostate Cancer—Is It Worth Getting Tested? [(accessed on 20 April 2024)]; Available online: https://pacjent.gov.pl.
    1. Rawla P. Epidemiology of Prostate Cancer. World J. Oncol. 2019;10:63–89. - PMC - PubMed
    1. Wardecki D., Dołowy M. Rak prostaty—Aktualne możliwości terapeutyczne. Farm. Pol. 2022;78:268–276.

LinkOut - more resources