. 2024 Aug 21;25(16):9078.
doi: 10.3390/ijms25169078.

Transglutaminase 2 Regulates HSF1 Gene Expression in the Acute Phase of Fish Optic Nerve Regeneration

Affiliations

Transglutaminase 2 Regulates HSF1 Gene Expression in the Acute Phase of Fish Optic Nerve Regeneration

Kayo Sugitani et al. Int J Mol Sci. .

Abstract

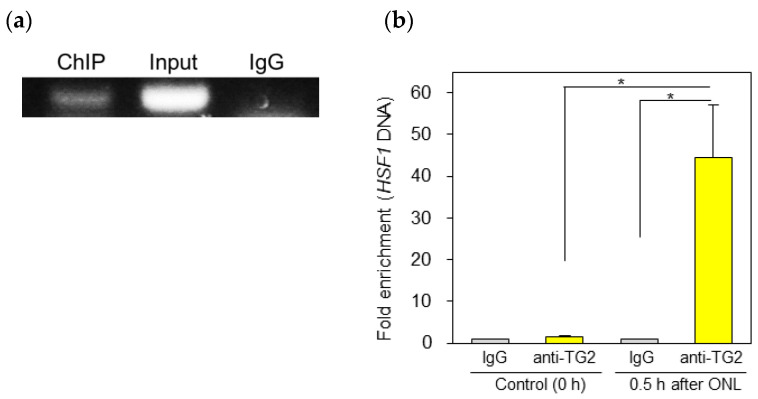
Fish retinal ganglion cells (RGCs) can regenerate after optic nerve lesions (ONLs). We previously reported that heat shock factor 1 (HSF1) and Yamanaka factors increased in the zebrafish retina 0.5-24 h after ONLs, and they led to cell survival and the transformation of neuro-stem cells. We also showed that retinoic acid (RA) signaling and transglutaminase 2 (TG2) were activated in the fish retina, performing neurite outgrowth 5-30 days after ONLs. In this study, we found that RA signaling and TG2 increased within 0.5 h in the zebrafish retina after ONLs. We examined their interaction with the TG2-specific morpholino and inhibitor due to the significantly close initiation time of TG2 and HSF1. The inhibition of TG2 led to the complete suppression of HSF1 expression. Furthermore, the results of a ChIP assay with an anti-TG2 antibody evidenced significant anti-TG2 immunoprecipitation of HSF1 genome DNA after ONLs. The inhibition of TG2 also suppressed Yamanaka factors' gene expression. This rapid increase in TG2 expression occurred 30 min after the ONLs, and RA signaling occurred 15 min before this change. The present study demonstrates that TG2 regulates Yamanaka factors via HSF1 signals in the acute phase of fish optic nerve regeneration.

Keywords: HSF1; Klf4; Oct4; Sox2; TG2; Yamanaka factors; cell survival; optic nerve regeneration; retina; zebrafish.


Conflict of interest statement

The authors declare no conflicts of interest.

Figures

Figure 1
Figure 1
The upregulation of TG2 (transglutaminase 2) in the zebrafish retina after ONLs (optic nerve lesions): (a) TG2 mRNA expression levels were determined using quantitative real-time PCR. Data are expressed as the mean ± SEM, with statistical significance set at * p < 0.05. (b) The in situ hybridization of TG2 in zebrafish retina. TG2 mRNA peaked in the retina 0.5 h after the ONLs; its localization was observed in all nuclear layers in the retina, i.e., the ONLs (outer nuclear layers), the INLs (inner nuclear layers), and the GCLs (ganglion cell layers). (c) The immunohistochemical staining of TG2 in the zebrafish retina. Significant immunostaining was observed at 0.5 h after the ONLs in all nuclear layers, particularly in the GCLs. Scale bar = 20 μm.
Figure 2
Figure 2
The upregulation of the RA signaling pathway in the zebrafish retina immediately after optic nerve lesions (ONLs): (a) RARαa, (b) RALDH2, and (c) purpurin were upregulated in the retina within 0.25–1 h, while (d) CYP26a1 was downregulated 3 h after the ONLs. The experiments were repeated 6–7 times. Statistical analysis was performed using one-way ANOVA, followed by Scheffe’s multiple-comparison test. Data are expressed as the mean ± SEM, with statistical significance set at * p < 0.05.
Figure 3
Figure 3
Injection of TG2 MO (morpholino) significantly reduced HSF1 mRNA expression 1 h after ONLs: (a) The TG2 MO-treated samples exhibited significant suppression of TG2 mRNA expression compared with the Std. MO-treated samples. (b) Under these TG2 inhibitory conditions, HSF1 mRNA expression was also inhibited compared with that of the control (Std. MO) samples. (c) The HSF1 MO-treated group exhibited suppression of HSF1 mRNA expression 1 h after the ONLs compared with the Std. MO-treated samples. (d) Even under these HSF1 inhibitory conditions, TG2 mRNA expression was unaffected and increased compared with the control samples rather than tending to be higher than in the Std. MO-treated samples. The experiments were repeated five to six times. Statistical analysis was performed using one-way ANOVA, followed by Scheffe’s multiple-comparison test. Data are expressed as the mean ± SEM, with statistical significance set at * p < 0.05, ** p < 0.01.
Figure 4
Figure 4
Treatment with a TG2-specific inhibitor, Z-DON (1 mM), reduced TG enzyme activity 0.5 h after the ONLs and significantly decreased HSF1 mRNA expression: (a) TG2 enzymatic activity was clearly suppressed in the flat-mount retina with Z-DON-injected samples compared with the DMSO injected samples (DMSO 0.5 h). (b) FITC-labeled TG2-specific substrates exhibited almost no response in the TG2 inhibitor-treated retina. (c) TG2-specific inhibitor-treated samples exhibited suppression of HSF1 mRNA expression compared with the DMSO-treated samples. The experiments were repeated five to six times. Statistical analysis was performed using one-way ANOVA, followed by Scheffe’s multiple-comparison test. Data are expressed as the mean ± SEM, with significance set at * p < 0.05 and ** p < 0.01. Bar, 20 µm.
Figure 5
Figure 5
The results of the ChIP assay revealed the binding of anti-TG2 antibodies to the HSF1 genomic DNA. ChIP-enriched DNA was immunoprecipitated using IgG or anti-TG2 antibody from the control (0 h) or damaged zebrafish retina 0.5 h after ONLs: (a) Gel electrophoresis image for the ChIP samples. The input was an internal positive control for the ChIP assay. (b) The immunoprecipitated HSF1 DNA was analyzed using real-time PCR. Each ChIP signal was divided by the control IgG signals, and the results are presented as a fold increase in the signal relative to the background signal. Statistical analysis was performed via one-way ANOVA, followed by Scheffe’s multiple-comparison test. Data are expressed as the mean ± SEM of 5–6 independent experiments, with statistical significance set at * p < 0.05.
Figure 6
Figure 6
Treatment with TG2 MO (morpholino) significantly downregulated the mRNA expression of Klf4, Oct4, and Sox2 1 h after ONLs. TG2 MO or standard MO (Std. MO) was injected intraocularly 20 h before the ONLs. The TG2 MO-treated samples exhibited suppression of the mRNA expression of klf4 (a), oct4 (b), and sox2 (c) compared with that in the control (Std. MO) samples. Statistical analysis was performed using one-way ANOVA, followed by Scheffe’s multiple-comparison test. Data are expressed as the mean ± SEM of five to six independent experiments, with statistical significance set at * p < 0.05.
Figure 7
Figure 7
The inhibition of TG2 expression induced neuronal apoptosis in the retina after optic nerve lesions: (a) Timeframe for the administration of TG2-MO (morpholino) or standard MO (Std-MO), the occurrence of optic nerve lesion, and sample collection. (b) The detection of apoptotic cells in the retina 24 h after ONLs through MO administration. Optic nerve crush after the intraocular injection of TG2-specific MO resulted in a marked disruption of the structure of the retinal layer and a significant increase in apoptosis TUNEL-positive cells (FITC fluorescence-positive cells in the upper panel and the red-colored cells in the lower panel). Scale bar = 50 μm. (c) Apoptotic cells were quantified by analyzing fluorescence intensity versus Std-MO control. Data are expressed as the mean ± SEM of five independent experiments and analyzed using one-way ANOVA, followed by Scheffe’s multiple-comparison test. Statistical significance was set at ** p < 0.01. ONLs, outer nuclear layers; INLs, inner nuclear layers; GCLs, ganglion cell layers.

Similar articles

Cited by

References

    1. Attardi D.G., Sperry R.W. Preferential selection of central pathways by regenerating optic fibers. Exp. Neurol. 1963;7:46–64. - PubMed
    1. Sperry R.W. Patterning of central synapses in regeneration of the optic nerve in teleosts. Physiol. Zool. 1948;21:351–361. - PubMed
    1. Bastmeyer M., Bähr M., Stuermer C.A. Fish Optic Nerve Oligodendrocytes Support Axonal Regeneration of Fish and Mammalian Retinal Ganglion Cells. Glia. 1993;8:1–11. - PubMed
    1. Becker T., Becker C.G. Axonal regeneration in zebrafish. Curr. Opin. Neurobiol. 2014;27:186–191. - PubMed
    1. Laha B., Stafford B.K., Huberman A.D. Regenerating optic pathways from the eye to the brain. Science. 2017;356:1031–1034. - PMC - PubMed

MeSH terms

LinkOut - more resources