. 2024 Aug 21;25(16):9080.
doi: 10.3390/ijms25169080.

Identification and Expression Analysis of Sulfate Transporter Genes Family and Function Analysis of GmSULTR3;1a from Soybean

Affiliations

Identification and Expression Analysis of Sulfate Transporter Genes Family and Function Analysis of GmSULTR3;1a from Soybean

Jingwen Zhou et al. Int J Mol Sci. .

Abstract

Sulfate transporters (SULTRs) are essential for the transport and absorption of sulfate in plants and serve as critical transport proteins within the sulfur metabolism pathway, significantly influencing plant growth, development, and stress adaptation. A bioinformatics analysis of SULTR genes in soybean was performed, resulting in the identification and classification of twenty-eight putative GmSULTRs into four distinct groups. In this study, the characteristics of the 28 GmSULTR genes, including those involved in collinearity, gene structure, protein motifs, cis-elements, tissue expression patterns, and the response to abiotic stress and plant hormone treatments, were systematically analyzed. This study focused on conducting a preliminary functional analysis of the GmSULTR3;1a gene, wherein a high expression level of GmSULTR3;1a in the roots, stems, and leaves was induced by a sulfur deficiency and GmSULTR3;1a improved the salt tolerance. A further functional characterization revealed that GmSULTR3;1a-overexpressing soybean hairy roots had higher SO42-, GSH, and methionine (Met) contents compared with the wild-type (WT) plant. These results demonstrate that the overexpression of GmSULTR3;1a may promote the sulfur assimilation metabolism and increase the content of sulfur-containing amino acids in plants.

Keywords: abiotic stress; soybean; sulfate transporter genes; sulfur nutrition; sulfur-containing amino acids.


Conflict of interest statement

The authors declare no conflicts of interest.

Figures

Figure 1
Figure 1
Chromosome location, collinearity and synteny analysis of GmSULTR genes. (A) Chromosomal location of the GmSULTR gene family in Glycine (G.) max. and collinearity analysis of GmSULTRs. Gray lines represent all collinear blocks in the genome of Glycine max; red lines represent duplicated GmSULTR gene pairs. (B) Synteny analysis of GmSULTR genes between Glycine max and four other species. The gray lines indicate the gene blocks in Glycine max that are orthologous to the other genomes. The red lines delineate syntenic SULTR gene pairs.
Figure 2
Figure 2
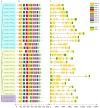
Conserved motif and gene structure analysis of GmSULTRs genes in Glycine max. (A) Phylogenetic tree of all GmSULTR proteins. (B) Motif distribution of GmSULTR proteins; motifs 1–10 are shown as rectangular boxes of different colors. (C) Gene structures of GmSULTR genes arranged according to the phylogenetic relationship; green boxes represent 5′UTR and 3′UTR, yellow boxes represent exons, and gray lines represent introns.
Figure 3
Figure 3
Cis elements in the promoters of GmSULTR genes. The black line indicates the length of the GmSULTR gene promoter. The rectangular boxes with different colors represent different types of cis-acting elements.
Figure 4
Figure 4
The qRT-PCR analysis of GmSULTRs in different tissues of Glycine max. The gene evolutionary relationships are on the left, the tissue names are at the bottom of the figure, and the expression abundance of each transcript is represented by the bar color: red, higher expression; blue, lower expression. Note: V3 (the third trifoliolate leaf expansion), R2 (the blooming period), and R7 (the initiation of maturity) are growth stages. The stars indicate a significant difference (* p < 0.05, ** p < 0.01, and *** p < 0.001) compared to the control.
Figure 5
Figure 5
Expression patterns of GmSULTR genes following exogenous treatments. The expression levels of the GmSULTR genes under 200 mM NaCl (A),15% PEG6000, (B), 75 mM NaHCO3 (C), 5 µM ABA (D), 50 µM MeJA (E), and sulfur deficiency (F) treatments using a qRT-PCR analysis. The heatmap was constructed based on the expression level of each gene in the leaves and roots relative to that of GmTUA5. The blue and red boxes indicate lower and higher expression levels, respectively. The scale bar represents the fold change (log2 value). Stars indicate a significant difference (* p < 0.05, ** p < 0.01 and *** p < 0.001) compared to the control.
Figure 6
Figure 6
Salt tolerance test of yeast cells expressing GmSULTR3;1a. The effects of the ectopic overexpression of the full length of GmSULTR3;1a were examined. Serially diluted (10× fold) cells were spotted and the growth of the spotted cells was examined after incubation on basal medium and after being supplied with basal medium, with 3 M Nacl, 2 M sorbitol and 0.8 M NaHCO3.
Figure 7
Figure 7
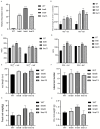
Sulfur-containing compounds and root phenotypes of GmSULTR3;1a-transgenic soybean hairy roots. (A) qRT-PCR analysis of GmSULTR3;1a transcript levels in transgenic hairy roots. Methionine content (B), sulfate ion content (C), and GSH content (D) of roots and leaves in GmSULTR3;1a-transgenic soybean hairy root material. Root length (E), lateral root number (F), fresh weights (G), and dry weights (H) of roots in GmSULTR3;1a- transgenic soybean hairy roots. Stars indicate a significant difference (* p < 0.05, ** p < 0.01 and *** p < 0.001) compared to the control.

Similar articles

References

    1. Xun M., Song J., Shi J., Li J., Shi Y., Yan J., Zhang W., Yang H. Genome-Wide Identification of Sultr Genes in Malus domestica and Low Sulfur-Induced MhSultr3;1a to Increase Cysteine-Improving Growth. Front. Plant Sci. 2021;12:748242. doi: 10.3389/fpls.2021.748242. - DOI - PMC - PubMed
    1. Hernández L.E., Sobrino-Plata J., Montero-Palmero M.B., Carrasco-Gil S., Flores-Cáceres M.L., Ortega-Villasante C., Escobar C. Contribution of glutathione to the control of cellular redox homeostasis under toxic metal and metalloid stress. J. Exp. Bot. 2015;66:2901–2911. doi: 10.1093/jxb/erv063. - DOI - PubMed
    1. Li L.-H., Yi H.-L., Xiu-Ping L., Qi H.-X. Sulfur dioxide enhance drought tolerance of wheat seedlings through H2S signaling. Ecotoxicol. Environ. Saf. 2021;207:111248. doi: 10.1016/j.ecoenv.2020.111248. - DOI - PubMed
    1. Yi H., Ravilious G.E., Galant A., Krishnan H.B., Jez J.M. From sulfur to homoglutathione: Thiol metabolism in soybean. Amino Acids. 2010;39:963–978. doi: 10.1007/s00726-010-0572-9. - DOI - PubMed
    1. Ernst L., Goodger J.Q.D., Alvarez S., Marsh E.L., Berla B., Lockhart E., Jung J., Li P., Bohnert H.J., Schachtman D.P. Sulphate as a xylem-borne chemical signal precedes the expression of ABA biosynthetic genes in maize roots. J. Exp. Bot. 2010;61:3395–3405. doi: 10.1093/jxb/erq160. - DOI - PubMed

LinkOut - more resources