. 2024 Aug 22;25(16):9105.
doi: 10.3390/ijms25169105.

Comprehensive Analysis of Methylome and Transcriptome to Identify Potential Genes Regulating Porcine Testis Development

Affiliations

Comprehensive Analysis of Methylome and Transcriptome to Identify Potential Genes Regulating Porcine Testis Development

Yue Feng et al. Int J Mol Sci. .

Abstract

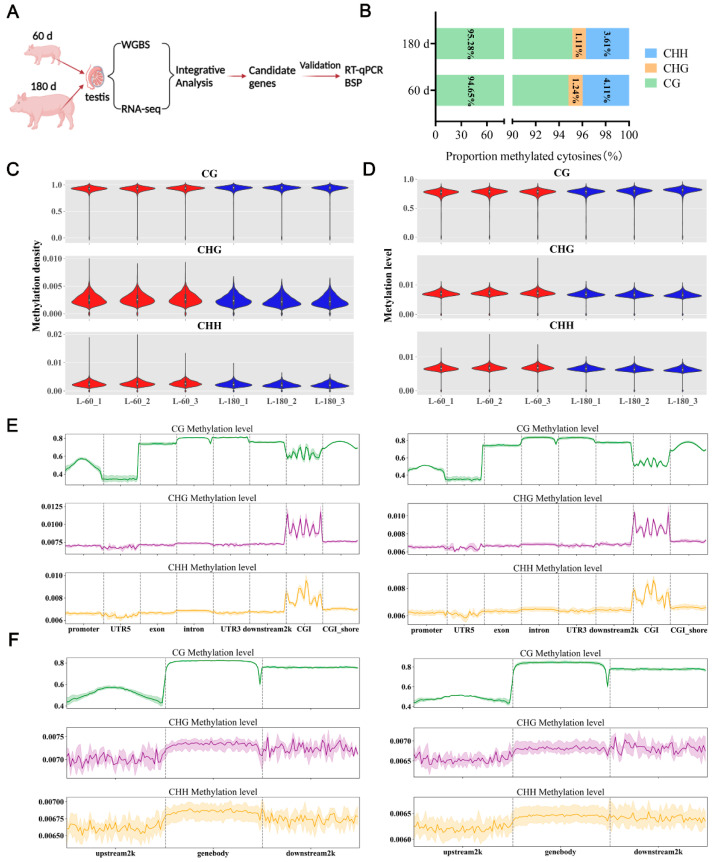
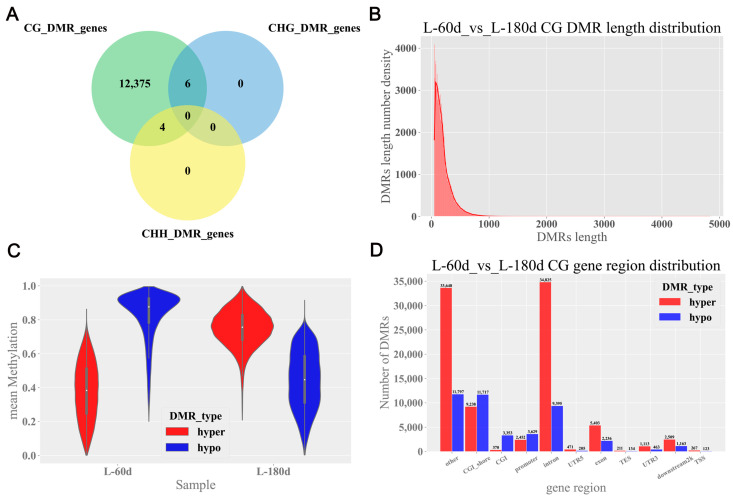
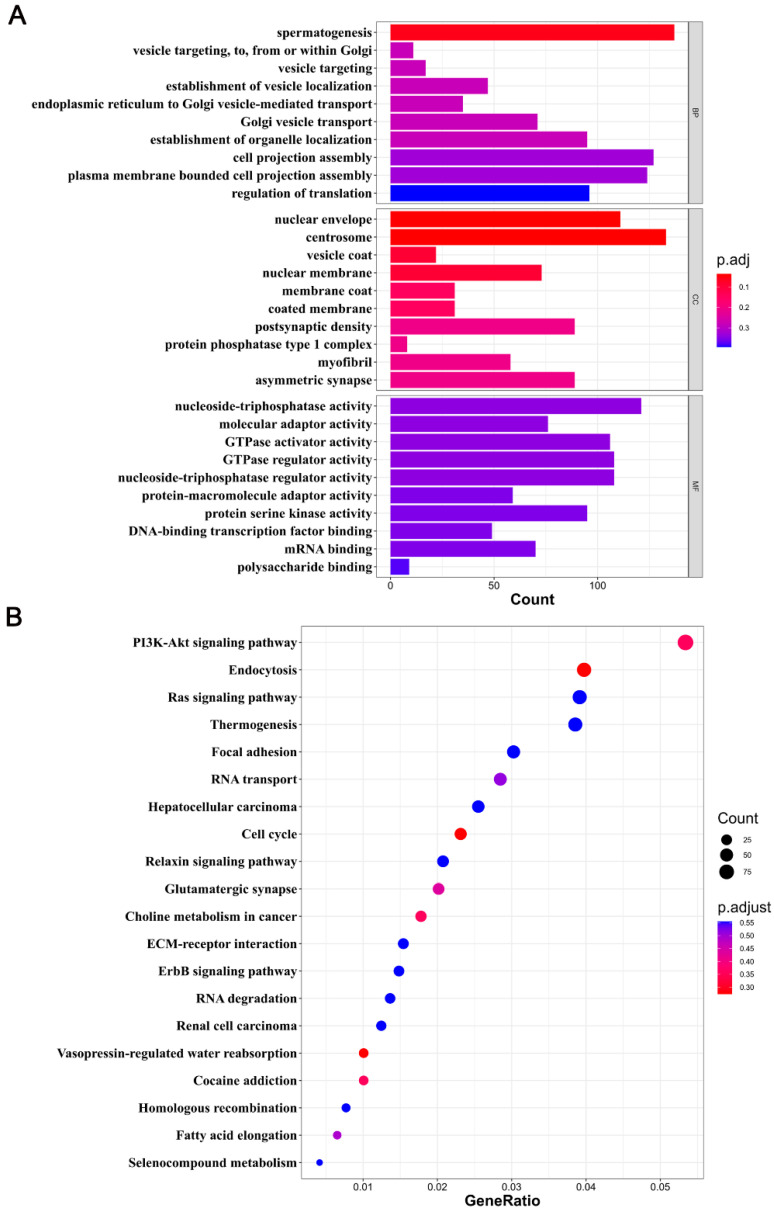
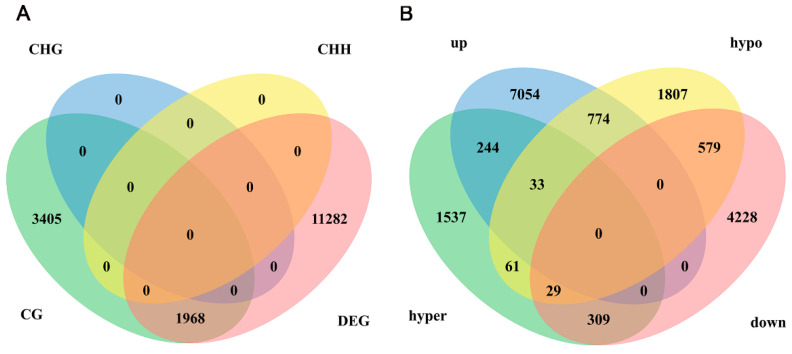
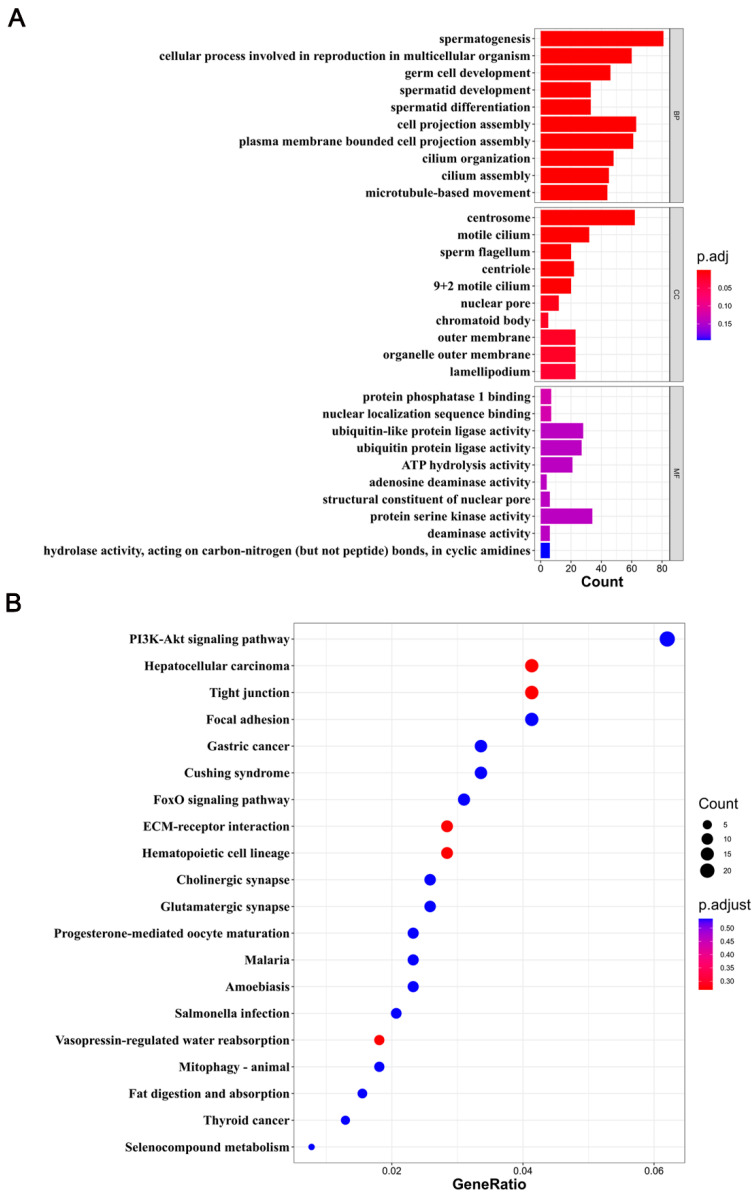
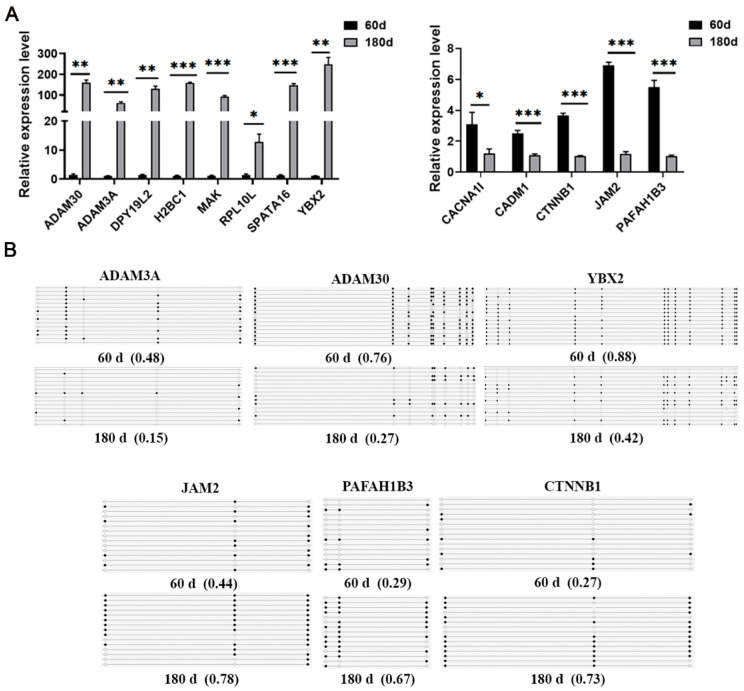
DNA methylation plays a critical role in regulating gene expression during testicular development. However, few studies report on candidate genes related to the DNA methylation regulation of porcine testicular development. This study examined the differentially expressed genes (DEGs) and their methylation levels in testicular tissues from pigs at 60 days of age (60 d) and 180 days of age (180 d) using RNA-Seq and whole genome bisulfite sequencing (WGBS). It was determined that DNA methylation primarily occurs in the cytosine-guanine (CG) context, and the analysis identified 106,282 differentially methylated regions (DMRs) corresponding to 12,385 differentially methylated genes (DMGs). Further integrated analysis of RNA-Seq and WGBS data revealed 1083 DMGs negatively correlated with the expression of DEGs. GO analysis showed that these genes were significantly enriched in spermatogenesis, germ cell development, and spermatid differentiation. The screening of enriched genes revealed that hyper-methylation repressed ADAM30, ADAM3A, DPY19L2, H2BC1, MAK, RPL10L, SPATA16, and YBX2, while hypo-methylation elevated CACNA1I, CADM1, CTNNB1, JAM2, and PAFAH1B3 expression. Additionally, the methylation status of the key genes ADAM3A, ADAM30, YBX2, JAM2, PAFAH1B3, and CTNNB1 was detected by bisulfite sequencing PCR (BSP). This study offers insights into the epigenetic regulation mechanisms underlying porcine testicular development.

Keywords: DNA methylation; RNA-Seq; WGBS; porcine; testicular development.


Conflict of interest statement

The authors declare no conflict of interest.

Figures

Figure 1
Figure 1
Characterization of DNA methylation in porcine testicular tissue. (A) Schematic representation of the experimental design. (B) The stacked bar charts shows the average proportion of three distinct methylation types in 60 d and 180 d porcine testicular tissues. The methylation types mCG, mCHG, and mCHH (H = A, C, or T) are represented in green, orange, and blue, respectively. (C) Violin plots depict the methylation density in three different sequence contexts (included CG, CHG, and CHH; H = A, C, or T). Each row indicates a distinct context. The Y-axes denote the methylation densities, and the X-axes represent distinct samples (60 d and 180 d). (D) Violin plots illustrate the distribution of methylation levels in three distinct sequence contexts (included CG, CHG, and CHH; H = A, C, or T). Each row indicates a distinct context. The Y-axes denote the methylation level, and the X-axes represent distinct samples (60 d and 180 d). (E) Methylation levels of various genomic elements in 60 d versus 180 d testis tissues. Each row indicates a distinct context. The X-axis denotes the distinct genomic elements, and Y-axis denotes the methylation level. The left and right panels show the distribution of methylation levels in 60 d and 180 d testis tissues, respectively. The green, purple and yellow lines represent the methylation levels of CG, CHG and CHH, respectively. (F) Distribution of methylation levels in upstream/downstream 2K regions in 60 d versus 180 d testis tissues. Each row indicates a distinct context. The X-axis denotes various regions, and the Y-axis reflects the methylation levels. The left and right panels show the distribution of methylation levels in 60 d and 180 d testis tissues, respectively. The green, purple and yellow lines represent the methylation levels of CG, CHG and CHH, respectively.
Figure 2
Figure 2
Identification of DMRs in porcine testicular tissue. (A) Venn diagram of CG, CHG, and CHH DMR-associated genes. (B) The length distribution of DMRs in CG context. The X-axis indicates the DMRs length; the Y-axis indicates the density at each length, and the DMRs length distribution of fitted curves is marked in red. (C) Violin plots of the distribution of methylation levels in the CG context. The X-axis represents the different age groups (60 d and 180 d), and the Y-axis represents the value of the mean methylation level. (D) DMR-anchored regions in CG context. The X- and Y-axes denote the different gene regions and the number of DMRs, respectively.
Figure 3
Figure 3
GO and KEGG analyses of DMGs. (A) A bar plot shows the GO enrichment analysis in the CG context. The Y-axis delineates different GO terms, while the X-axis shows the number of DMGs. BP, CC, and MF denote biological processes, cellular components, and molecular functions, respectively. (B) Scatter plot illustration of KEGG pathway enrichment in the CG context. The Y- and X-axes display the pathway names and the gene ratio, respectively. The dot size represents the number of DMGs, while the dot color corresponds to distinct q-values.
Figure 4
Figure 4
Correlation analysis between DNA methylation and gene expression. (A) A Venn diagram illustrates the overlap between DEGs and DMGs (CG, CHG, and CHH contexts). (B) The Venn diagram focused on the comparison of DMGs in the CG context with DEGs, differentiating between genes associated with hyper-methylation (hyper) and hypo-methylation (hypo), as well as those with elevated (up) and reduced (down) expression levels.
Figure 5
Figure 5
Functional enrichment analysis of DMGs negatively associated with DEGs. (A) A bar plot graph shows the GO enrichment of DMGs negatively associated with DEGs. The Y-axis denotes different GO terms, while the X-axis shows the number of DMGs negatively associated with DEGs. BP, CC, and MF denote biological processes, cellular components, and molecular functions, respectively. (B) A scatter plot illustration of the KEGG pathway for DMGs negatively associated with DEGs. The Y and X axes display the pathway names and the gene ratio, respectively. The dot size represents the number of DMGs negatively associated with DEGs in the pathway, while the dot color corresponds to distinct q-values.
Figure 6
Figure 6
Validation of DMGs and their expression patterns. (A) The RT-qPCR expression levels of genes were consistent with RNA-Seq data; hyper-methylation suppressed gene expression and hypo-methylation stimulated gene expression. (B) DNA methylation detected by BSP was consistent with WGBS data. Triplicate biological assays were conducted, with β-actin serving as a control housekeeping gene. * p < 0.05; ** p < 0.01; *** p < 0.001.

Similar articles

Cited by

References

    1. Tirumalasetty M.B., Bhattacharya I., Mohiuddin M.S., Baki V.B., Choubey M. Understanding testicular single cell transcriptional atlas: From developmental complications to male infertility. Front. Endocrinol. (Lausanne) 2024;15:1394812. doi: 10.3389/fendo.2024.1394812. - DOI - PMC - PubMed
    1. Si L., Meng Y., Tian F., Li W., Zou P., Wang Q., Xu W., Wang Y., Xia M., Hu J., et al. A Peptide-Based Virus Inactivator Protects Male Mice Against Zika Virus-Induced Damage of Testicular Tissue. Front. Microbiol. 2019;10:2250. doi: 10.3389/fmicb.2019.02250. - DOI - PMC - PubMed
    1. Song H., Zhu L., Li Y., Ma C., Guan K., Xia X., Li F. Exploiting RNA-sequencing data from the porcine testes to identify the key genes involved in spermatogenesis in Large White pigs. Gene. 2015;573:303–309. doi: 10.1016/j.gene.2015.07.057. - DOI - PubMed
    1. Liu M., Xu Q., Zhao J., Guo Y., Zhang C., Chao X., Cheng M., Schinckel A.P., Zhou B. Comprehensive Transcriptome Analysis of Follicles from Two Stages of the Estrus Cycle of Two Breeds Reveals the Roles of Long Intergenic Non-Coding RNAs in Gilts. Biology. 2022;11:716. doi: 10.3390/biology11050716. - DOI - PMC - PubMed
    1. Luo L., Ye L., Liu G., Shao G., Zheng R., Ren Z., Zuo B., Xu D., Lei M., Jiang S., et al. Microarray-based approach identifies differentially expressed microRNAs in porcine sexually immature and mature testes. PLoS ONE. 2010;5:e11744. doi: 10.1371/journal.pone.0011744. - DOI - PMC - PubMed

LinkOut - more resources