. 2024 Aug 22;25(16):9111.
doi: 10.3390/ijms25169111.

Multi-Omics Integrative Analysis to Reveal the Impacts of Shewanella algae on the Development and Lifespan of Marine Nematode Litoditis marina

Affiliations

Multi-Omics Integrative Analysis to Reveal the Impacts of Shewanella algae on the Development and Lifespan of Marine Nematode Litoditis marina

Yiming Xue et al. Int J Mol Sci. .

Abstract

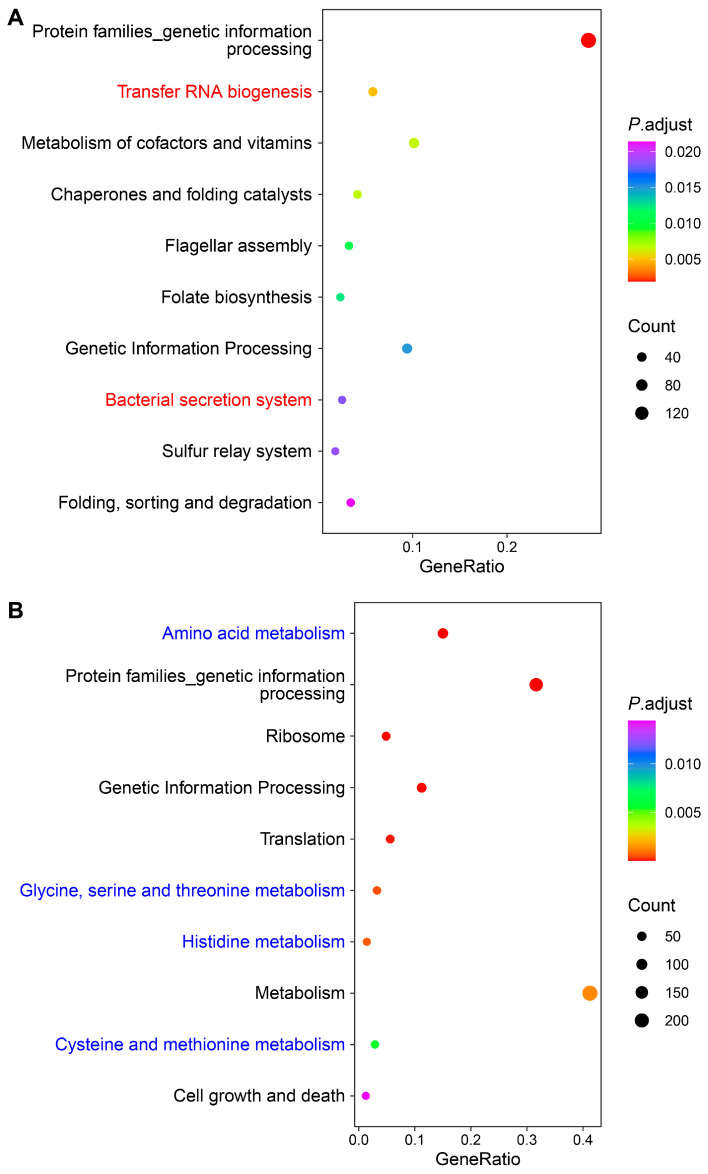
Understanding how habitat bacteria affect animal development, reproduction, and aging is essential for deciphering animal biology. Our recent study showed that Shewanella algae impaired Litoditis marina development and lifespan, compared with Escherichia coli OP50 feeding; however, the underlying mechanisms remain unclear. Here, multi-omics approaches, including the transcriptome of both L. marina and bacteria, as well as the comparative bacterial metabolome, were utilized to investigate how bacterial food affects animal fitness and physiology. We found that genes related to iron ion binding and oxidoreductase activity pathways, such as agmo-1, cdo-1, haao-1, and tdo-2, were significantly upregulated in L. marina grown on S. algae, while extracellular structural components-related genes were significantly downregulated. Next, we observed that bacterial genes belonging to amino acid metabolism and ubiquinol-8 biosynthesis were repressed, while virulence genes were significantly elevated in S. algae. Furthermore, metabolomic analysis revealed that several toxic metabolites, such as puromycin, were enriched in S. algae, while many nucleotides were significantly enriched in OP50. Moreover, we found that the "two-component system" was enriched in S. algae, whereas "purine metabolism" and "one-carbon pool by folate" were significantly enriched in E. coli OP50. Collectively, our data provide new insights to decipher how diet modulates animal fitness and biology.

Keywords: Escherichia coli OP50; Litoditis marina; Shewanella algae; development; lifespan; metabolomics; transcriptomics.


Conflict of interest statement

The authors declare no conflicts of interest.

Figures

Figure 1
Figure 1
S. algae delayed development and shortened the lifespan of L. marina. (A) S. algae significantly attenuated L. marina development. p-value (Day 5) = 0.00136. p-value (Day 10) = 0.00093. p-values were calculated with the two-tailed Student’s t-test. 70 hatched L1s were transferred onto each conditioned media. The number of L4 worms was scored every day. (B) S. algae significantly shortened the lifespan of L. marina. Log-rank test was applied for the significance.
Figure 2
Figure 2
Transcriptional characteristics of L. marina growing on S. algae versus E. coli OP50. (A) Principal component analysis (PCA) of L. marina gene expression changes growing on S. algae and E. coli OP50. (B) Volcano plot showing differentially expressed L. marina genes growing on S. algae versus E. coli OP50. Up, upregulated genes of S. algae vs. E. coli OP50; NS, genes with no significant changes; Down, downregulated genes of S. algae vs. E. coli OP50. (C,D) GO enrichment analysis for DEGs of L. marina growing on S. algae versus E. coli OP50. BP, biological process; CC, cellular component; MF, molecular function. The color from red to purple represents the significance of the enrichment. GeneRatio is calculated as the ratio of annotated differential genes to the total number of differential genes within a given GO term. OA: oxidoreductase activity, acting on paired donors, with incorporation or reduction of molecular oxygen. AT: active transmembrane transporter activity. PA: primary active transmembrane transporter activity. PP: P-P-bond-hydrolysis-driven transmembrane transporter activity. AA: ATPase activity, coupled to transmembrane movement of substances. The details of GO enrichment analysis are shown in Tables S3 and S4.
Figure 3
Figure 3
Transcriptional characteristics of S. algae versus E. coli OP50. (A) BioCyc enrichment analysis for downregulated DEGs of S. algae versus E. coli OP50. The color from red to purple represents the significance of the enrichment. SOL: superpathway of L-lysine, L-threonine, and L-methionine biosynthesis I. SOG: superpathway of glycolysis, pyruvate dehydrogenase, TCA, and glyoxylate bypass. The details of BioCyc enrichment analysis are shown in Table S7. (B,C) GO enrichment analysis for the top 10% MAD genes of S. algae and E. coli OP50, respectively. BP, biological process; MF, molecular function. OAA: oxidoreductase activity, acting on NAD(P)H, quinone, or similar compound as acceptor.
Figure 4
Figure 4
GO enrichment analysis of DEGs in S. algae versus E. coli OP50. (A) GO enrichment of upregulated DEGs in S. algae compared with E. coli OP50. (B) GO enrichment of downregulated DEGs in S. algae compared with E. coli OP50. The color from red to purple represents the significance of the enrichment. BP, biological process; CC, cellular component; MF, molecular function. Details are shown in Tables S8 and S9.
Figure 5
Figure 5
KEGG enrichment analysis of DEGs in S. algae versus E. coli OP50. (A) KEGG enrichment of upregulated DEGs in S. algae compared with E. coli OP50. (B) KEGG enrichment of downregulated DEGs in S. algae compared with E. coli OP50. The color from red to purple represents the significance of the enrichment. Details are shown in Tables S11 and S12.
Figure 6
Figure 6
Metabolomics profiling of the S. algae- and E. coli OP50-conditioned media. (A) PCA of the metabolomes of unconditioned medium, S. algae-conditioned medium, and E. coli OP50-conditioned medium. Five replicates of S. algae-conditioned medium and E. coli OP50-conditioned medium, as well as three replicates of unconditioned medium were analyzed. (B) Volcano plot comparing S. algae- and E. coli-conditioned media. Log2 fold enrichment in S. algae over E. coli OP50 is plotted on the horizontal axis, and the associated p-value is plotted on the vertical axis. The red dashed line shows p-value = 0.05. (C,D) Pie charts show the category of DAMs in S. algae (C)- and E. coli OP50 (D)-conditioned media. (E,F) KEGG enrichment of the significantly changed metabolites. (E) Upregulated pathways. (F) Downregulated pathways. The color from red to purple represents the significance of the enrichment.
Figure 7
Figure 7
The integrative analysis of transcriptome and metabolome. (A) Joint Pathway Analysis between the upregulated DAMs and DEGs in S. algae versus E. coli OP50. (B) Joint Pathway Analysis between the downregulated DAMs and DEGs in S. algae versus E. coli OP50. Each circle represents a single metabolic pathway, with the size of the circle proportional to the pathway’s impact. The color indicates the pathway’s significance, ranging from highest (red) to lowest (yellow). The enrichment analysis was performed using a hypergeometric test, and the topology measure was assessed by degree centrality. (C) The network visualization of STITCH interactions was generated using Cytoscape. Interactions between significant DAMs (square) and DEGs (circle) are displayed, with the edge thickness proportional to the interaction score in the STITCH database. The orange and blue node color indicates the upregulated and downregulated DEGs/DAMs in S. algae compared with E. coli OP50. Green, red, and gray edges represent interactions between metabolite–gene, metabolite–metabolite, and gene–gene, respectively.

Similar articles

Cited by

References

    1. Kumar A., Baruah A., Tomioka M., Iino Y., Kalita M.C., Khan M. Caenorhabditis elegans: A model to understand host–microbe interactions. Cell. Mol. Life Sci. 2020;77:1229–1249. doi: 10.1007/s00018-019-03319-7. - DOI - PMC - PubMed
    1. Zhang F., Berg M., Dierking K., Félix M.-A., Shapira M., Samuel B.S., Schulenburg H. Caenorhabditis elegans as a model for microbiome research. Front. Microbiol. 2017;8:485. doi: 10.3389/fmicb.2017.00485. - DOI - PMC - PubMed
    1. Samuel B.S., Rowedder H., Braendle C., Felix M.A., Ruvkun G. Caenorhabditis elegans responses to bacteria from its natural habitats. Proc. Natl. Acad. Sci. USA. 2016;113:E3941–E3949. doi: 10.1073/pnas.1607183113. - DOI - PMC - PubMed
    1. Xue Y., Xie Y., Cao X., Zhang l. The marine natural microbiome mediates physiological outcomes in host nematodes. bioRxiv. 2023 doi: 10.1101/2023.05.10.540299. - DOI
    1. Poorbagher H., Lamare M.D., Barker M.F. Effects of nutrition on somatic growth and reproductive strategy of the sea urchin Pseudechinus huttoni. Mar. Biol. Res. 2010;6:292–301. doi: 10.1080/17451000903233797. - DOI

Supplementary concepts

LinkOut - more resources