. 2024 Aug 22;25(16):9123.
doi: 10.3390/ijms25169123.

The Impact of the Major Endoribonucleases RNase E and RNase III and of the sRNA StsR on Photosynthesis Gene Expression in Rhodobacter sphaeroides Is Growth-Phase-Dependent

Affiliations

The Impact of the Major Endoribonucleases RNase E and RNase III and of the sRNA StsR on Photosynthesis Gene Expression in Rhodobacter sphaeroides Is Growth-Phase-Dependent

Janek Börner et al. Int J Mol Sci. .

Abstract

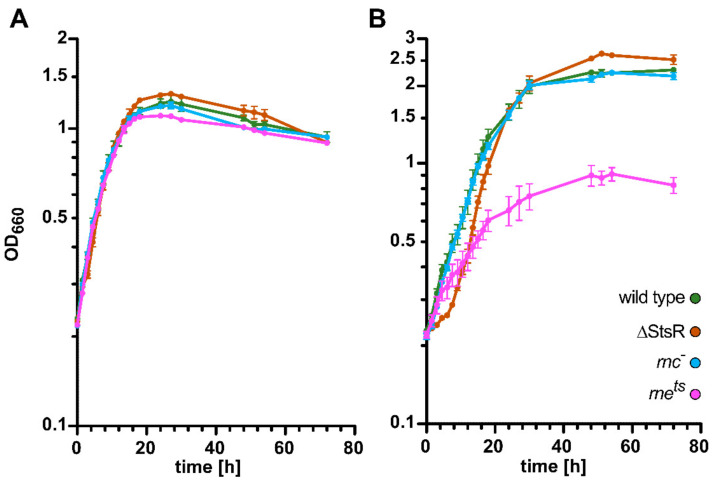
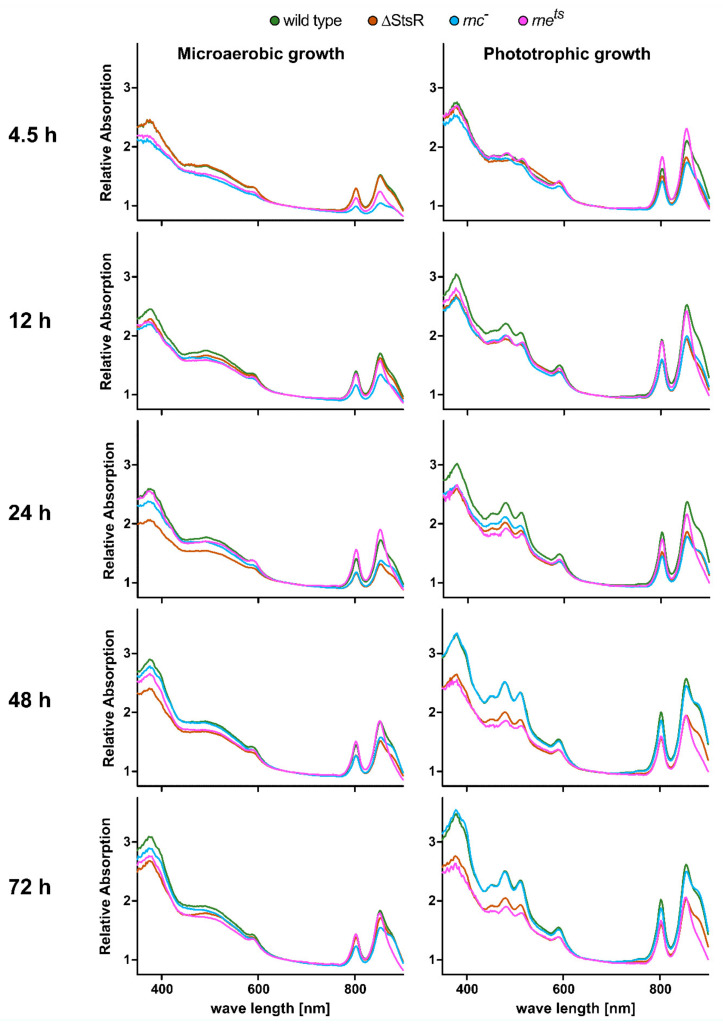
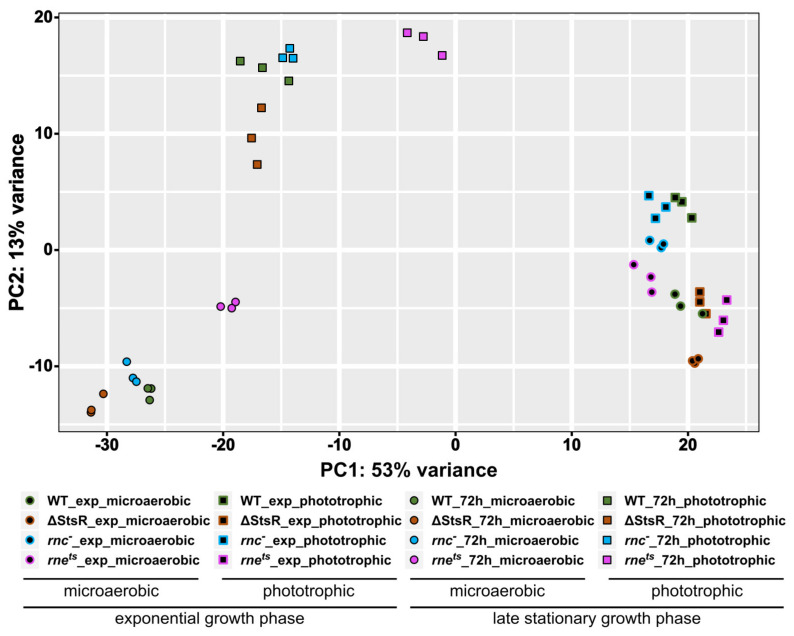
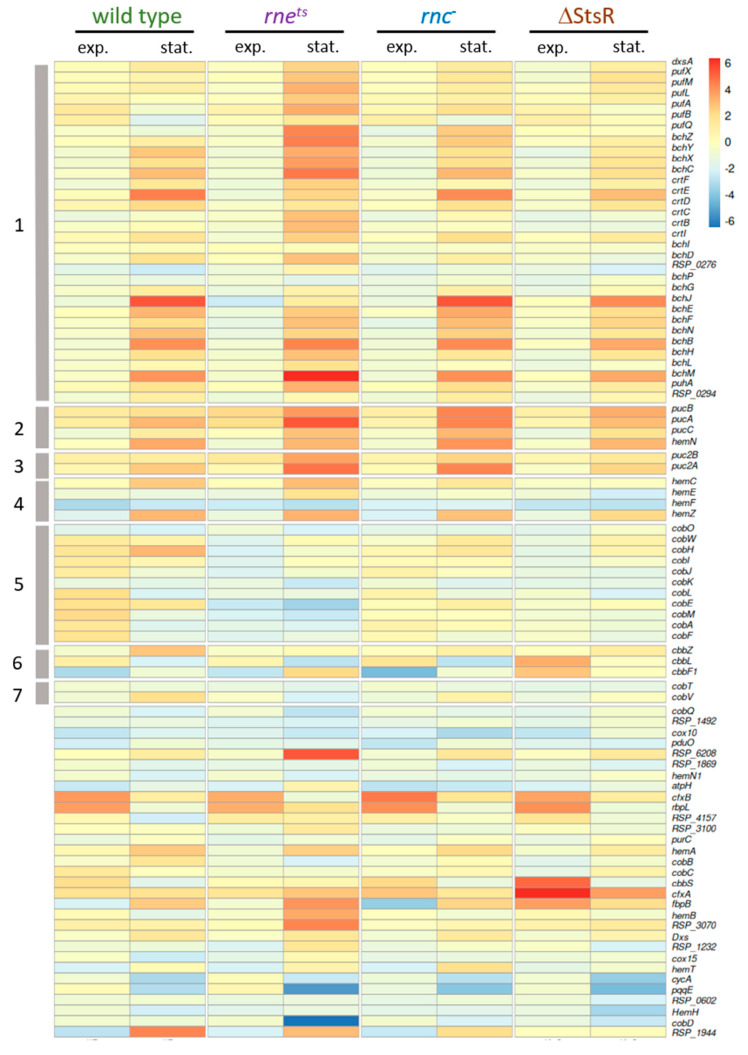
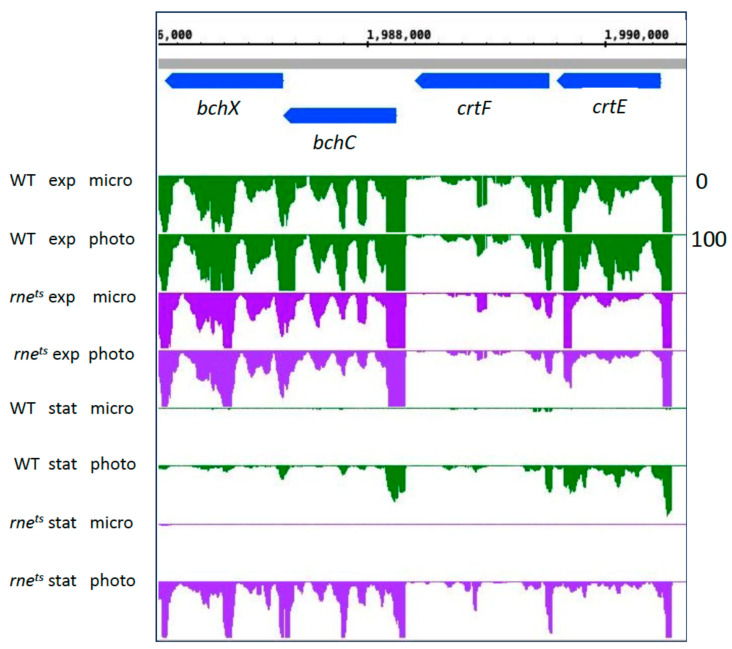
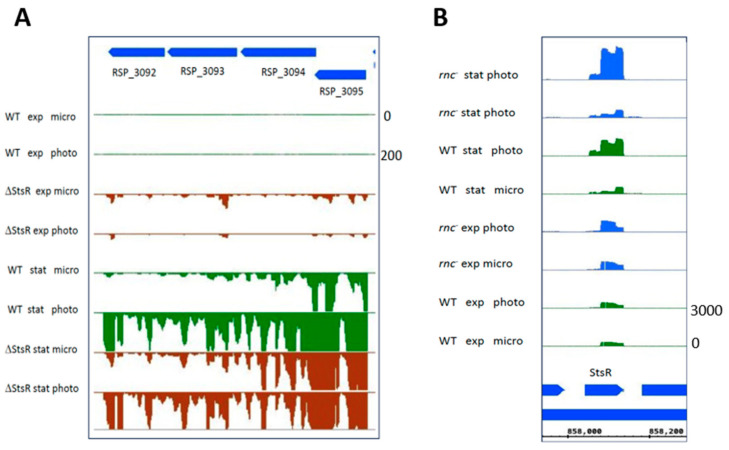
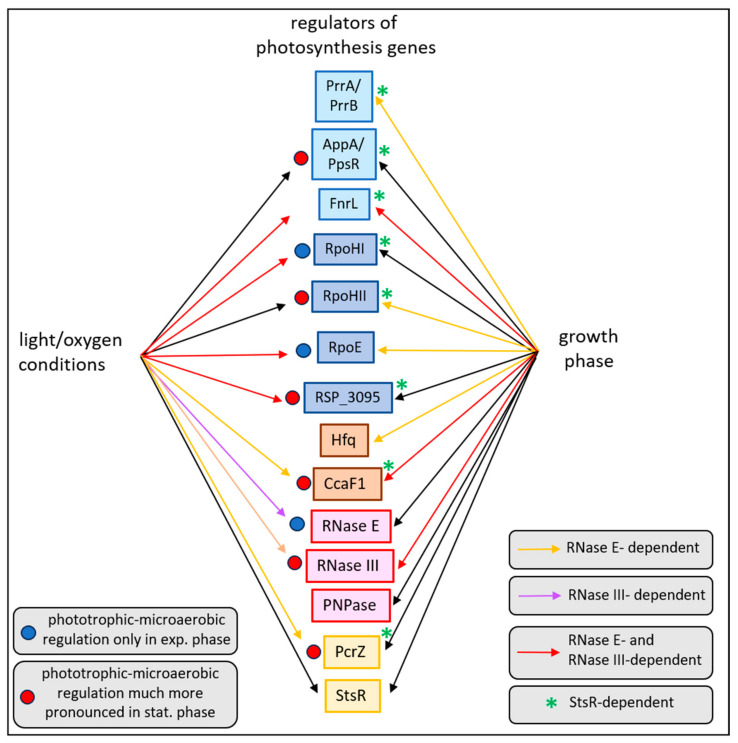
Rhodobacter sphaeroides is a facultative phototrophic bacterium that performs aerobic respiration when oxygen is available. Only when oxygen is present at low concentrations or absent are pigment-protein complexes formed, and anoxygenic photosynthesis generates ATP. The regulation of photosynthesis genes in response to oxygen and light has been investigated for decades, with a focus on the regulation of transcription. However, many studies have also revealed the importance of regulated mRNA processing. This study analyzes the phenotypes of wild type and mutant strains and compares global RNA-seq datasets to elucidate the impact of ribonucleases and the small non-coding RNA StsR on photosynthesis gene expression in Rhodobacter. Most importantly, the results demonstrate that, in particular, the role of ribonuclease E in photosynthesis gene expression is strongly dependent on growth phase.

Keywords: RNase E; RNase III; Rhodobacter; bacterial photosynthesis; pigment synthesis; ribonucleases; riboregulation; stationary phase.


Conflict of interest statement

The authors declare no conflicts of interest.

Figures

Figure 1
Figure 1
Growth behavior of the R. sphaeroides wild type and RNase E, RNase III, and StsR mutant strains. Bacterial strains were cultivated under microaerobic (A) or phototrophic (B) growth conditions. Optical densities were monitored at 660 nm (OD660) over a time span of 72 h. The mean values of independent biological triplicates of each strain are plotted. The standard deviation of the mean is indicated by the error bar.
Figure 2
Figure 2
Whole-cell absorbance spectra of the R. sphaeroides wild type and StsR, RNase III, and RNase E mutant strains. Bacterial strains were cultivated under microaerobic (left panels) or phototrophic (right panels) growth conditions. Whole-cell absorbance spectra of independent biological triplicates were measured after 4.5 h, 12 h, 24 h, 48 h, or 72 h of growth. The mean values of independent biological triplicates (cell count normalized to OD660) are plotted.
Figure 3
Figure 3
Principal component analysis of the total RNA profiling data obtained from wild type, rnets, rnc, and ΔStsR mutants under various growth conditions. Total RNA of biological triplicates from each genotype was analyzed by RNA-seq. Cultures for RNA isolation and subsequent RNA-seq analysis were grown under microaerobic or phototrophic conditions to exponential or late stationary phase (72 h), as indicated by the symbol legend.
Figure 4
Figure 4
Box plots showing the distribution of the log2 fold changes of all annotated genes (left panel) and of 89 photosynthesis-related genes as outlined in the main text (right panel) from microaerobic to phototrophic growth conditions. The log2 fold changes are taken from the corresponding DESeq2 analyses as described in the Materials and Methods section.
Figure 5
Figure 5
Heatmap visualizing the expression changes between microaerobic and phototrophic growth of photosynthesis-related genes (as log2 fold changes based on the DESeq2 analysis of the transcriptomes). As inclusion criterion for the heatmap, the plotted genes showed a significant expression (adjusted p-value < 0.05) in at least one comparison. Genes within one cluster (gray bars numbered 1 to 7, described in the main text) are localized adjacent to each other on the R. sphaeroides chromosome. The log2 fold change is depicted in a color code from blue (negative) to red (positive).
Figure 6
Figure 6
Normalized read coverage plot taken as a screenshot from the Integrated Genome Browser (IGB) showing reads for selected genes for bacteriochlorophyll (bchCX) and carotenoid (crtEF) syntheses. The y-axis count scale is indicated on the right side.
Figure 7
Figure 7
Normalized read coverage plot taken as a screenshot from the Integrated Genome Browser (IGB) showing reads for the appA gene, encoding an important regulator for the oxygen- and light-dependent expression of photosynthesis genes. The y-axis count scale is indicated on the right side.
Figure 8
Figure 8
Normalized read coverage plots taken as a screenshot from the Integrated Genome Browser (IGB) showing reads for the RSP_3092-3095 genes (A) and the StsR-encoding gene (B). The y-axis count scale is indicated on the right side of each panel.
Figure 9
Figure 9
Normalized read coverage plot taken as a screenshot from the Integrated Genome Browser (IGB) showing reads for the ccaF1 in the wild type and rnets mutant. The y-axis count scale is indicated on the right side. A large scale is depicted in panel B (A: 0–4000 reads; B: 0–12,000 reads).
Figure 10
Figure 10
Overview on the effects of growth conditions (from microaerobic to phototrophic) and growth phases (from exponential to stationary) on the expression of genes important for regulation of photosynthesis genes. Arrows indicate effects dependent on either light/oxygen conditions or the growth phase. Orange, purple, and red color indicates an additional dependency on RNase E, RNase III, or both RNase E and RNase III, respectively.

Similar articles

References

    1. Roop R.M., Gee J.M., Robertson G.T., Richardson J.M., Ng W.-L., Winkler M.E. Brucella stationary-phase gene expression and virulence. Annu. Rev. Microbiol. 2003;57:57–76. doi: 10.1146/annurev.micro.57.030502.090803. - DOI - PubMed
    1. McIntosh M., Eisenhardt K., Remes B., Konzer A., Klug G. Adaptation of the alphaproteobacterium Rhodobacter sphaeroides to stationary phase. Environ. Microbiol. 2019;21:4425–4445. doi: 10.1111/1462-2920.14809. - DOI - PubMed
    1. Bertrand R.L. Lag phase is a dynamic, organized, adaptive, and evolvable period that prepares bacteria for cell division. J. Bacteriol. 2019;201:10–128. doi: 10.1128/JB.00697-18. - DOI - PMC - PubMed
    1. Jaishankar J., Srivastava P. Molecular basis of stationary phase survival and applications. Front. Microbiol. 2017;8:2000. doi: 10.3389/fmicb.2017.02000. - DOI - PMC - PubMed
    1. Bakkeren E., Diard M., Hardt W.-D. Evolutionary causes and consequences of bacterial antibiotic persistence. Nat. Rev. Microbiol. 2020;18:479–490. doi: 10.1038/s41579-020-0378-z. - DOI - PubMed

MeSH terms

LinkOut - more resources