. 2024 Aug 22;25(16):9131.
doi: 10.3390/ijms25169131.

Combined Multi-Omics Analysis Reveals the Potential Role of ACADS in Yak Intramuscular Fat Deposition

Affiliations

Combined Multi-Omics Analysis Reveals the Potential Role of ACADS in Yak Intramuscular Fat Deposition

Fang Xu et al. Int J Mol Sci. .

Abstract

The Yak (Bos grunniens) is a special breed of livestock predominantly distributed in the Qinghai-Tibet Plateau of China. Intramuscular fat (IMF) content in beef cattle is a vital indicator of meat quality. In this study, RNA-Seq and Protein-Seq were respectively employed to sequence the transcriptome and proteome of the longissimus dorsi (LD) tissue from 4-year-old yaks with significant differences in IMF content under the same fattening conditions. Five overlapping genes (MYL3, ACADS, L2HGDH, IGFN1, and ENSBGRG00000000-926) were screened using combined analysis. Functional verification tests demonstrated that the key gene ACADS inhibited yak intramuscular preadipocyte (YIMA) differentiation and proliferation, promoted mitochondrial biogenesis gene expression, and increased the mitochondrial membrane potential (MMP). Furthermore, co-transfection experiments further demonstrated that interfering with ACADS reversed the effect of PPARα agonists in promoting lipid differentiation. In conclusion, ACADS potentially inhibits lipid deposition in YIAMs by regulating the PPARα signalling pathway. These findings offer insights into the molecular mechanisms underlying yak meat quality.

Keywords: ACADS; IMF; PPARα; proteome; transcriptome; yak.


Conflict of interest statement

The authors declare no conflicts of interest.

Figures
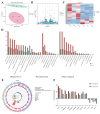
Figure 1
Figure 1
Overview of transcriptome data. (A) Principal component analysis (PCA). (B) Volcano plot of DEGs. (C) Heatmap of the hierarchical cluster analysis of all samples and DEGs. (D) Gene Ontology (GO) terms with significant enrichment of DEGs. (E) Circle map of the top 20 enriched KEGG pathways for DEGs. (F) RNA-Seq data verified by RT-qPCR.
Figure 2
Figure 2
Overview of proteome data. (A) PCA for H-IMF and L-IMF. (B) Volcano plot for the distribution of DEPs. (C) Heatmap of the hierarchical cluster analysis of all sequencing samples and DEPs. (D) GO terms with significant enrichment of DEPs. (E) Circle map of the top 20 enriched KEGG pathways for DEPs. (F) Functional clustering of DEPs by STRING 12.0.
Figure 3
Figure 3
Combined analysis of transcriptome and proteome data. (A) Venn diagram of all genes, all proteins, DEGs and DEPs. (B) Nine-quadrant diagram of DEGs and DEPs. (C) Top 30 enriched GO terms for both transcriptome and proteome data. (D) Significantly enriched KEGG pathways for both transcriptomics and proteomics data.
Figure 4
Figure 4
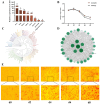
Analysis of the ACADS sequence and tissue expression profile. (A) Tissue expression pattern of ACADS in Maiwa yaks (n = 9), the same lowercase letter indicates that the difference is not significant (p > 0.05), and the different lowercase letters indicate significant differences (p < 0.05). (B) Expression levels of ACADS and PPARγ in YIMAs (n = 9). (C) Phylogenetic tree of ACADS protein sequence. (D) Protein interaction network of ACADS. (E) Construction of the lipid deposition model of YIMAs. Data are presented as the mean ± SEM.
Figure 5
Figure 5
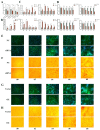
ACADS inhibits YIMA lipid accumulation. (A) Identification of siRNA interference efficiency and concentration screening of ACADS (n = 9). (B) Identification of efficiency and concentration screening of ACADS overexpression (n = 9). (C,D) Expression of lipid differentiation marker genes at five time points after ACADS interference or overexpression (n = 9). (E,F) BODIPY staining at five-time points after ACADS interference or overexpression. (G,H) Oil red O staining at five time points after ACADS interference or overexpression. * p < 0.05, ** p < 0.01, *** p < 0.001, ns p > 0.05. Data are presented as the mean ± SEM.
Figure 6
Figure 6
ACADS inhibited YIMA proliferation. (A,B) Expression of proliferation marker genes after interference or overexpression of ACADS (n = 9). (C,D) The OD value of CCK-8 at four time points after interference or overexpression of ACADS (n = 6). (E,F) EdU staining after interference or overexpression of ACADS. (G,H) Scratch test at four time points after interference or overexpression of ACADS. (I,J) Flow cytometry after interference or overexpression of ACADS. * p < 0.05, ** p < 0.01, ns p > 0.05. Data are presented as the mean ± SEM.
Figure 7
Figure 7
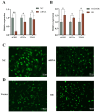
ACADS promotes mitochondrial biogenesis and the mitochondrial membrane potential (MMP). (A,B) Expression of mitochondrial marker genes after interference or overexpression of ACADS (n = 9). (C,D) Rh-123 staining after interference or overexpression of ACADS. * p < 0.05, ** p < 0.01, ns p > 0.05. Data are presented as the mean ± SEM.
Figure 8
Figure 8
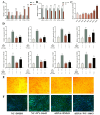
ACADS inhibits intramuscular fat (IMF) deposition by regulating the PPARα signalling pathway. (A,B) Expression of key genes in the PPARα signalling pathway after the interference or overexpression of ACADS (n = 9). (C) PPARα activator Wy-14643 concentration screening (n = 9). (D) Expression of key genes in the PPARα pathway and lipid differentiation marker genes in different treatment control groups (NC, siRNA, Wy-14643, siRNA+Wy-14643), “+” means to add, “−” means not to add, the same lowercase letter indicates that the difference is not significant (p > 0.05), the different lowercase letters indicate significant differences (p < 0.05). (E) Oil red O staining under different treatment control groups. (F) BODIPY staining under different treatment control groups. * p < 0.05, ** p < 0.01, ns p > 0.05. Data are presented as the mean ± SEM.

Similar articles

Cited by

References

    1. Wang S., Shi J.H., Wang Z.S., Hu R., Wang J.M., Xue B., Peng Q.H. Solation and Identification of preadipocytes from different parts of yak and expression of key genes for differentiation. J. Anim. Sci. Vet. Med. 2022;53:755–765.
    1. Mu Y.P., Li S., Li X.M. Report on Feeding Effect of Jiajiawang Lactic Acid Complex Acidifier. J. Anim. Sci. Vet. Med. 2011;30:7–8.
    1. Hu J.L., Zhuang L., Wu S. Research Progress on Candidate Genes Influencing Meat Quality Traits in Yaks. Chin. J. Anim. Sci. 2021;57:10–15.
    1. Wang Y.L. Master’s Thesis. Yanbian University; Yanbian, China: 2009. Effects of Dietary Energy Level and Source on the Expression of Genes Related to Fat Metabolism in Skeletal Muscle of Finishing Pigs.
    1. Mota de Sá P., Richard A.J., Hang H., Stephens J.M. Transcriptional Regulation of Adipogenesis. Compr. Physiol. 2017;7:635–674. - PubMed

LinkOut - more resources