Review
. 2024 Jul 29;14(8):803.
doi: 10.3390/jpm14080803.

A Comparison of Norepinephrine versus Phenylephrine to Prevent Hypotension after Spinal Anesthesia for Cesarean Section: Systematic Review and Meta-Analysis

Affiliations
Review

A Comparison of Norepinephrine versus Phenylephrine to Prevent Hypotension after Spinal Anesthesia for Cesarean Section: Systematic Review and Meta-Analysis

Hyun Kang et al. J Pers Med. .

Abstract

Background: This systematic review and meta-analysis aimed to compare the effects of using phenylephrine or norepinephrine on the pH and base excess (BE) of the umbilical artery and vein in parturients undergoing cesarean section.

Methods: The study protocol was registered in INPLASY. Independent researchers searched Ovid-Medline, Ovid-EMBASE, and Cochrane Central Register of Controlled Trials (CENTRAL) databases and Google Scholar for relevant randomized controlled trials (RCTs). The primary outcome of this study was the umbilical artery (UA) or umbilical vein (UV) pH as neonatal condition at birth, and the secondary outcome was the UA or UV BE as an additional prognostic value over the measurement of umbilical pH.

Results: There was no evidence of a difference between phenylephrine and norepinephrine for overall, UA, and UV pH (mean difference (MD) -0.001, 95% confidence interval (CI) -0.004 to 0.007; MD 0.000, 95%CI -0.004 to 0.004; and MD 0.002, 95%CI -0.013 to 0.017). There was also no evidence of a difference between phenylephrine and norepinephrine for overall, UA, and UV BE (MD 0.096, 95% CI -0.258 to 0.451; MD 0.076, 95%CI -0.141 to 0.294; and MD 0.121, 95%CI; -0.569 to 0.811). A meta-regression showed that factors such as umbilical artery or vein, infusion method, single or twin, and the number of parturients per study had no effect on the UA pH, UV pH, UA BE, or UV BE. No evidence of publication bias was detected.

Conclusions: There was no evidence of a difference between phenylephrine and norepinephrine for umbilical pH and BE. A subgroup analysis and meta-regression also did not show evidence of differences.

Keywords: anesthesia; cesarean section; hypotension; meta-analysis; norepinephrine; phenylephrine; spinal; vasoconstrictor agents.


Conflict of interest statement

No potential conflicts of interest relevant to this article were reported.

Figures

Figure 1
Figure 1
Flowchart study of the selection.
Figure 2
Figure 2
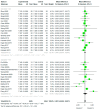
Forest plot for umbilical artery (UA) or umbilical vein (UV) pH. The figure depicts individual trials as filled green circles, with relative sample size and the 95% confidence interval (CI) of the difference as a solid line. The diamond shape indicates the pooled estimate and uncertainty regarding the combined effect [4,11,12,13,14,15,16,17,18,19,20,21,22,23,24,25,26,27,28,29,30].
Figure 3
Figure 3
Meta-regression of umbilical pH by number of parturients. The x-axis represents the number of parturients and the y-axis represents mean difference in pH. The size of the data marker is proportional to the weight in the meta-regression.
Figure 4
Figure 4
Funnel plot for umbilical pH.
Figure 5
Figure 5
Forest plot for umbilical artery (UA) or umbilical vein (UV) BE. The figure depicts individual trials as filled green circles, with relative sample size and the 95% confidence interval (CI) of the difference as a solid line. The diamond shape indicates the pooled estimate and uncertainty for the combined effect [4,13,15,16,17,19,20,22,23,25,26,27,28,29,30].
Figure 6
Figure 6
Meta-regression of umbilical base excess by number of parturients. The s-axis represents the number of parturients and the y-axis represents the mean difference in base excess. The size of the data marker is proportional to the weight in the meta-regression.
Figure 7
Figure 7
Funnel plot for umbilical base excess.
Figure 8
Figure 8
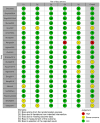
The risk of bias assessment [4,11,12,13,14,15,16,17,18,19,20,21,22,23,24,25,26,27,28,29,30].

Similar articles

Cited by

References

    1. James F.M., 3rd, Greiss F.C., Jr., Kemp R.A. An evaluation of vasopressor therapy for maternal hypotension during spinal anesthesia. Anesthesiology. 1970;33:25–34. doi: 10.1097/00000542-197007000-00010. - DOI - PubMed
    1. Ngan Kee W.D., Khaw K.S., Tan P.E., Ng F.F., Karmakar M.K. Placental transfer and fetal metabolic effects of phenylephrine and ephedrine during spinal anesthesia for cesarean delivery. Anesthesiology. 2009;111:506–512. doi: 10.1097/ALN.0b013e3181b160a3. - DOI - PubMed
    1. Yoon H.J., Cho H.J., Lee I.H., Jee Y.S., Kim S.M. Comparison of hemodynamic changes between phenylephrine and combined phenylephrine and glycopyrrolate groups after spinal anesthesia for cesarean delivery. Korean J. Anesthesiol. 2012;62:35–39. doi: 10.4097/kjae.2012.62.1.35. - DOI - PMC - PubMed
    1. Ngan Kee W.D., Lee S.W., Ng F.F., Tan P.E., Khaw K.S. Randomized double-blinded comparison of norepinephrine and phenylephrine for maintenance of blood pressure during spinal anesthesia for cesarean delivery. Anesthesiology. 2015;122:736–745. doi: 10.1097/ALN.0000000000000601. - DOI - PubMed
    1. Shamseer L., Moher D., Clarke M., Ghersi D., Liberati A., Petticrew M., Shekelle P., Stewart L. A. Preferred reporting items for systematic review and meta-analysis protocols (PRISMA-P) 2015: Elaboration and explanation. BMJ. 2015;350:g7647. doi: 10.1136/bmj.g7647. - DOI - PubMed

LinkOut - more resources